Categories
Forex Course

132. Rules Of Trading Divergence

Introduction

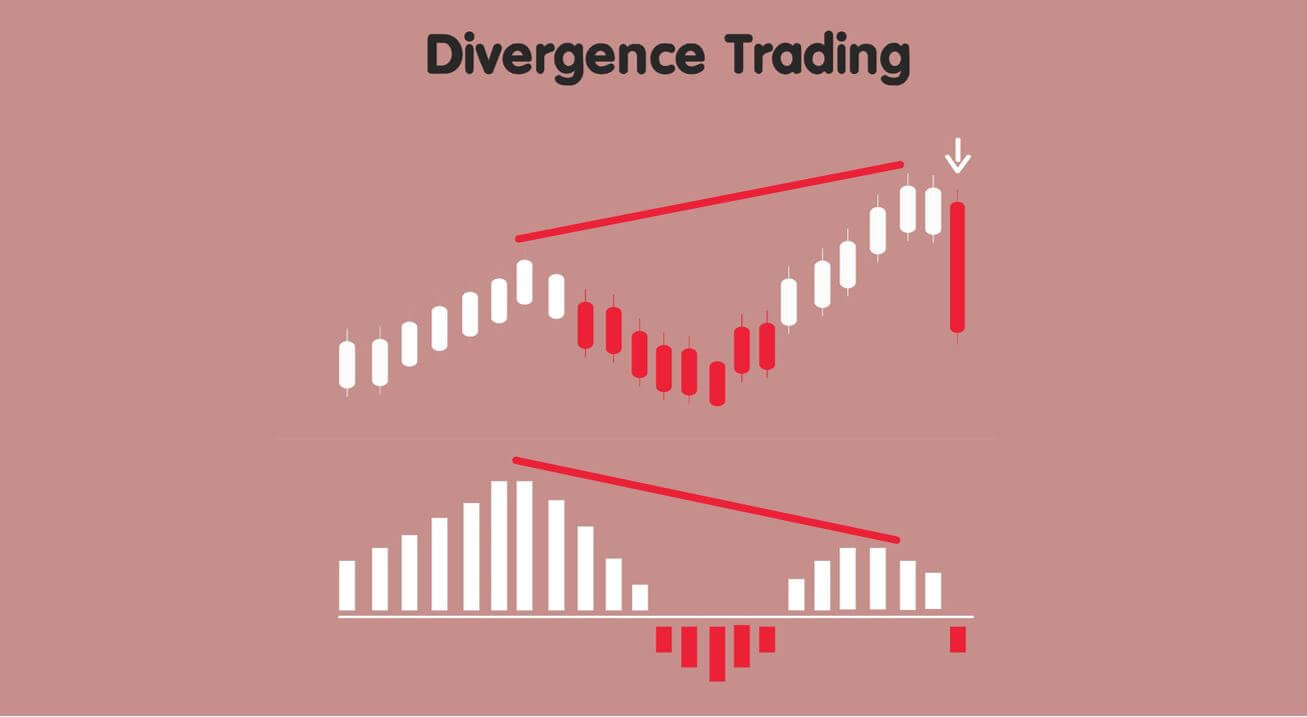
Divergence is used by traders to determine if there is going to be a reversal or a trend continuation. They sometimes work exceptionally well and, at times, goes entirely in the anticipated direction. Thus, to increase the consistency of divergence, we have listed out some rules for trading divergence.

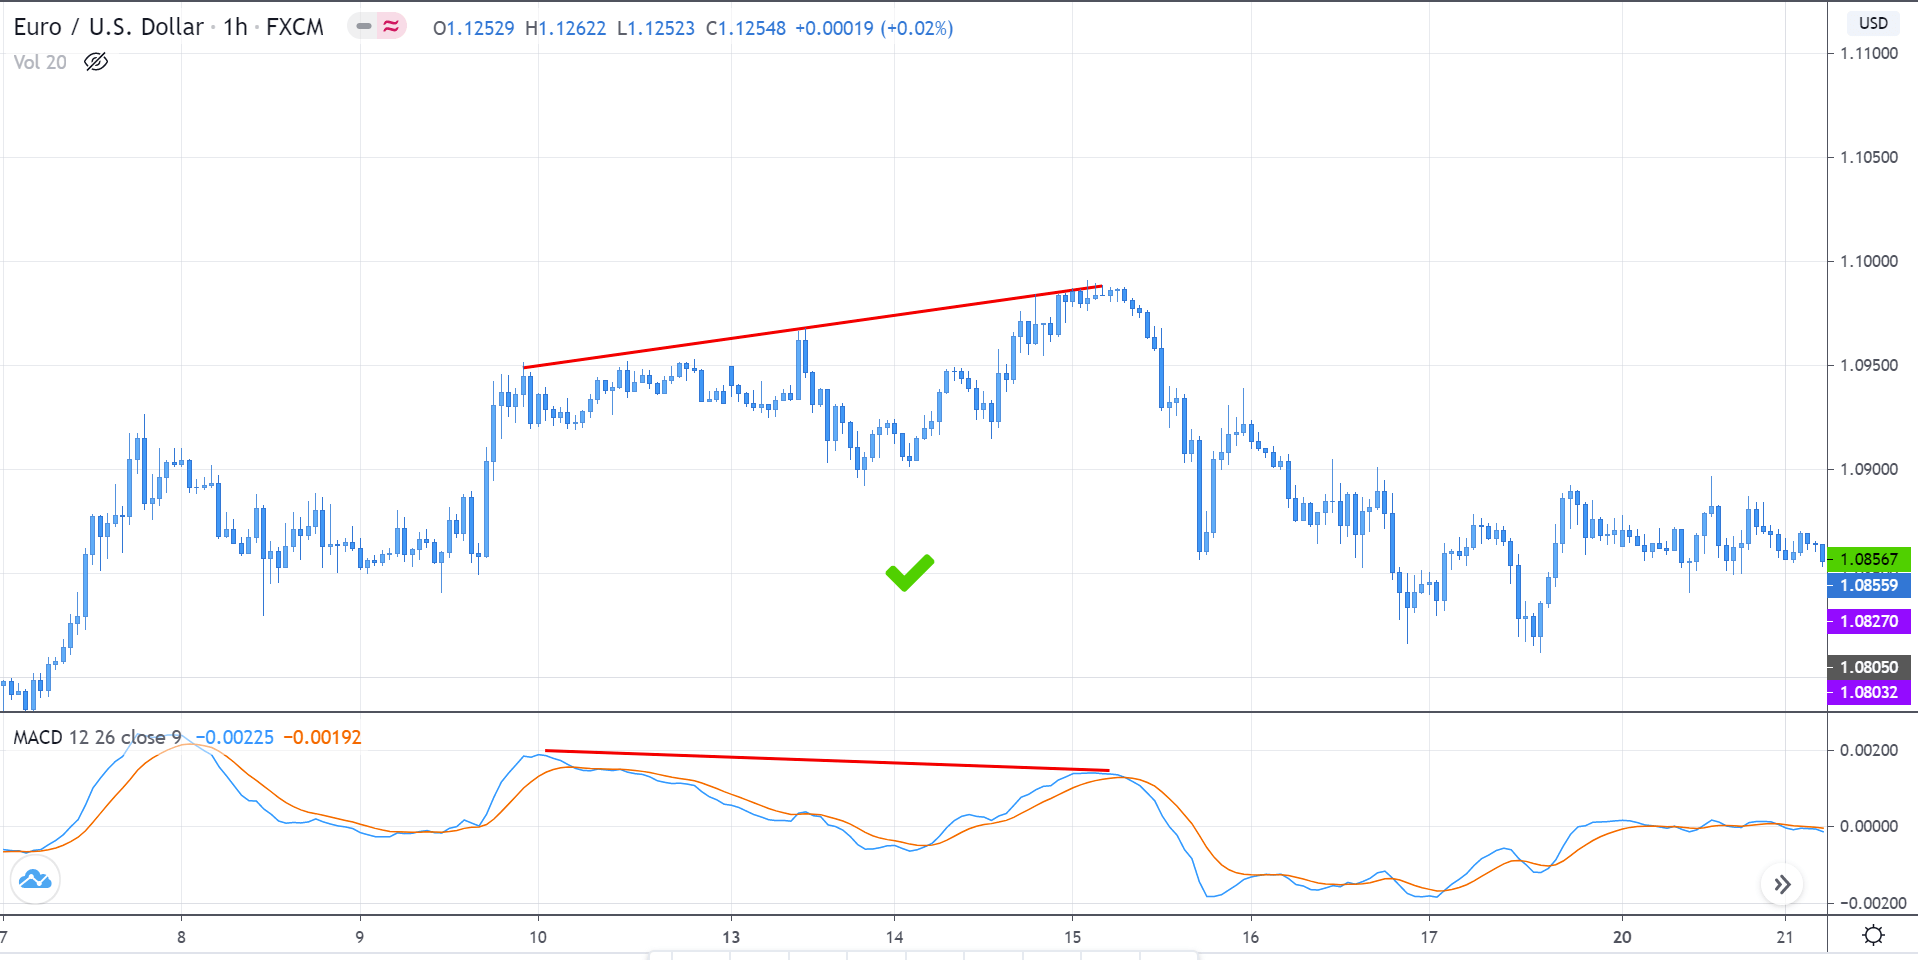
#1 Focus only on four price patterns

For legitimate divergence to exists, their price pattern must be either of the following:

If spot a divergence on the indicator that does not have either of the above price action, then the divergence will not work.

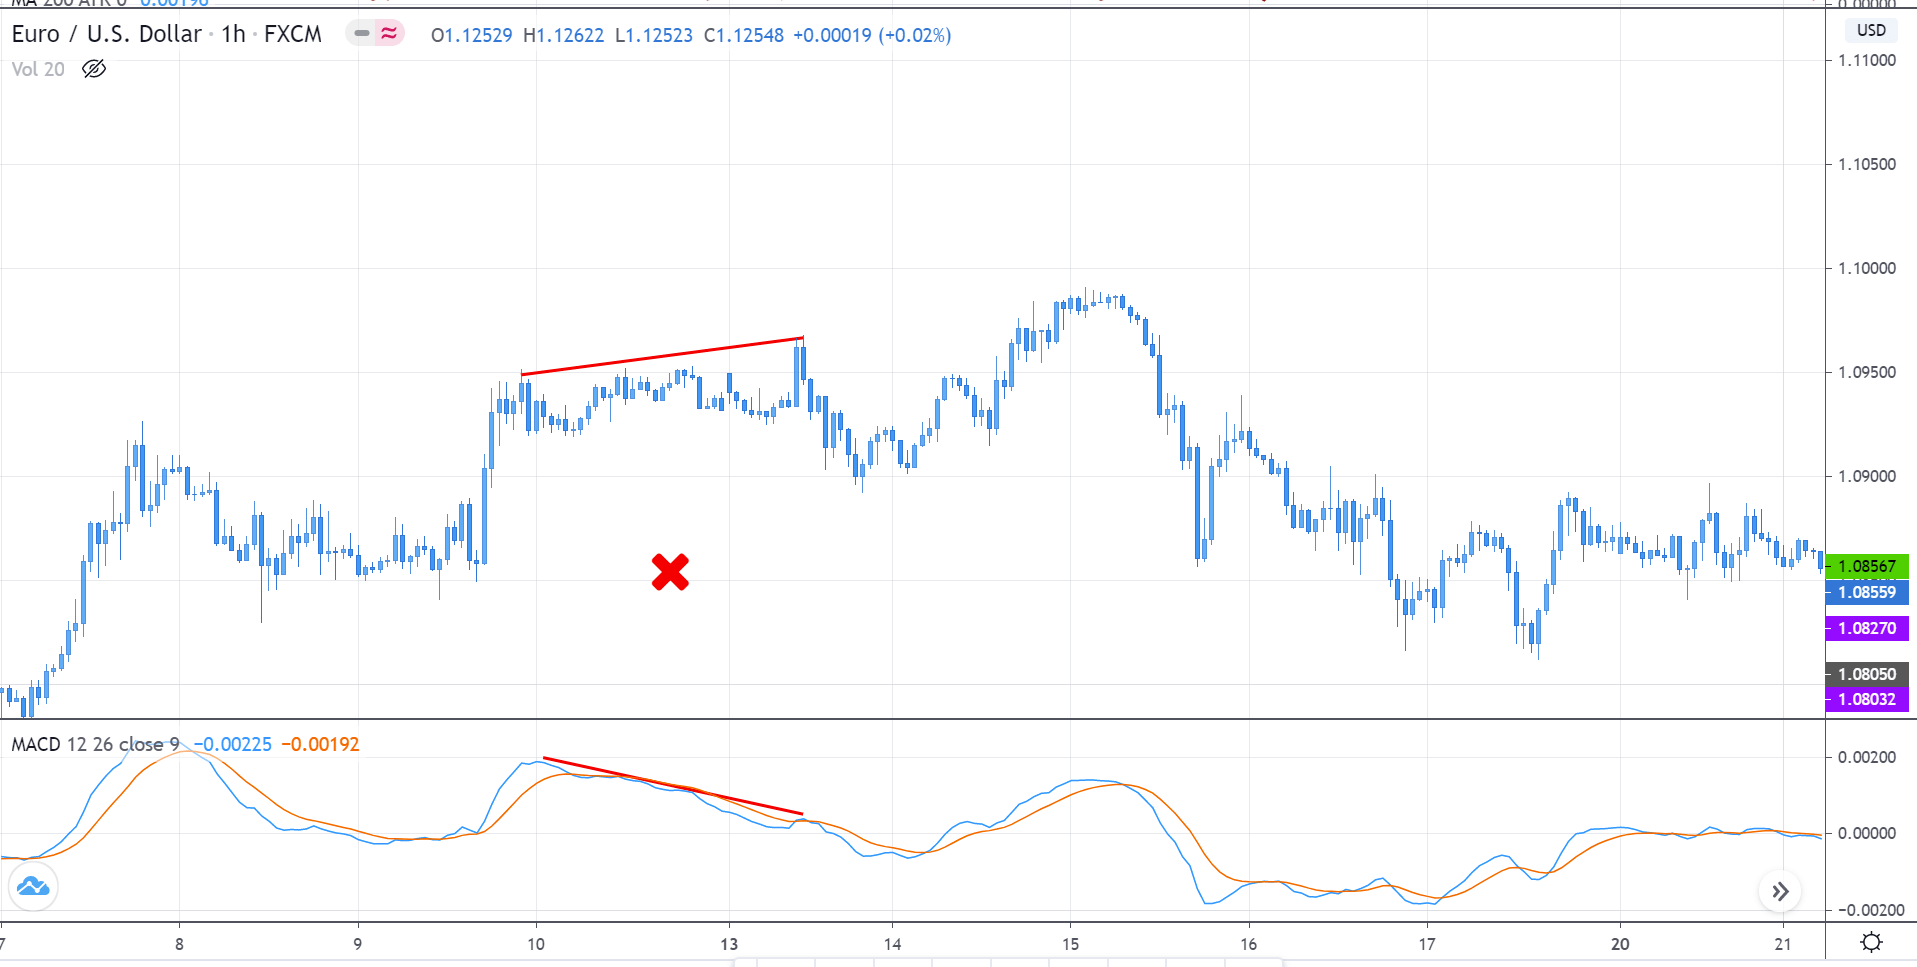
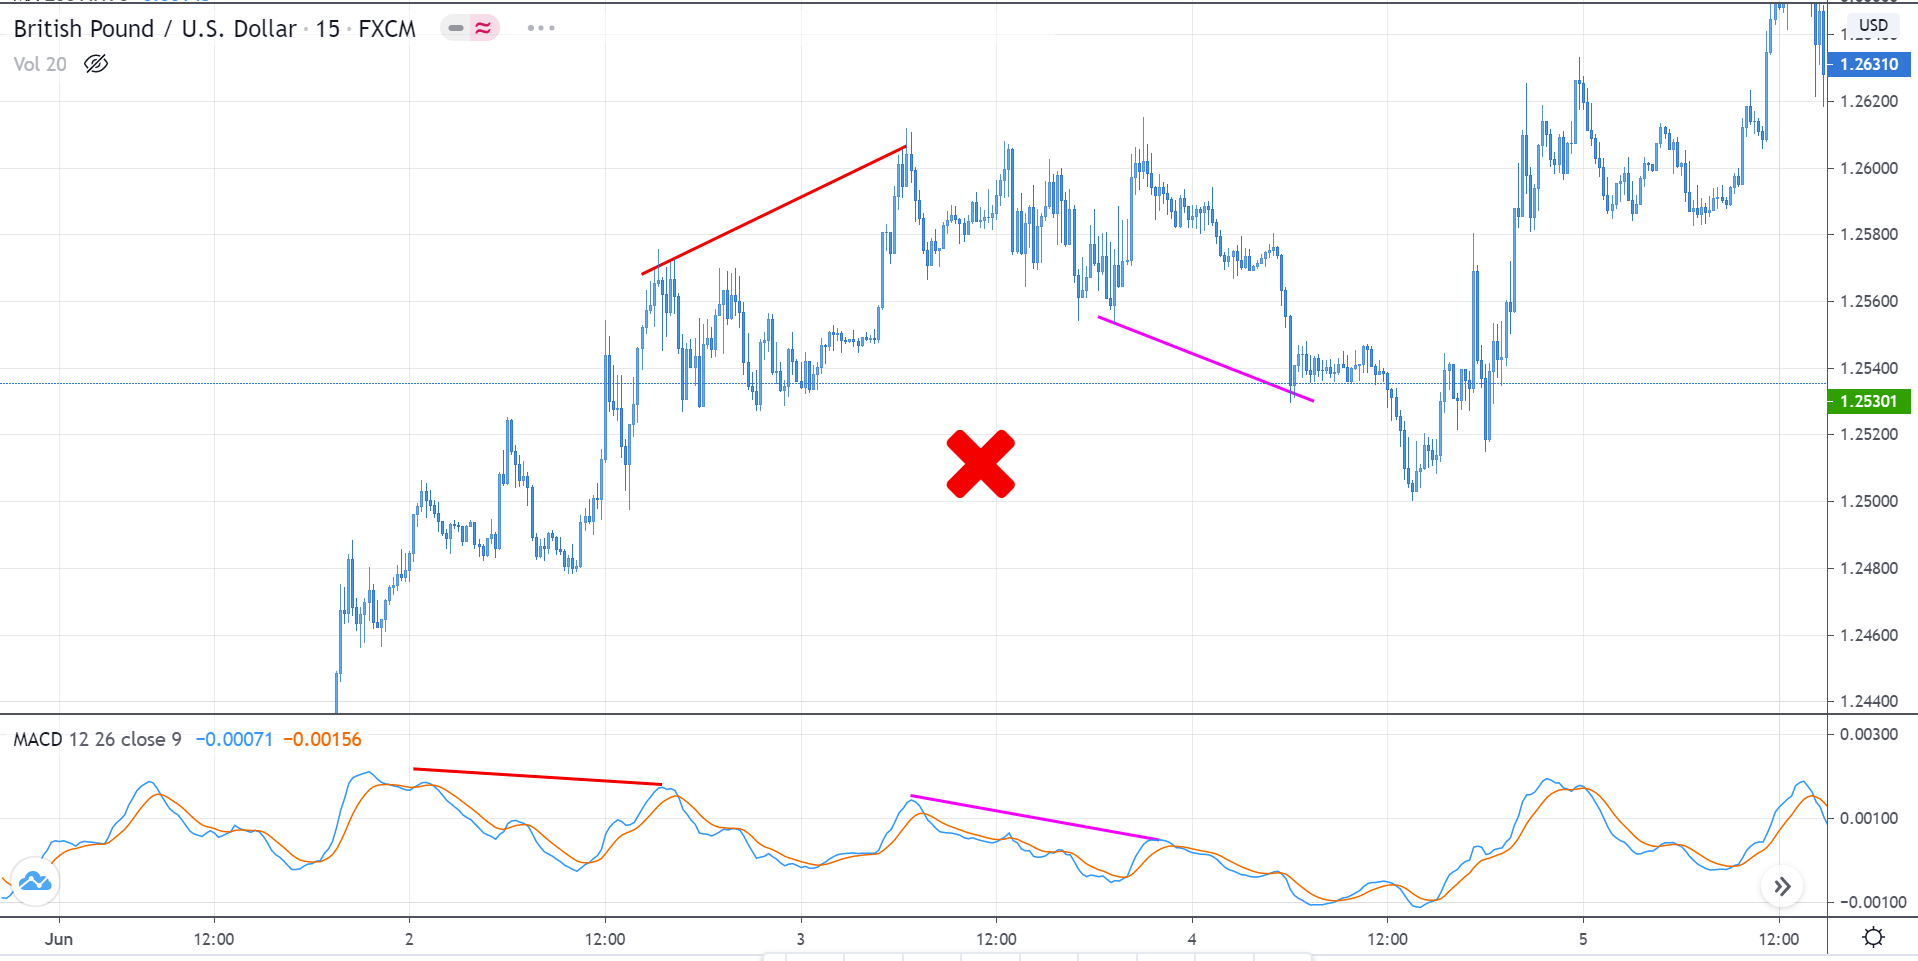
Several times, the price consolidates and shows divergence on the indicator. But there will not be any proper top or bottom to confirm that the divergence is real. Thus, such divergence must be ignored.

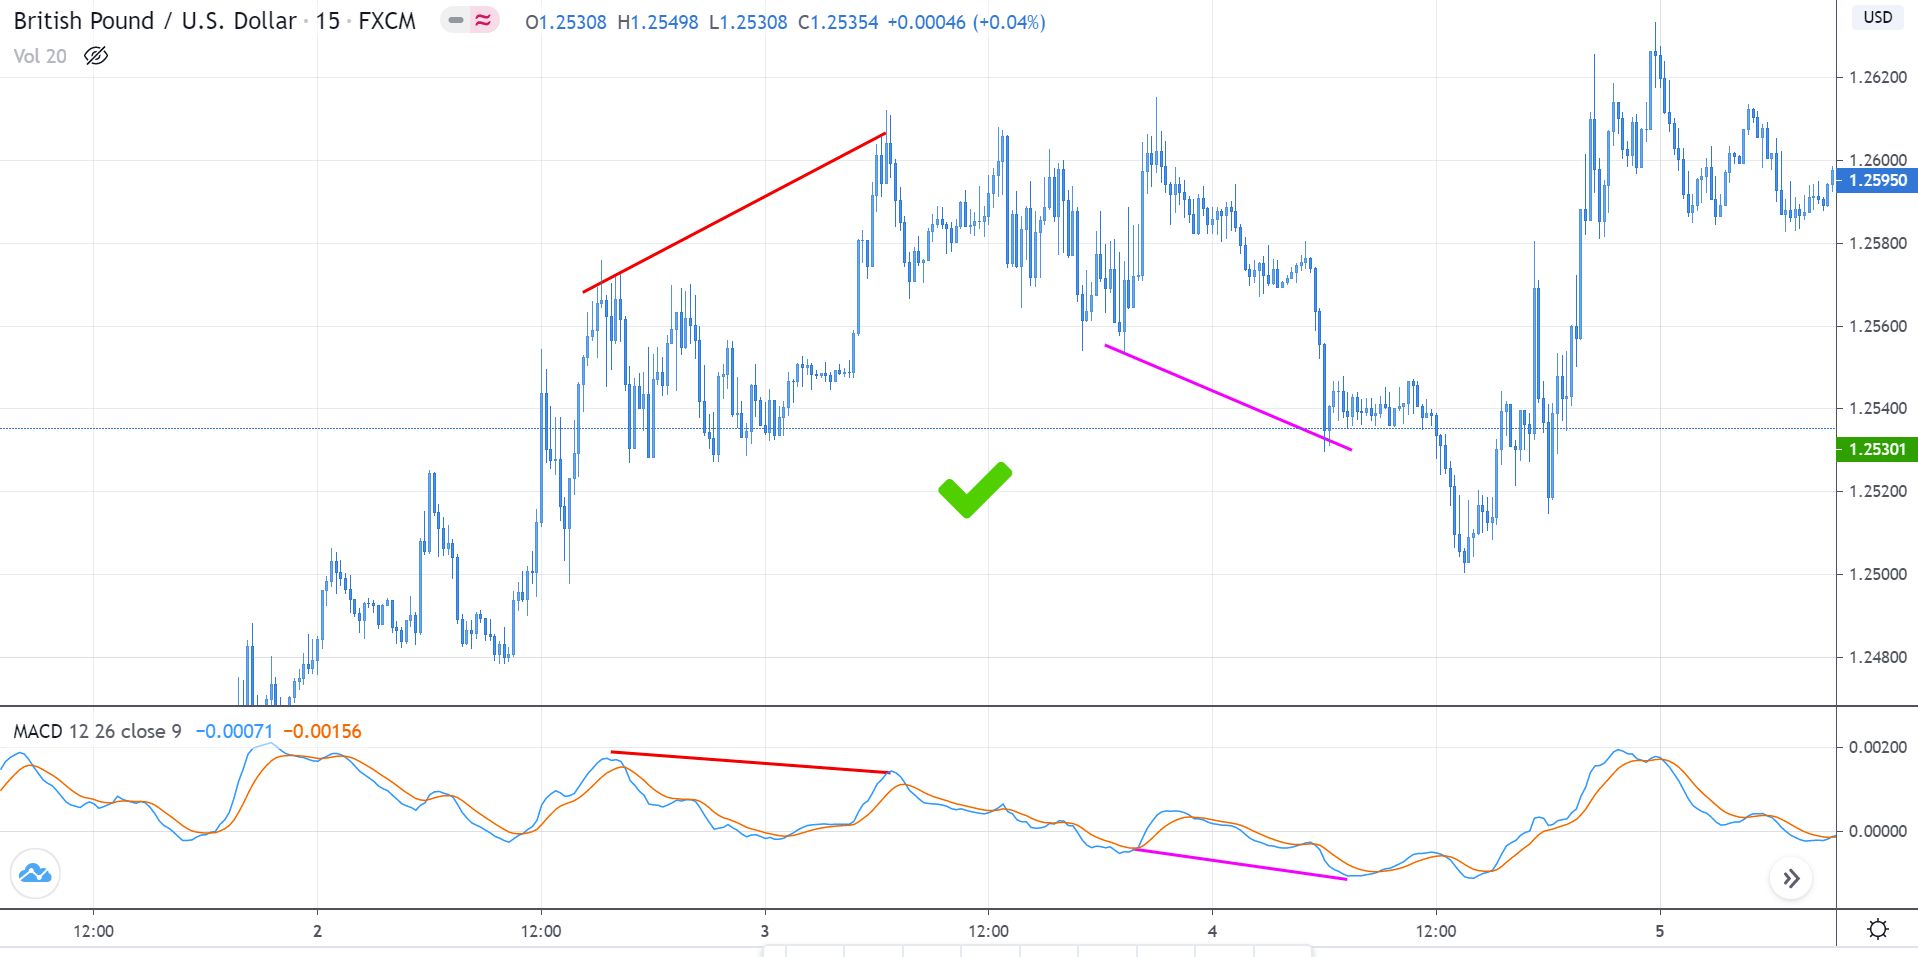
#2 Connect the lines only for significant highs and lows

Now that you know, we are concerned with one of the four patterns – higher high, lower low, equal high, and equal low. When it comes to drawing the trend lines, you must make sure the highs and lows are major enough to be considered. A little bump up or dips that may look like a higher high or lower low must be ignored.

#3 Mark the corresponding highs and low

Always start by drawing the highs and lows from the price charts. Then you mark the highs and lows on the indicator corresponding with the highs and lows with the price.

Pro tip: Draw two vertical lines to perfectly mark the corresponding highs and lows.

#4 Compare the length and strength of the pushes

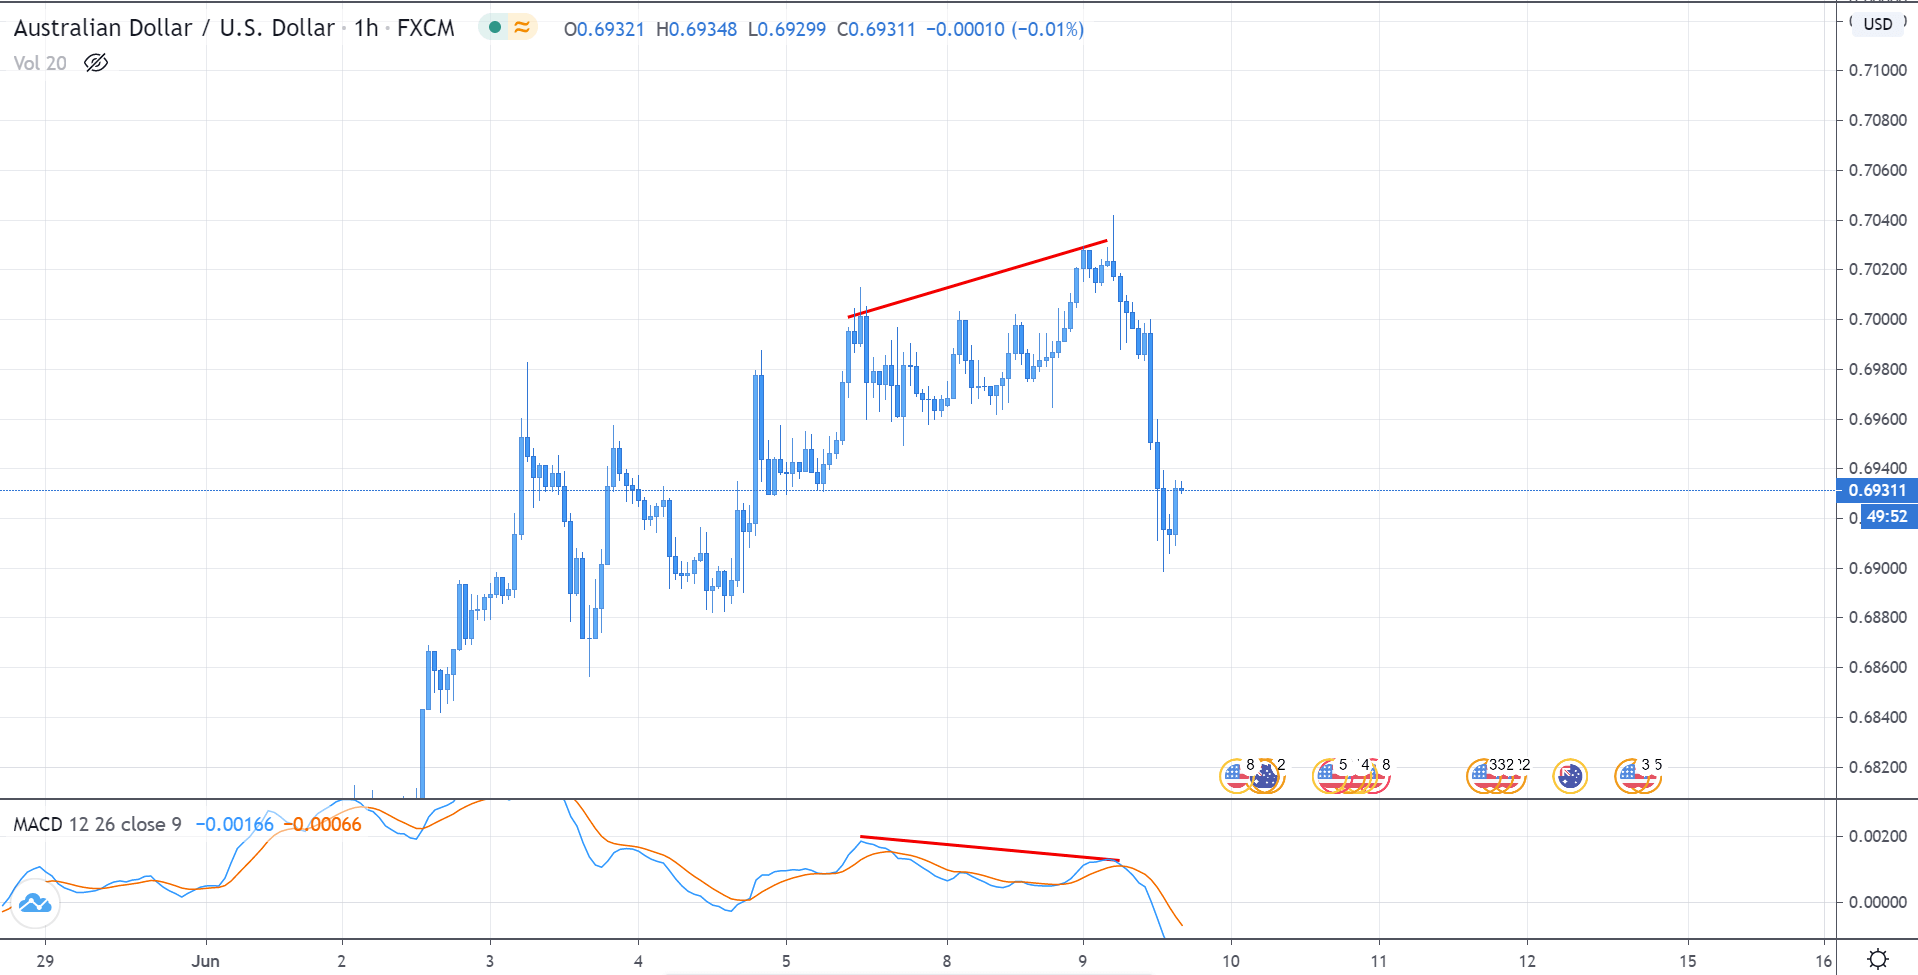
This is one of the most important points to consider. In a trending market, the price makes higher highs or lower lows. But, when there is a divergence for a particular push, you must make sure that the momentum is weaker, and length is smaller than the previous trend sequence.

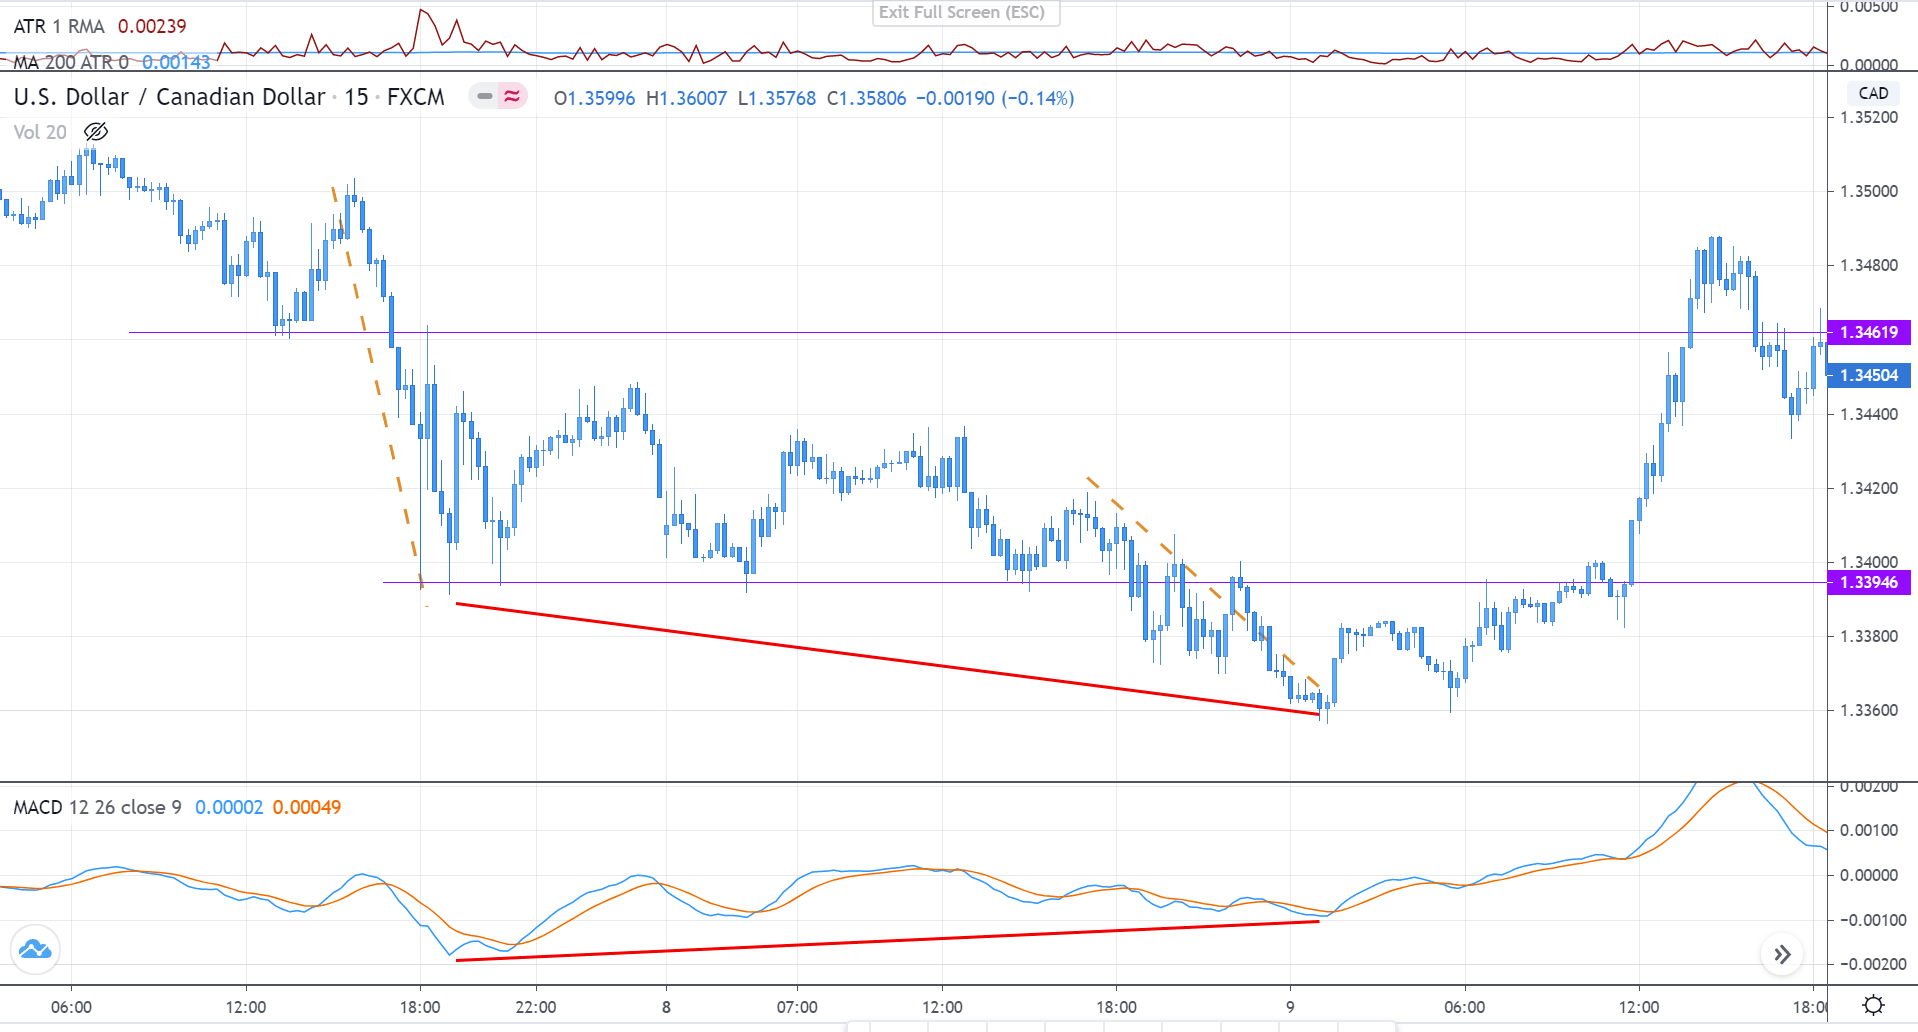
In the above chart, we can clearly ascertain that the lower low, which had divergence was much weaker and shorter than the previous push. As a result, the market reversed and had a big bull run.

#5 Do not try catching a falling knife

There are times when the market does not consolidate before reversing its direction. There could not be any entry for such trades. But there are traders who chase the market and end up buying at very high prices, which could be bad for business. Thus, you be patient and wait for the right opportunity, because buying at higher prices, could hinder the risk to reward ratio, leading to a high risk for small profits.

[wp_quiz id=”78434″]
Categories
Forex Course

127. Getting started with ‘Divergence Trading’

Introduction

There are several types of technical traders in the forex industry. Some trade based on price action while some trade using indicators. Price action traders typically do not use any indicator, but the Divergence is an exception to it. Divergence is an indicator concept that can yield immense risk to reward if used correctly. It is a powerful tool that helps traders catch the absolute peak and trough of the market.

What is Divergence?

Generally, the meaning of Divergence is to move apart. And the meaning of trading is no different. In forex, Divergence is a scenario when the price charts do not agree with the movement of the indicator. In a sense, if the price moves in one direction, the indicator moves in the other direction.

Formation of Divergence

Divergence can be found by comparing the price action on the charts with an oscillator indicator. Typically, Divergence is formed in trending markets. That is, they occur in markets that move making higher highs and or lower lows.

Consider a market a market making higher highs and higher lows. The job of an oscillator indicator is to follow the price action. Thus, the indicator should also follow an upward trajectory. But, if the charts make higher highs and the indicator makes an equal or higher low, then we conclude that there is a divergence in the market.

Significance of Divergence

Divergence is used to signify that there is something not right in the market and the uptrend. In an uptrend, for instance, the market breaks above the recent resistance (high), makes a new high, retraces to the Support & Resistance level, and continues the same cycle. But when the market makes a higher high with Divergence, there is a high possibility that the market might not hold at the S&R level. The market could reverse or might drop slightly below the S&R and then continue the uptrend.

Indicators used to Identify Divergence

Divergences can be identified using oscillator indicators. An oscillator, going by the name, moves between two levels – overbought and oversold. Typically, a level above 70-80 is considered overbought, and a level below 20-30 indicates an oversold market.

Following are the most commonly used indicators to identify Divergence

  1. Relative Strength Index (RSI)
  2. Stochastic Indicator
  3. Moving Average Convergence Divergence (MACD)

Types of Divergence

Based on the direction of the market, there are two types of Divergence:

Regular Divergence

This is the most used type of Divergence and very easy to spot. They are found at the top or bottom of a trend and are used to give a reversal signal. Regular Divergence can again be split into two types: Bullish Divergence | Bearish Divergence.

Hidden Divergence

Hidden divergences are relatively trickier to spot. Converse to regular Divergence, hidden Divergence is used for a trend continuation indication. They are typically found in the middle of a trend. Hidden divergences, too, can be divided into two types: Hidden Bullish divergence | Hidden Bearish Divergence.

That’s about the introduction to divergences. In the next lesson, we shall elaborate on each of the divergence types.

[wp_quiz id=”77516″]