Categories
Forex Basic Strategies

Reliable ‘ADX’ Trading Strategy To Trade Forex Major Currency Pairs

Introduction 

We have talked a lot about trading strategies involving MACD, RSI, Volume and Stochastic. However, we haven’t covered much about the ADX indicator and its application. Today’s strategy is based on the ADX, which will help us in measuring the strength of a trend on any given time frame. The Average Directional Index (ADX) is a tool that is designed to measure the strength of a trend. When ADX is used in combination with other trading strategies, we get a complete understanding of the market trend and its efficacy.

Learning how to use the ADX is very easy. It ranges from a scale 0-100, 100 indicating a strong trend and 0 indicating a non-existent trend. If the ADX is close to 0, we can expect a sideways action in the market, meaning the market will neither go up or down but stay around the same value for some time. Remember, ADX will tell us about the strength of the trend. It does not guide us in the future direction of the market. For that reason, it is necessary to use concepts of market trend, retracement, and other technical indicators. ADX values of 50 and above are considered high, while ADX values of 20 and below are considered low. Weak trends are indicated by values of 20 and below.

Time Frame

The strategy works well on most time frames, including 15 minutes, 1 hour, 4 hours and Daily. However, we do not recommend applying the strategy on very low time frames due to market noise and liquidity issues.

Indicators

We use the Average Directional Index (ADX) and Simple Moving Average (SMA) indicators in the strategy.

Currency Pairs

The strategy is applicable on most currency pairs listed on the broker’s platform. However, it is advised to apply the strategy on major currency pairs only.

Strategy Concept

The ADX indicator ensures that we only trade when there is a strong trend in the market, regardless of the time frame. Here, even before looking at the candlesticks, we wait for the ADX indicator to show a reading above 60. A reading above 60 signals a strong trend and the likelihood of a trend continuation. We all know that the trend is our friend, but without gauging the strength of the trend, it can be dangerous to be a part of that trend. This is why we use the ADX indicator for trend trading.

The ADX is only limited to understanding the strength of the trend. However, in order to trade a ‘trend’, we also need to look at price action and trend continuation pattern in the market. Therefore, we use the concept of retracement and moving average to time our ‘entries.’ As this a trend trading strategy, we cannot use the rules for catching a reversal in the market.

We determine the take-profit and stop-loss levels based on ‘highs’ and ‘lows’ of the trend and retracement. Let us, straight dive, into the rules of the strategy.

Trade Setup

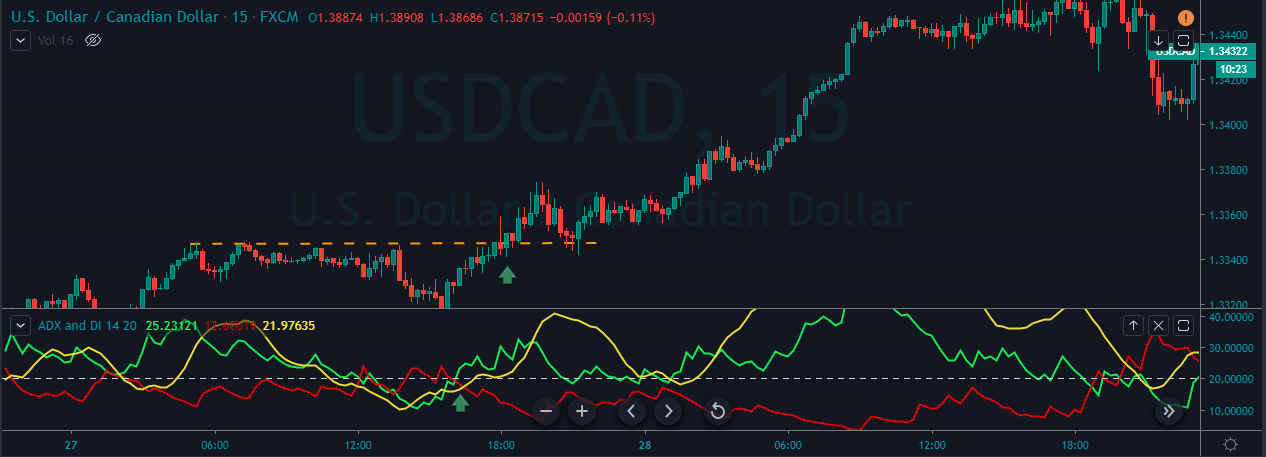
In order to explain the strategy, we will be executing a ‘long’ trade in USD/CAD currency pair using the rules of the strategy. Here are the steps to execute the strategy.

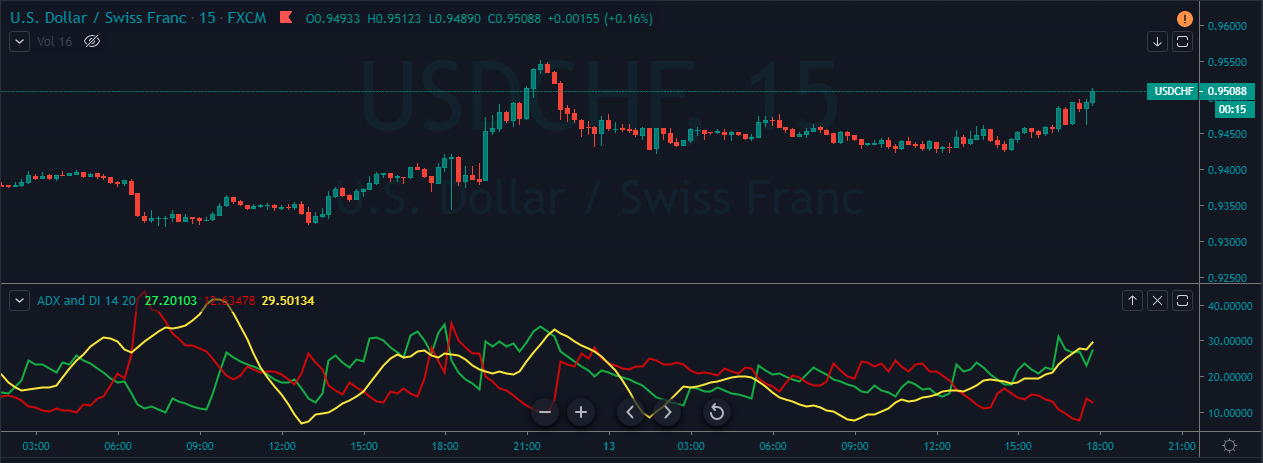
Step 1: Firstly, we have to plot the ADX and moving average indicators on the chart with their default setting. Before we actually look at the price action of the market, we have to watch the ADX indicator and its indication. Once the ADX crosses above 60, we look at the trend market and wait for an appropriate retracement.

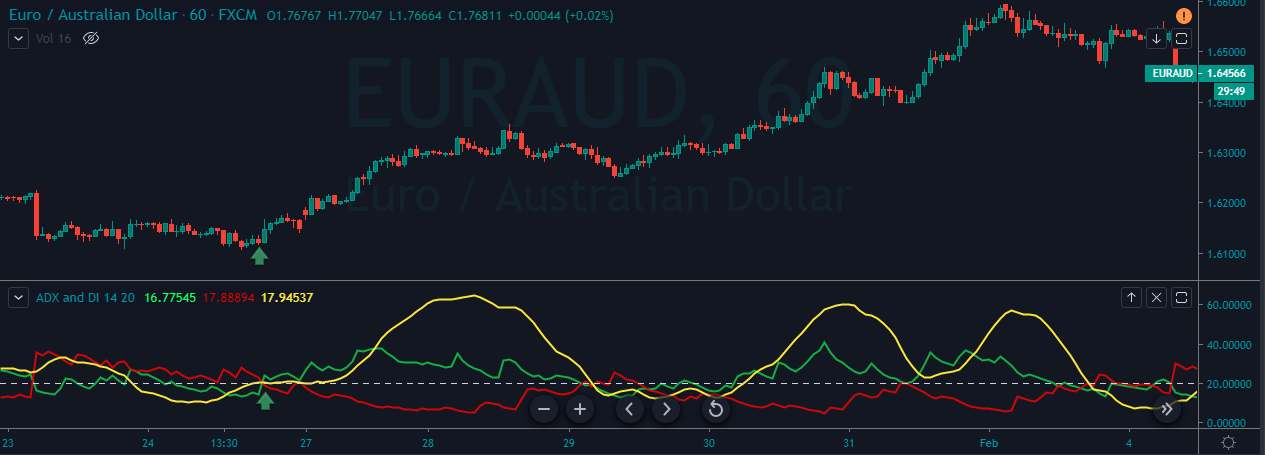
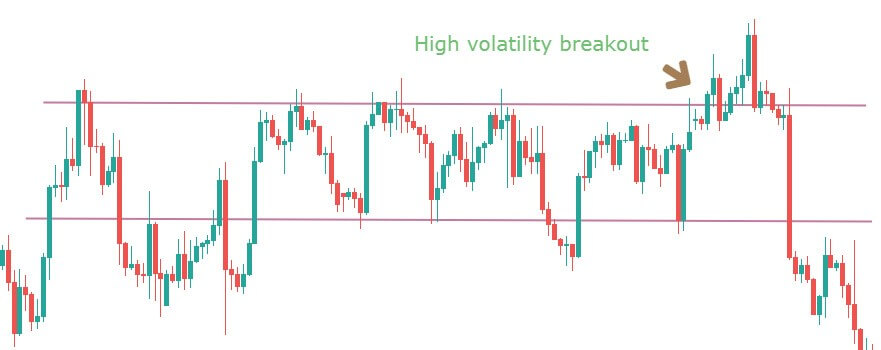
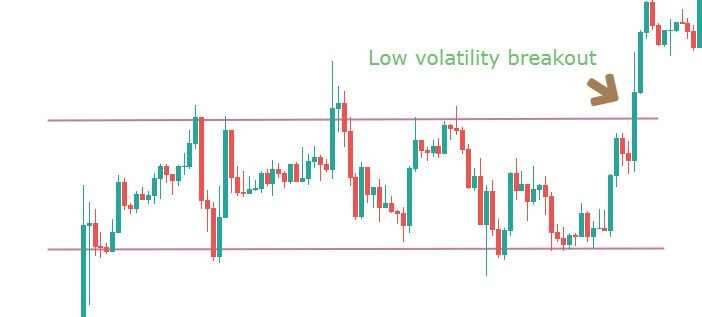
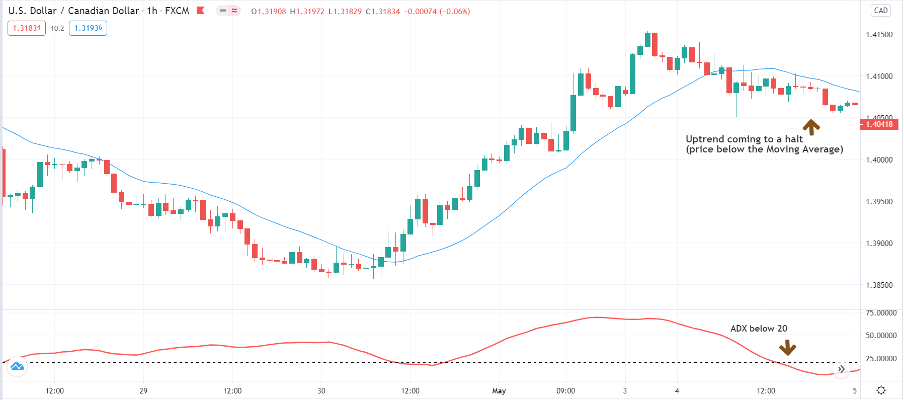
Step 2: After gauging the strength of the trend using the ADX indicator, we need to wait for a suitable price retracement. The retracement, in other words, indicates a halt of the major trend of the market. In an uptrend, if price falls below the moving average and stays there, we say that the market has entered into retracement mode.

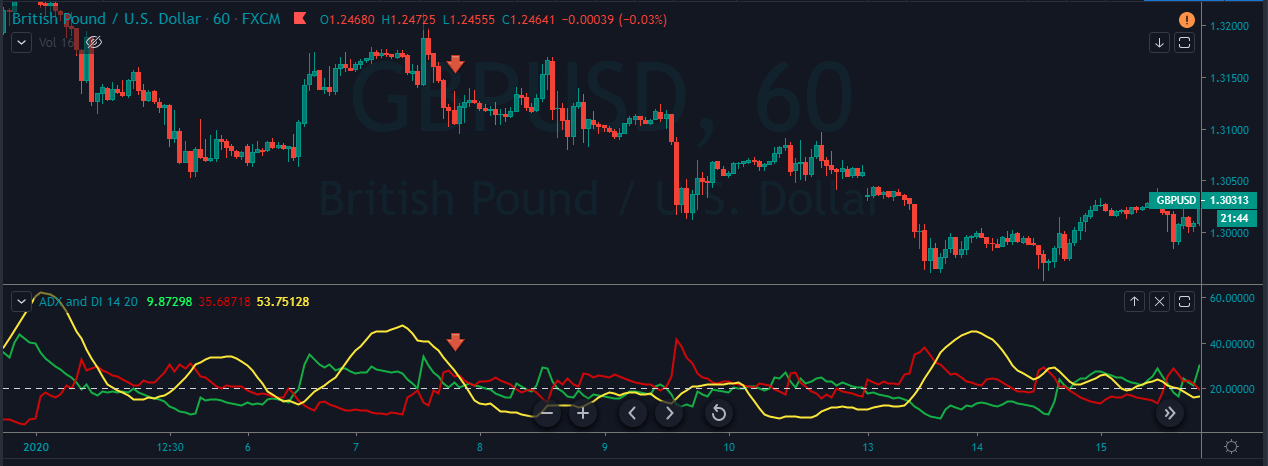
In a downtrend, if price rises above the moving average and stays there, we say that the market has entered into retracement mode. At this point, we are not sure if this is a retracement of the trend or is a start of the reversal. In order to confirm that it is a retracement, we again use the ADX indicator and check its reading. An ADX reading below 20 indicates that the ‘halt’ is actually a retracement of the major trend and not reversal.

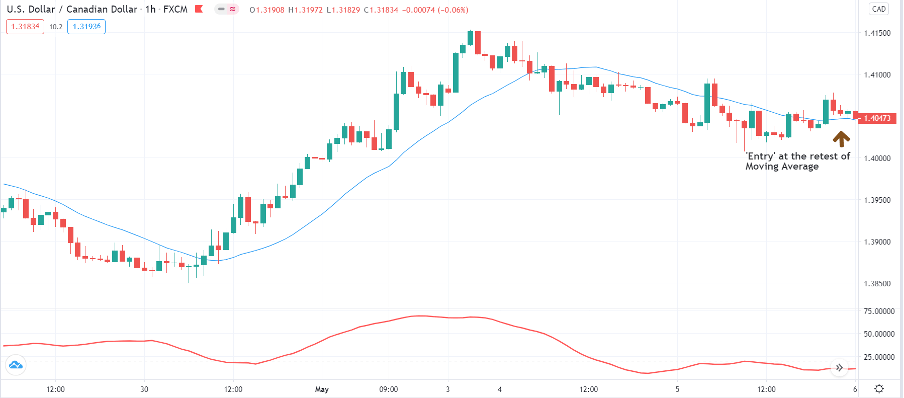
Step 3: Now that we have got a confirmation from the ADX indicator that the market has gone into retracement mode, we should know how to enter the market. We go ‘long’ in the market when price crosses above the moving average and stays there for at least 4 or 5 candles. Similarly, we go ‘short’ in the market when price crosses below the moving average and stays there for at least 4 or 5 candles. As we just saw, the rule for entering a trade in this strategy is pretty simple and not complex at all.

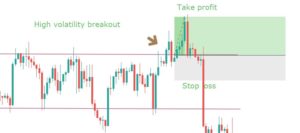
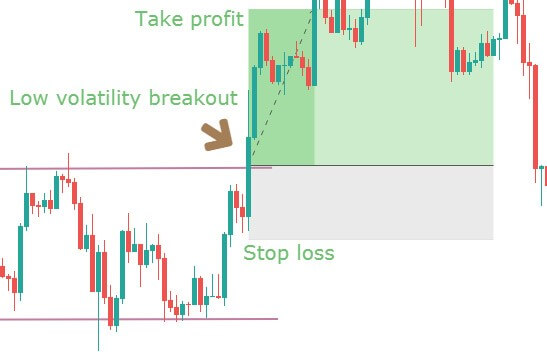
Step 4: The last step of the strategy is to determine stop-loss and take-profit levels for the trade. We set take-profit near the ‘higher high’ of the uptrend while ‘long’ in the market and near the last ‘lower low’ of the downtrend while ‘short’ in the market. Stop-loss is placed below the previous ‘low’ of the retracement in an uptrend and above the ‘high’ of the retracement in a downtrend.

Strategy Roundup

The new ADX strategy gives very useful information which most of the times we never pay attention to. There are not many indicators which truly tell about the strength of the trend. ADX is one such indicator which tells if the trend is moving in strong fashion or not. At the same time, it is important to consider the strength of the pullback using price action and ADX indicator. Best profits come from catching strong trends, and this strategy helps us in accomplishing that.

Categories
Forex Course

140. Market Environment – Summary

Introduction

In a few of the past course lessons, we have discussed some of the most crucial topics related to the Forex market environment. Starting from the ‘state of the market,’ we have understood what trending and ranging markets are. We also have differentiated the concepts of retracements and reversals, which are vital for identifying accurate entries and exits.

One of the most valuable things we have comprehended is to identify ways for spotting potential market reversals. Finally, we understood how professional traders read different market environments and states. The fundamental purpose of this summary article is this – There is a possibility of you understanding these concepts better once you finish all the course lessons in this section.

Hence, this article will focus on summarizing everything we have learned till now regarding the Market Environment.

The Market States

We have discussed the different ways in which the market moves. Essentially, the price action of a particular asset class moves in three different ways.

Trend | Range | Channel

With clear examples, we have discussed how this movement happens and what we should understand when the price moves in a particular direction. More info related to this can be found here.

Trading the Forex market when it is trending!

In this chapter, we have taken you through the concept of trending market. Uptrend and downtrend concepts have been clearly explained. We also have used Indicators like ADX and Moving Averages to trade the trending market accurately. Please go through this to recall those strategies.

What should we do when the market is ranging? 

We have comprehended the various ways of identifying the ranging market. We also used the Support/Resistance strategy & ADX indicator to trade ranges effectively. Once you try trading a ranging market by yourself, the way you read this article will change, and it will all start making sense. Hence, going through it once again now is important.

Retracements & Reversals

In the next couple of articles, we have drawn down clear differences between Retracements and Reversals. Here, we understood what we must do in the situation of a reversal or a retracement. Then, we have moved on to learn how to trade a reversal in the most effective way possible. In this lesson, we have taken the help of Fibonacci Levels to identify potential market reversals and trade them accordingly.

Finally, we ended this course by understanding how most of the professional Forex traders read and trade different market states. We consider this one of the most useful and valuable articles in this course as we have shared some of the most simple yet effective trading techniques. We also used accurate risk management techniques to protect your capital while trading the market using these techniques. You can go through them again here.

We hope these techniques helped you in becoming a better trader. In our upcoming course lessons, we will be understanding Breakouts, Fakeouts, and everything related to these topics. Cheers!

Categories
Forex Course

89. Identifying Trading Signals Using The ‘ADX’ Indicator

Introduction

The ADX indicator is created by a technical analysis legend, ‘J Welles Wilder.’ ADX (Average Directional Index) shows how strong the market is trending in any direction. This indicator doesn’t have a negative value, so it is not like the oscillators that may fluctuate above and below the price action. The indicator gives a reading that ranges between 0 and 50 levels. Higher the reading goes, stronger the trend is, and lower the reading goes, weaker the trend is.

The ADX Indicator Consists of Three Lines.

  1. The ADX Line.
  2. The DI+ Line. (Plus Directional Movement Index)
  3. The DI – Line. (Minus Directional Movement Index)

The chart above is the visualization of the ADX indicator. We can see the green line (DM+), the Red Line (DM-), and the Yellow Line. (ADX)

Trend Direction and Crossovers

Buy Example

To take a buy trade using this indicator, the first requirement is that the ADX line should be above the 20 level. This indicates that the market is in an uptrend. We go long when the DI+ crosses the DI- from above as it indicates a buy signal.

The chart below is the EUR/AUD Forex pair, where we have identified a buy trade using the ADX indicator. As we can see, the market was in an uptrend, and it is confirmed by the ADX line going above the 20 level. At the same time, we can also see the crossover happening between the DI+ and DI- lines of this indicator. This clearly indicates a buying trade in this pair.

The stop-loss placed below the close of the recent candle is good enough, and we must exit our position when the ADX line (yellow line) goes below the 25 level.

Sell Example

The first requirement to take a seeling position using the ADX indicator is that the ADX line must be below the 20 level. This indicates that the market is in a downtrend. We go short when the DI+ line crosses the DI- line from below as it indicates a sell signal.

The below chart of the GBP/USD Forex pair indicates a sell signal. In a downtrend, when the ADX line (yellow line) goes below the 20 level, it confirms the strength of the downtrend. At the same time, when the DI+ crosses the DI-  from below, it shows that the sellers are ready to resume the downtrend.

Breakout Trading Using The ADX Indicator

This strategy is similar to the crossover strategy that is discussed above. However, we are adding the price action breakout part to it. The idea is to go long when the ADX line is above the 20 level and when the DI+ crosses the DI- line from above. Also, the price action must break above the major resistance level to confirm the buying signal.

As we can see, in the below USD/CAD Forex chart, when the ADX line goes above the 20 level, it indicates that the uptrend is gaining strength. It also means that we can expect a break above the resistance line soon. When the price action broke above the resistance line, we can see the crossover on the ADX indicator. This clearly indicates a buy trade in this currency pair.

We can exit the trades when the opposite signal is triggered. Most of the time, breakout trades travel quite far. So if your goal is to ride longer moves, exit your position when the momentum of the uptrend starts to die or when the price action approaches the major resistance area.

That’s about the ADX indicator and related trading strategies using this indicator. If you have any questions, please let us know in the comments below. Cheers!

[wp_quiz id=”68035″]
Categories
Forex Basic Strategies

Understanding The Volatility Breakout Strategy

Introduction

Breakout trading is one of the most common and popular strategies among traders across the world. In this article, we have added a powerful concept to this strategy, which is volatility. In a volatility breakout, we determine the movement of prices just before the breakout and also their reaction at important support and resistance levels. After analyzing the market, we will decide which breakout is safe to trade and which is not.

Volatility cycles

We have built the volatility breakout strategy in a very simple way. The principle of this strategy is that, when the market moves from one level to another (support to resistance or resistance to support) with strong momentum, the momentum is said to continue further. The other characteristic of the price is that it moves from periods of sideways movement (consolidation) and vertical movement (trend).

Price breaking out of a consolidation prompts us to believe that price will continue in that direction, which might last for one day, one week, or one month. The market after trending downwards gets choppy and reduces directional movement. Traders can use technical indicators like Bollinger Bands, which helps them to determine the strength of the breakout. Breakouts that happen with low volatility are ‘real’ breakouts; on the contrary, breakouts with high volatility can result in a false breakout. We shall look at each case in detail in the next sections of the article.


High volatility breakout

When we are talking about volatility, we mean the choppiness of the price, i.e., the back and forth movement of price. There are traders who like this kind of volatility, as they feel price moves very fast from one point to another. But this isn’t necessarily true in case of a breakout. If you don’t have the required strength in a breakout, you could be trouble.

In the above chart, we see that the price has been in a range for a long time. This means a breakout could happen anytime. Much later, the price tried to break above resistance and stayed there for quite a long time. The price is just chopping around without moving in any particular direction eminently. All these are indications that the breakout, if it happens, will not sustain. Hence, one needs to be extra cautious before going ‘long’ after the breakout.

There are many traders who are willing to take the risk and want to try their luck in such conditions. In that case, after you buy the forex pair, always keep a tight stop loss. The reason why we are suggesting a tight stop loss is that there are high chances for the trade will not work in your favor, and you should avoid making a big loss in that trade. The setup would look like something below.

If the trade works, it can give a decent profit with risk to reward of more than 1.5, which is really good. Again this strategy is only for aggressive traders.

Low volatility breakout    

When a breakout happens with a lot more strength, it is said to be a low volatility breakout. The price here does not face much of hurdle and crosses the barrier with ease.

As you can see in the above chart, the price does not halt at resistance, and the breaks out smoothly, which is exactly how a breakout should be. After that, you can see that the breakout happens successfully, and the price continues to move higher. When such type of volatility comes into notice, we will see a higher number of traders being a part of this rally because they are relatively risk-free trades. This strategy is recommended by us to all types of traders, irrespective of their risk appetite. The next question is where to take profit and put a protective stop.

Stop-loss can be placed below the higher low, which will be formed near the resistance, and profit should be booked at a price which will result in a risk to reward ratio of 1:2. Some money management rules should also be applied while booking profits. The setup would look something like this.

Measuring volatility

Since this strategy is mostly based on volatility, it is important to know how to measure volatility.

  • Bollinger bands are excellent volatility and trend indicators, but like all indicators, they are not perfect.
  • Average true range (ATR) measures the true range of the specified number of price bars, typically 14. ATR is a volatility measuring indicator and does not necessarily indicate a trend. We see a rise in ATR as the price moves from consolidation to a strong trend and a fall in ATR as market transitions from strong trend to choppiness.
  • ADX is also a prominent indicator that measures the strength of a trend based on highs and lows of the trend over a specified number of candles, again typically 14. When ADX rises, it indicates that the volatility has returned to the market, and you might want to use a strategy that fits that market condition.

Bottom line

The market does not always be in trending and consolidation phases, and we also have to learn to deal with different types of volatility. This is where most of the strategies can be used at their best, and using volatility indicators can help you trade more effectively. A breakout, when accompanied by the right amount of volatility, can be highly rewarding. Hence this is an important factor in any breakout trading system. Cheers!

Categories
Forex Educational Library

Profitable Trading – Computerised Studies I: DMI and ADX

Introduction

The spread of personal computers gave investors and traders the opportunity to perform sophisticated computations in an attempt to extract information out of the naked price series. Many traders believe there’s a hidden structure in the markets, and the harder and computationally difficult the indicator is (such as ARIMA, MESA or Fourier analysis) the better. Unfortunately, until now, no computational formula reveals the secret turns of the markets, and if there is one, I don’t think the person or organisation that owns it will show it to the rest of us. But I honestly believe there’s no such formula. The era of deterministic theories of reality is gone. That is clear to me since I’ve been introduced to the quantum theory of physics. More on this: http://www.hawking.org.uk/godel-and-the-end-of-physics.html

But that doesn’t mean technical studies are worthless. There are well known and relatively simple indicators designed to give us information difficult to see or detect by just looking at the price movement, or at least to help us confirm the pattern that price is shaping.

In this article, we’ll study Welles Wilder’s DMI/ADX study

Directional Movement Index (DMI) and Average Directional Movement Index (ADX):

This study came to answer two questions by trend followers: Is there a trend or not? And how strong is it? And these issues aren’t trivial. Trend following traders looks to enter as soon as possible on a trend, usually on breakouts. But, if the market isn’t trending, they enter on a breakout and watch their initial profit become a loss as the breakout fails.

The proper interpretation of ADX help traders to avoid potential losses due to false breakouts, helping them focus on trendy markets, and apply other trading tactics when the signal shows the market isn’t trending.

DMI concept

Directional Movement was developed by J. Welles Wilder Jr, and described in his book New Concepts in Technical Trading System (1968). The DMI indicator is a very useful technical study that shows the market direction. One DMI derivation, the ADX, allows us to quantify the strength of a trend.

The directional movement DI is based on the idea that if the trend is up, the current bar’s high should be above the previous bar high. Conversely, if the trend is down then the current bar’s low should be lower than on the former bar. The difference between the current high and the previous one yields +DI, while, the difference between the current low and the previous one results in –DI. Inside bars are ignored.

  1. If the current bar’s range moves above the previous bar’s range, there’s a new +DM value; while –DI = 0
  2. If the current bar’s range goes below the previous bar range, there’s a new –DM value, while +DI = 0
  3. Outside bars (whose low and high are beyond yesterday’s range) will have both, positive and negative DM. The larger will be used and the shorter equated to zero.
  4. On an outside bar, if both values are equal, then both DM =0
  5. On Inside bars, both DM = 0

Computation of the DMI

DI, the directional indicator, is computed by dividing DM by the True Range (TR).

DI = DM / TR

TR, the true range is the biggest of these three quantities:

High – low

High – close

Close-low

The resulting DI calculation may be positive or negative. If positive (+DI), it’s the percentage of the current bar’s true range that’s up. If negative (-DI), it’s the percentage that’s down for that bar.

The DI’s are averaged over a period. Mr. Wilder suggests 14 bars.

The calculation for 14 bars is:

+DI14 = DM14 / TR14

Where DM14 and TR14 are the averages of those quantities over a 14 bar period.

ADX is derived from +DI and +DI, using the following steps:

  1. The absolute difference is computed:

DIdiff = | [(+DI) – (-DI)] |

  1. The sum is, also, computed:

DIsum = [(+DI) + (-DI)]

  1. Compute DX:

DX = 100 x DIdiff / DIsum

The 100 scales the DX values between 0 and 100.

DX is too wild to be used directly, so we compute a moving average of DX and call it Average Directional Indicator, ADX. Usually, the smoothing average has the same period as the one used to obtain the DI.

Another indicator may be created using a momentum-like derivation of ADX called Average Directional Movement Index Rating (ADXR)

ADXR = (ADX – ADXn) / 2

Where ADX is the value for the current bar and ADXn is the ADX for the nth bar ago.

When drawn on a chart, if +DI is above –DI, then the trend is up. The opposite situation means a downward move.

If the two lines diverge, the directional movement increases. The greater the difference, the stronger the trend.

According to Wilder, the 14-period averaging was chosen because of his idea of a half cycle. Day or swing traders may choose to modify it based on the half cycle of the time frame he is trading. For instance, LeBeau and Lucas in their book recommend 12 bar averaging on a 5-min chart.

Fig 2 shows the hourly EUR/USD and the DMI & ADX study. We observe that on the left quarter, when there’s no trend, the ADX is below 25, touching the +DI and -DI lines; and these lines themselves are crossing over each other every few bars. Then a breakout in price matches the growth of the ADX line, while +DI crosses over –DI. The ADX signal grows while the trend keeps moving up with increasing strength.

The top formation changes its character and goes down following the price until –DI crosses over +DI and, then, ADX starts growing again, while price keeps falling: A downtrend is confirmed.

The sideways channel forming a local bottom hurts the ADX again, and then the small reaction up (+DI crosses over -DI) moves it up. Then the sudden drop in 5 bars makes a slight dip but ADX is up again.  Then, on a new price floor (support), ADX drops again, and so on.

It seems sluggish and untimely. Many people discard it because of that. But we must remember the ADX indicator shows only trend strength.

The DI system tracks the fight between bulls and bears. It measures the power of bulls and bears to move prices beyond the previous bar range. When +DI is above -DI it shows that bullish sentiment has dominated the market so far. -DI above +DI shows the bears are in control. Thus, following the direction of the upper line is an edge.

ADX rises when the spread between +DI and –DI grows. It shows that the market sentiment (bull or bear) of the dominant market group gains strength, so the trend is probably continuing.

ADX drops when +DI and –DI are approaching each other. This shows that the dominant group is losing strength and the health of the trend is in question.

Rules for trading with ADX and ± DI:

The real value is as a filter for entries.  It’s important to understand that the ADX alone doesn’t show market direction, but the strength of a trend. We should use the +DI and -DI crossovers to determine direction.

  • If +DI is above –DI then the trend is up. If the opposite is true, there’s a downtrend. Consequently, we filter trades opposite to the current trend direction.
  • When the ADX declines, it’s an indication of a market top, and we should exit the trade or tighten stops. While ADX is pointing down, it’s better not to use any entry methods designed for trend following.
  • When the ADX is below or touching the DI lines, it signals a sideways channel or flat market. Under these conditions, breakouts have higher probabilities to fail. We should wait for ADX to go up again.
  • The ADX line below both lines is a sign of very low volatility, and, for sure, we are in a very quiet sideways channel. Therefore, it’s an excellent opportunity to take the breakout of the channel, since the reward to risk should be attractive.
  • When the ADX is well above the two lines, it may signal an overbought or oversold market condition. When the ADX stalls it may be time to take profits, reducing positions or tightening stops.

References:

Computer Analysis of the Futures Markets, Charles LeBeau and David W. Lucas.

The New Trading for a Living, Alexander Elder.