Introduction
We have talked a lot about trading strategies involving MACD, RSI, Volume and Stochastic. However, we haven’t covered much about the ADX indicator and its application. Today’s strategy is based on the ADX, which will help us in measuring the strength of a trend on any given time frame. The Average Directional Index (ADX) is a tool that is designed to measure the strength of a trend. When ADX is used in combination with other trading strategies, we get a complete understanding of the market trend and its efficacy.
Learning how to use the ADX is very easy. It ranges from a scale 0-100, 100 indicating a strong trend and 0 indicating a non-existent trend. If the ADX is close to 0, we can expect a sideways action in the market, meaning the market will neither go up or down but stay around the same value for some time. Remember, ADX will tell us about the strength of the trend. It does not guide us in the future direction of the market. For that reason, it is necessary to use concepts of market trend, retracement, and other technical indicators. ADX values of 50 and above are considered high, while ADX values of 20 and below are considered low. Weak trends are indicated by values of 20 and below.
Time Frame
The strategy works well on most time frames, including 15 minutes, 1 hour, 4 hours and Daily. However, we do not recommend applying the strategy on very low time frames due to market noise and liquidity issues.
Indicators
We use the Average Directional Index (ADX) and Simple Moving Average (SMA) indicators in the strategy.
Currency Pairs
The strategy is applicable on most currency pairs listed on the broker’s platform. However, it is advised to apply the strategy on major currency pairs only.
Strategy Concept
The ADX indicator ensures that we only trade when there is a strong trend in the market, regardless of the time frame. Here, even before looking at the candlesticks, we wait for the ADX indicator to show a reading above 60. A reading above 60 signals a strong trend and the likelihood of a trend continuation. We all know that the trend is our friend, but without gauging the strength of the trend, it can be dangerous to be a part of that trend. This is why we use the ADX indicator for trend trading.
The ADX is only limited to understanding the strength of the trend. However, in order to trade a ‘trend’, we also need to look at price action and trend continuation pattern in the market. Therefore, we use the concept of retracement and moving average to time our ‘entries.’ As this a trend trading strategy, we cannot use the rules for catching a reversal in the market.
We determine the take-profit and stop-loss levels based on ‘highs’ and ‘lows’ of the trend and retracement. Let us, straight dive, into the rules of the strategy.
Trade Setup
In order to explain the strategy, we will be executing a ‘long’ trade in USD/CAD currency pair using the rules of the strategy. Here are the steps to execute the strategy.
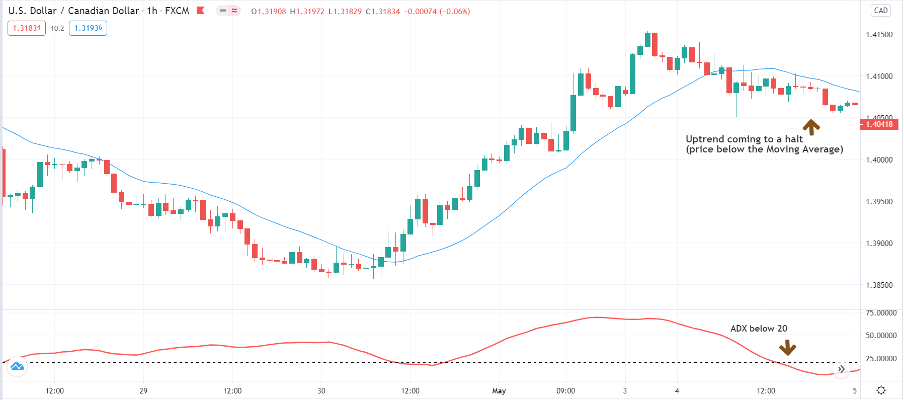
Step 1: Firstly, we have to plot the ADX and moving average indicators on the chart with their default setting. Before we actually look at the price action of the market, we have to watch the ADX indicator and its indication. Once the ADX crosses above 60, we look at the trend market and wait for an appropriate retracement.
Step 2: After gauging the strength of the trend using the ADX indicator, we need to wait for a suitable price retracement. The retracement, in other words, indicates a halt of the major trend of the market. In an uptrend, if price falls below the moving average and stays there, we say that the market has entered into retracement mode.
In a downtrend, if price rises above the moving average and stays there, we say that the market has entered into retracement mode. At this point, we are not sure if this is a retracement of the trend or is a start of the reversal. In order to confirm that it is a retracement, we again use the ADX indicator and check its reading. An ADX reading below 20 indicates that the ‘halt’ is actually a retracement of the major trend and not reversal.
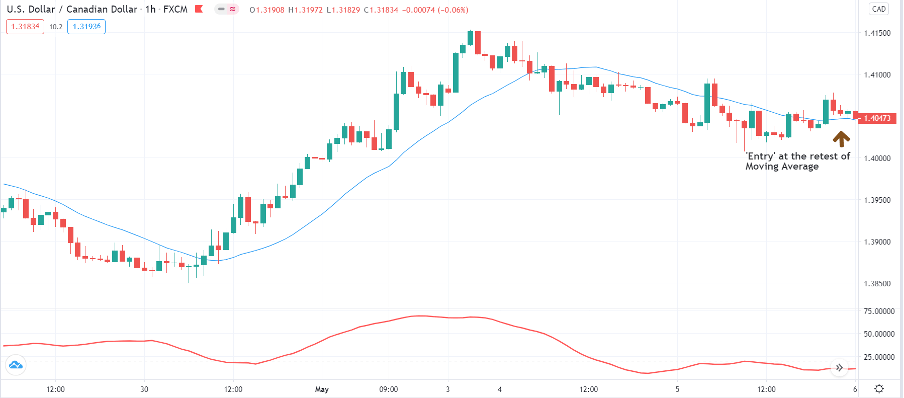
Step 3: Now that we have got a confirmation from the ADX indicator that the market has gone into retracement mode, we should know how to enter the market. We go ‘long’ in the market when price crosses above the moving average and stays there for at least 4 or 5 candles. Similarly, we go ‘short’ in the market when price crosses below the moving average and stays there for at least 4 or 5 candles. As we just saw, the rule for entering a trade in this strategy is pretty simple and not complex at all.
Step 4: The last step of the strategy is to determine stop-loss and take-profit levels for the trade. We set take-profit near the ‘higher high’ of the uptrend while ‘long’ in the market and near the last ‘lower low’ of the downtrend while ‘short’ in the market. Stop-loss is placed below the previous ‘low’ of the retracement in an uptrend and above the ‘high’ of the retracement in a downtrend.
Strategy Roundup
The new ADX strategy gives very useful information which most of the times we never pay attention to. There are not many indicators which truly tell about the strength of the trend. ADX is one such indicator which tells if the trend is moving in strong fashion or not. At the same time, it is important to consider the strength of the pullback using price action and ADX indicator. Best profits come from catching strong trends, and this strategy helps us in accomplishing that.


