Introduction
Breakout trading is one of the most common and popular strategies among traders across the world. In this article, we have added a powerful concept to this strategy, which is volatility. In a volatility breakout, we determine the movement of prices just before the breakout and also their reaction at important support and resistance levels. After analyzing the market, we will decide which breakout is safe to trade and which is not.
Volatility cycles
We have built the volatility breakout strategy in a very simple way. The principle of this strategy is that, when the market moves from one level to another (support to resistance or resistance to support) with strong momentum, the momentum is said to continue further. The other characteristic of the price is that it moves from periods of sideways movement (consolidation) and vertical movement (trend).
Price breaking out of a consolidation prompts us to believe that price will continue in that direction, which might last for one day, one week, or one month. The market after trending downwards gets choppy and reduces directional movement. Traders can use technical indicators like Bollinger Bands, which helps them to determine the strength of the breakout. Breakouts that happen with low volatility are ‘real’ breakouts; on the contrary, breakouts with high volatility can result in a false breakout. We shall look at each case in detail in the next sections of the article.
High volatility breakout
When we are talking about volatility, we mean the choppiness of the price, i.e., the back and forth movement of price. There are traders who like this kind of volatility, as they feel price moves very fast from one point to another. But this isn’t necessarily true in case of a breakout. If you don’t have the required strength in a breakout, you could be trouble.
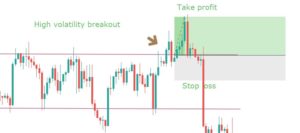
In the above chart, we see that the price has been in a range for a long time. This means a breakout could happen anytime. Much later, the price tried to break above resistance and stayed there for quite a long time. The price is just chopping around without moving in any particular direction eminently. All these are indications that the breakout, if it happens, will not sustain. Hence, one needs to be extra cautious before going ‘long’ after the breakout.
There are many traders who are willing to take the risk and want to try their luck in such conditions. In that case, after you buy the forex pair, always keep a tight stop loss. The reason why we are suggesting a tight stop loss is that there are high chances for the trade will not work in your favor, and you should avoid making a big loss in that trade. The setup would look like something below.

If the trade works, it can give a decent profit with risk to reward of more than 1.5, which is really good. Again this strategy is only for aggressive traders.
Low volatility breakout
When a breakout happens with a lot more strength, it is said to be a low volatility breakout. The price here does not face much of hurdle and crosses the barrier with ease.
As you can see in the above chart, the price does not halt at resistance, and the breaks out smoothly, which is exactly how a breakout should be. After that, you can see that the breakout happens successfully, and the price continues to move higher. When such type of volatility comes into notice, we will see a higher number of traders being a part of this rally because they are relatively risk-free trades. This strategy is recommended by us to all types of traders, irrespective of their risk appetite. The next question is where to take profit and put a protective stop.
Stop-loss can be placed below the higher low, which will be formed near the resistance, and profit should be booked at a price which will result in a risk to reward ratio of 1:2. Some money management rules should also be applied while booking profits. The setup would look something like this.
Measuring volatility
Since this strategy is mostly based on volatility, it is important to know how to measure volatility.
- Bollinger bands are excellent volatility and trend indicators, but like all indicators, they are not perfect.
- Average true range (ATR) measures the true range of the specified number of price bars, typically 14. ATR is a volatility measuring indicator and does not necessarily indicate a trend. We see a rise in ATR as the price moves from consolidation to a strong trend and a fall in ATR as market transitions from strong trend to choppiness.
- ADX is also a prominent indicator that measures the strength of a trend based on highs and lows of the trend over a specified number of candles, again typically 14. When ADX rises, it indicates that the volatility has returned to the market, and you might want to use a strategy that fits that market condition.
Bottom line
The market does not always be in trending and consolidation phases, and we also have to learn to deal with different types of volatility. This is where most of the strategies can be used at their best, and using volatility indicators can help you trade more effectively. A breakout, when accompanied by the right amount of volatility, can be highly rewarding. Hence this is an important factor in any breakout trading system. Cheers!


