Everybody knows Bollinger Bands, that kind of rivery thing surrounding prices. But almost nobody knows what to do with them. Maybe we can help a bit with that.
1 – Bollinger Bands and Trends
Bollinger Bands are based on Moving Averages. Therefore the central line is the 20-period moving average. As a corollary, if the price of an asset is above the mid-BB-Line, it usually is trending UP. Conversely, if it is below the mid-BB-Line, it tends to be trending down.
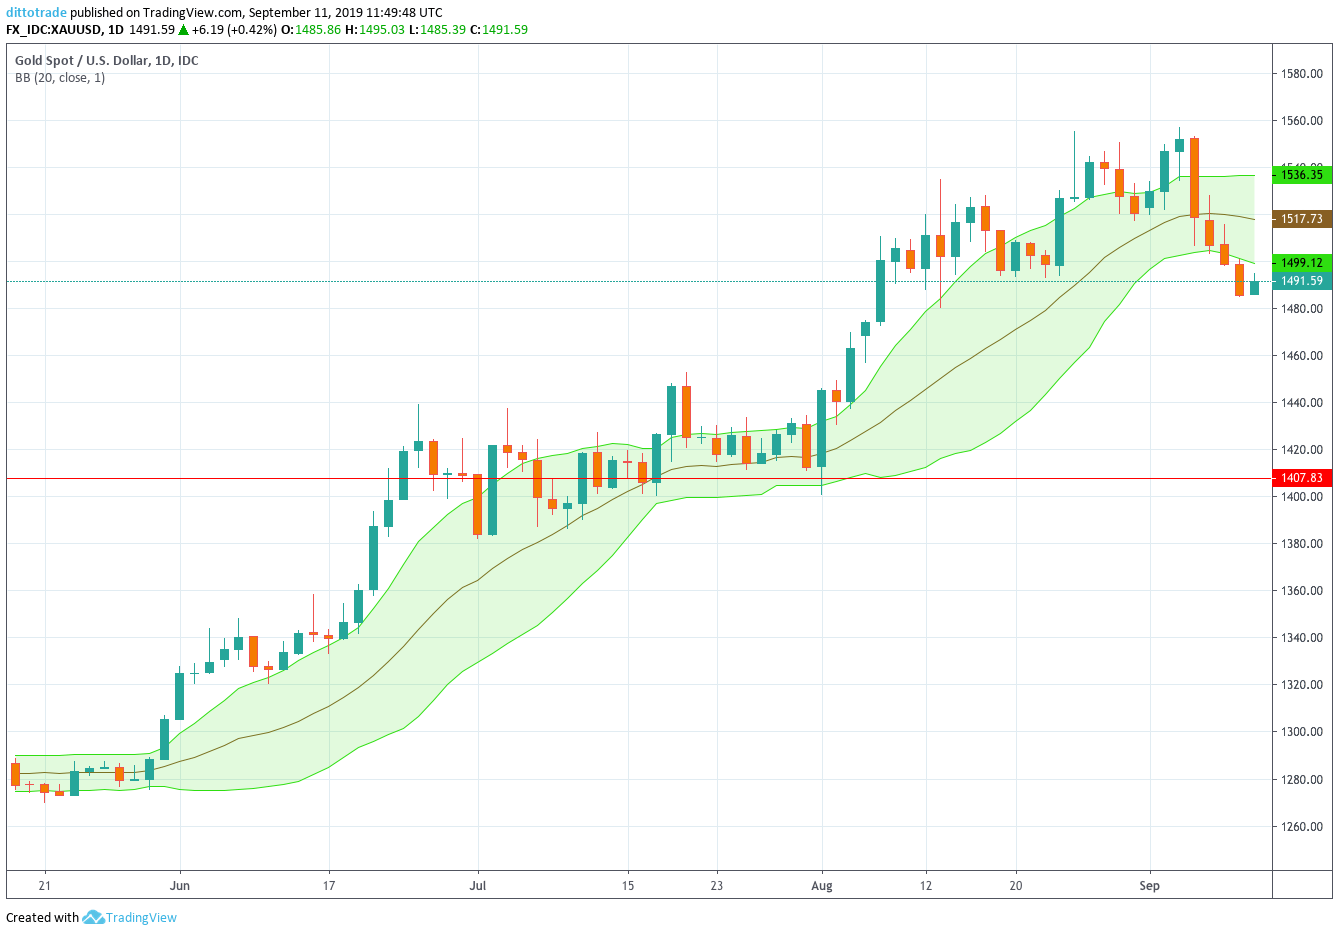
Fig 1 – Uptrends see prices moving near the +1 Bollinger line
2 – Bollinger Bands Are more Useful Customized
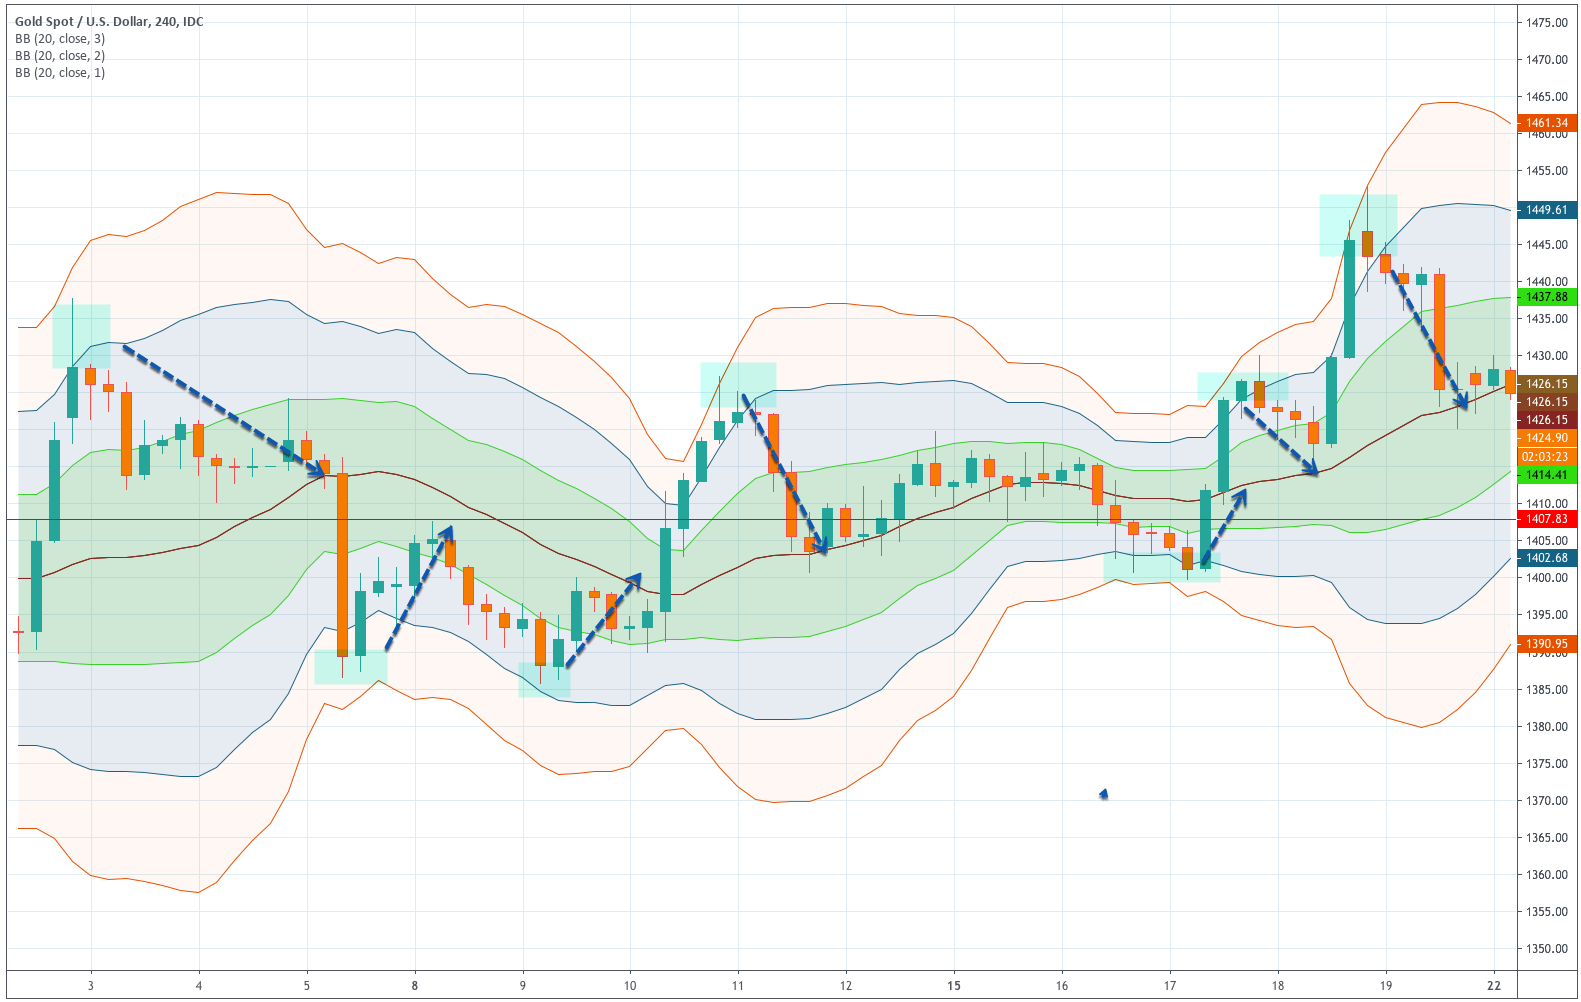
There is no need to use only the standard 2-StDev Bollinger bands. We, as traders, can create different band types. In my case, I use to draw 1-StDev and 3-StDev bands. The reason will come clear in the next bullet point.
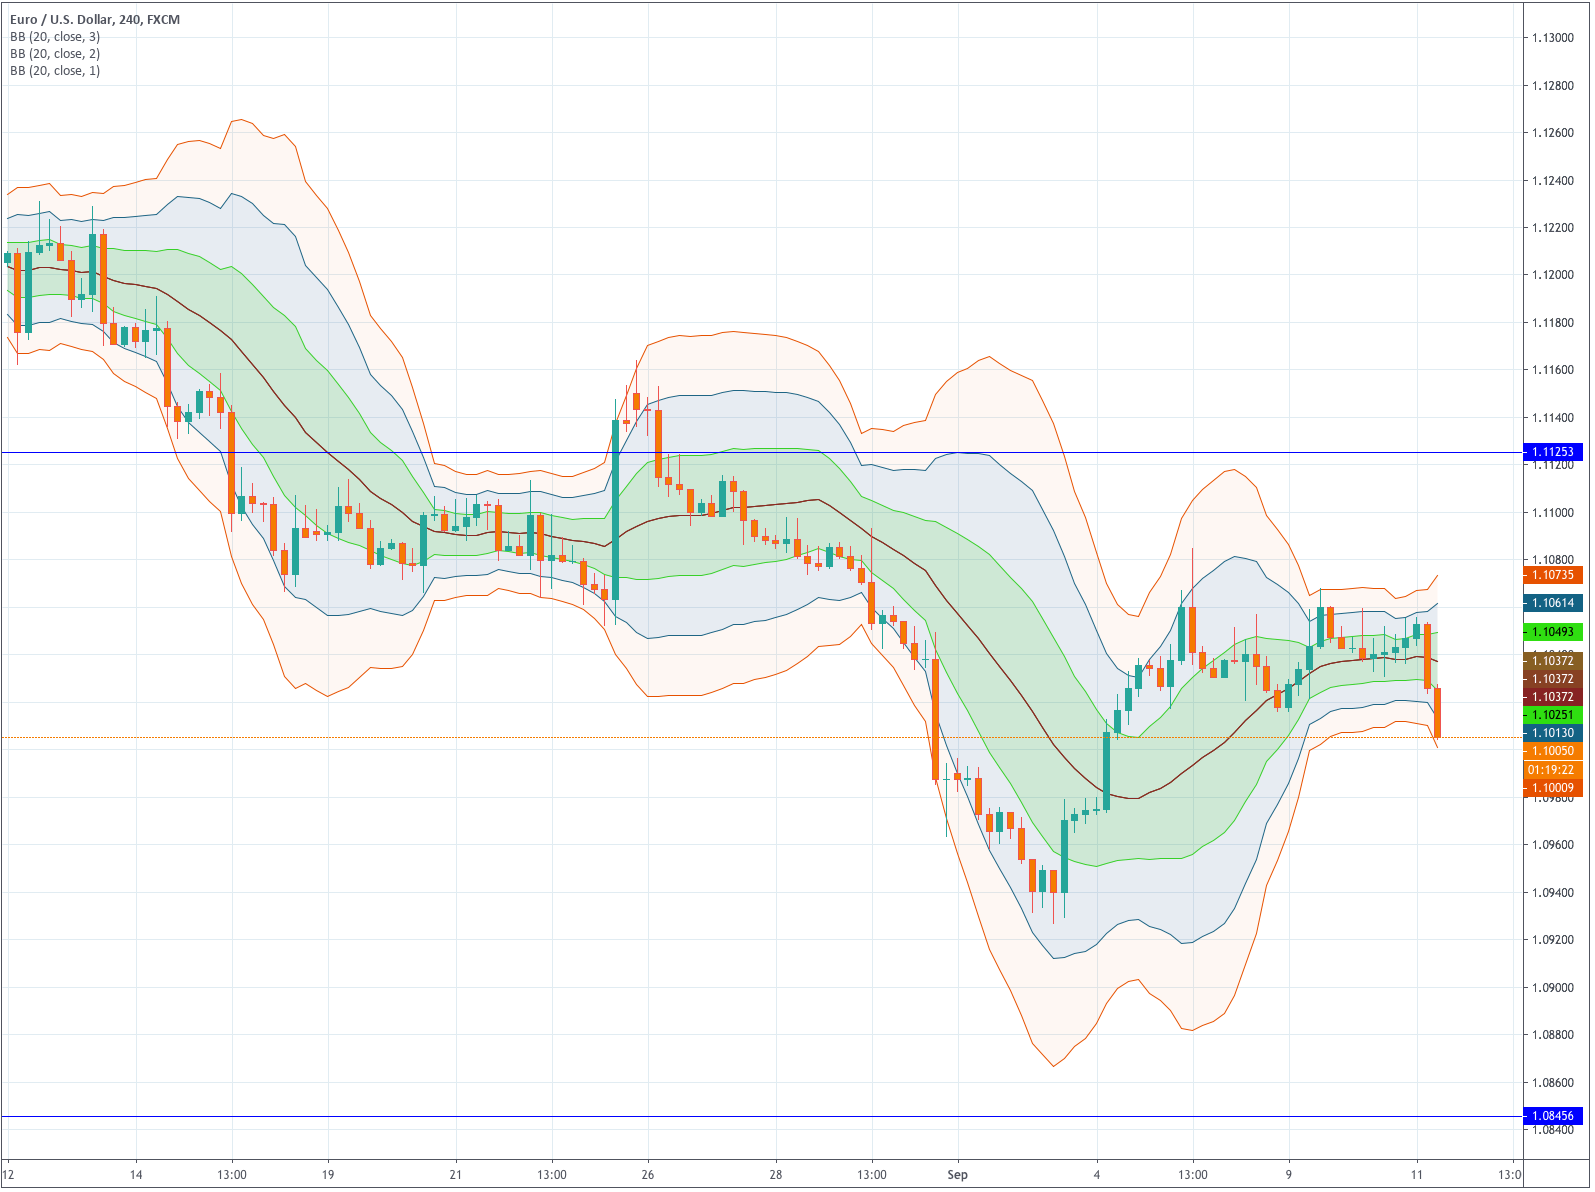
Fig 2 – 1,2 and 3 sigma Bollinger Bands as a Map of the Price Action
3 – Bands and Price Action
Bollinger Bands maps the price action. By that, I mean we can assess how much the price is away from the mean. If we think of the mean price as the consensus of value at a particular moment, Bollinger bands help evaluate if the asset is overpriced or underpriced and profit from that information. That is so because the lines are pictured at a standard distance from the mean.
There is one theorem about a broad class of probability distributions called Chebyshev’s inequality (also called Bienaymé–Chebyshev inequality). The Chevyshev’s inequality guarantees that there is a minimum of data values within a certain distance from the mean value of a distribution. And it does not need to be a normal or bell-shaped distribution for this theorem to hold. It only needs to have a finite average.
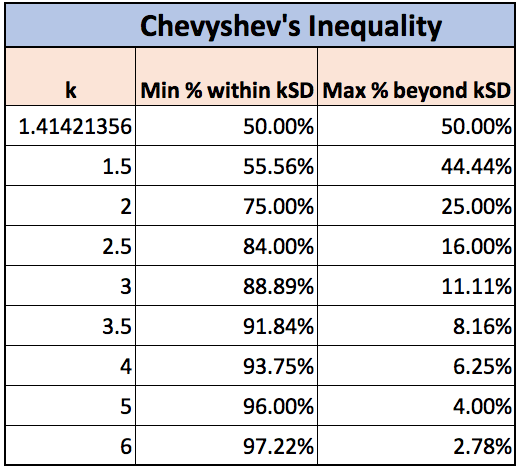
From these figures, we can see that if we spot prices moving beyond the +2 Bollinger line, there is a 75% chance the price moves back. If that price extension goes to the +3 BB-Line the chance of it retracing is 89% and so on. That applies to the negative side as well so, prices below -2BB-line and -3BBline have 75% and 89% chance of reversing.
That means Bollinger bands are terrific overbought and oversold indicators. Consequently, it pays to have visible at least a couple of bands in our charts. There bands: +1, +2 and +3 Sigma bands will map your price action beautifully.
4 – Prices Tends to Visit the Mean
From the extremes, the price tends to find support on its Mean price. That means the price tends to visit the mean Bollinger line before resuming the trend (of course, this also happens when the trend changes). One recurring pattern is for the price to move beyond +2 BB-line, creating one or two candlesticks with a large upper wick and closing lower. Then, the following candles move steadily back (or sideways) to visit the mid-BB line, and then start a new leg up. That also applies to downward trends. The price moves below the -2BB-line and even the -3BBline and then creates a large lower wicked candlestick to, then, move back to the mean.
Since the mean is a moving average, the mean continues moving up or down in the subsequent bars, so, it is not uncommon that the price moves quite horizontally as can be seen on the chart.
5- From Impulses to Corrections
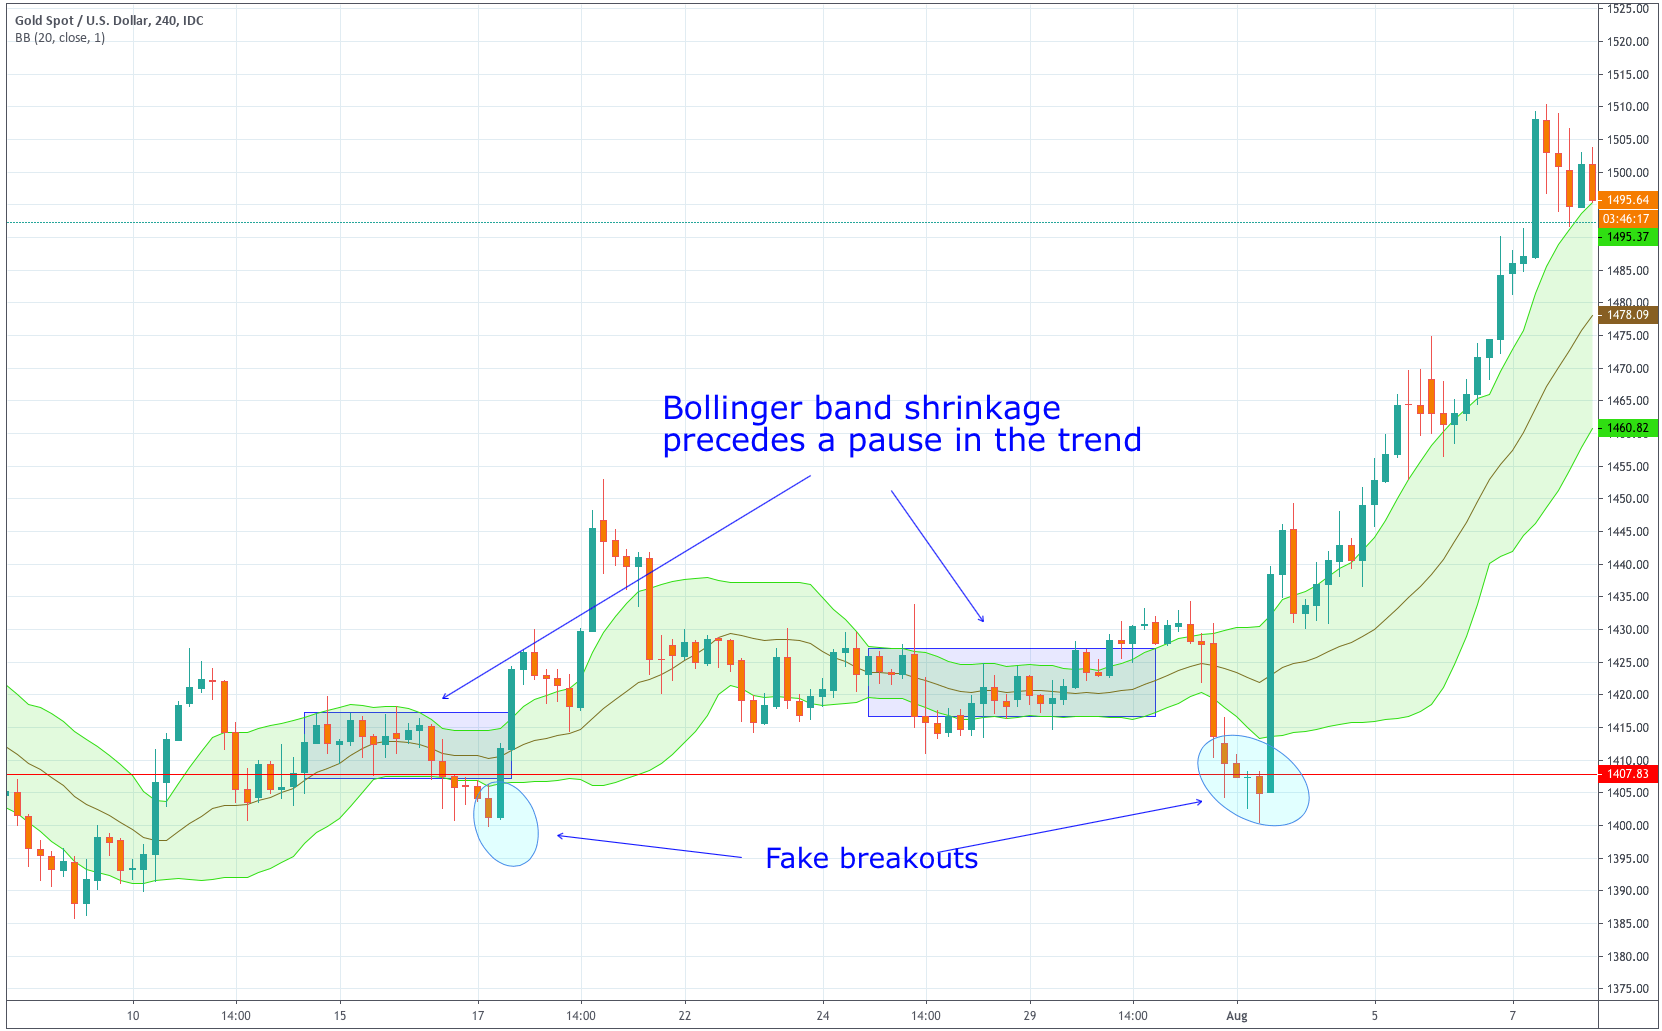
Bollinger Bands warns about pauses and the end of a trend. It also warns about the continuation of the trend.
Bollinger Bands expand with volatility and shrink with le lack of it. When we spot that the Bollinger bands are starting to shrink, it is almost sure the trend has stopped moving. It might be a consolidation period or a reversal. Therefore, band shrinkage is a flag for traders to take some profits out of the table.
Sideways range-bound movements make the bands shrink. When a breakout of the range occurs, the bands expand, signaling a new period of increased volatility and price movements.