Categories
Forex Price-Action Strategies

Breakout by a Single Candle Generate More Impetus

Breakout is one of the most important factors in trading. Attributes of a breakout give clues with what traders can manage their opened position to make more profit. Price action traders, in particular, love to compute the attributes of a breakout to determine their take profit level.

In this section, we are going to demonstrate an example of a single candle breakout and its impact afterwards. Have a look at the chart below.

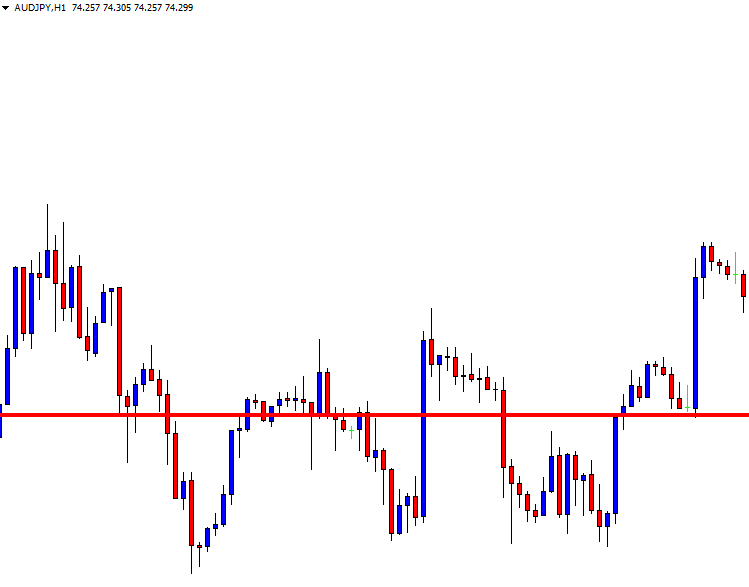
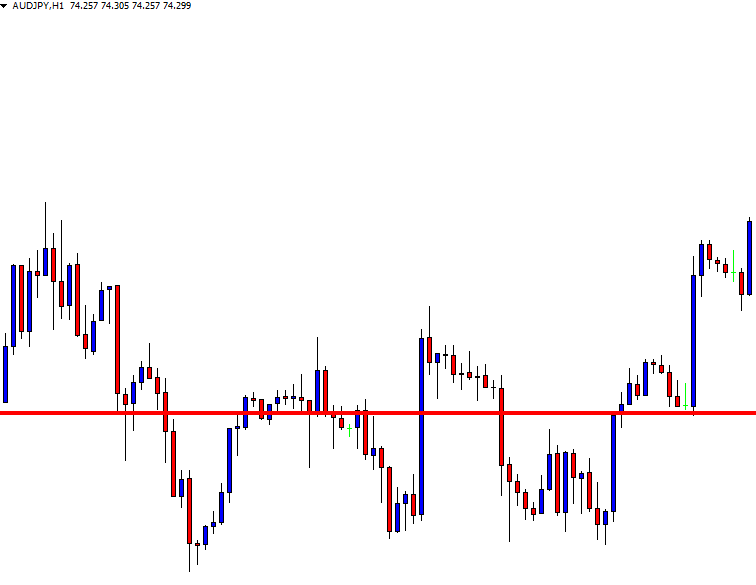
The price finds support at the red market level and heads towards the North. The price action suggests that the buyers are going to control the pair. A downward correction/consolidation followed by a bullish reversal candle at a value zone is what they need to wait for. Let us find out what happens next.

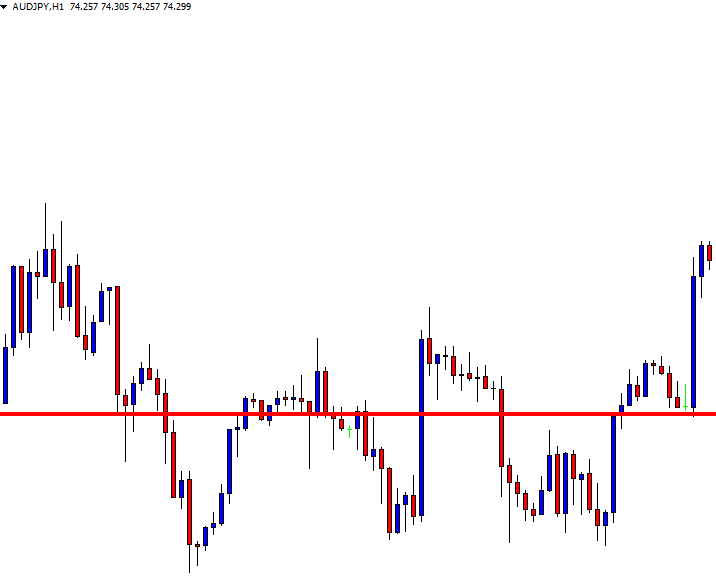
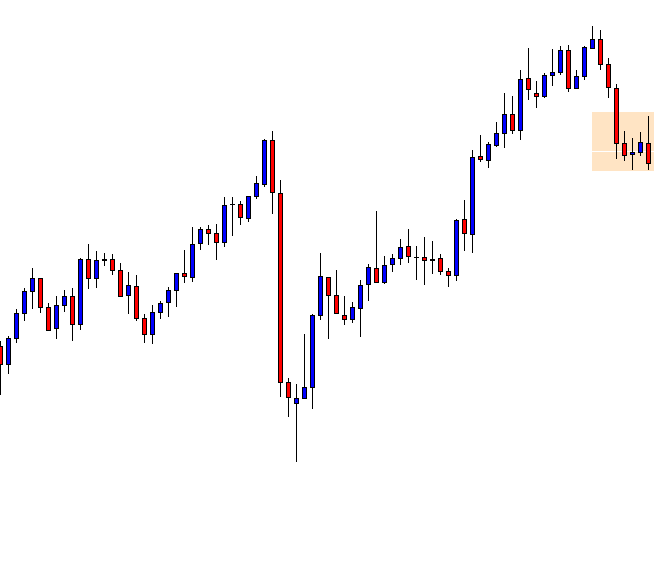
The price seems to have started having a pullback. The first corrective candle comes out as an Inside Bar, which is a good sign for the buyers. The buyers wait for the price to come back at a level of support with a reasonable distance from the resistance. Let us see how far it comes up to.

The price has crossed a good distance from resistance. The buyers are to wait for a bullish reversal candle. Ideally, a bullish engulfing candle is the first choice for the buyers. Other candles such as Inside bar, Spinning Top do the job as well, but an engulfing candle’s signal attracts more traders, and it brings more liquidity. Let us see what happens next.

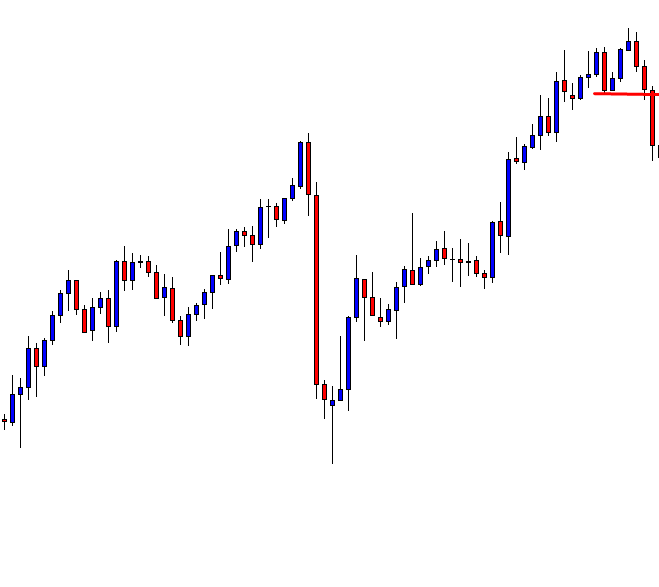
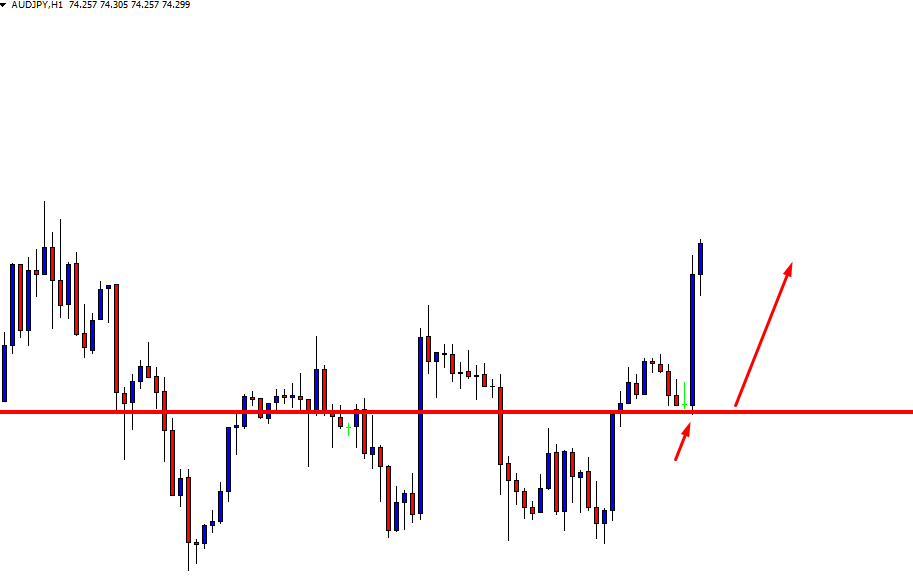
Price action traders dream of such a reversal candle. This is not only a bullish engulfing candle but also an engulfing candle, which breaches the highest high of the last wave. Let us draw the consolidation zone on the chart.

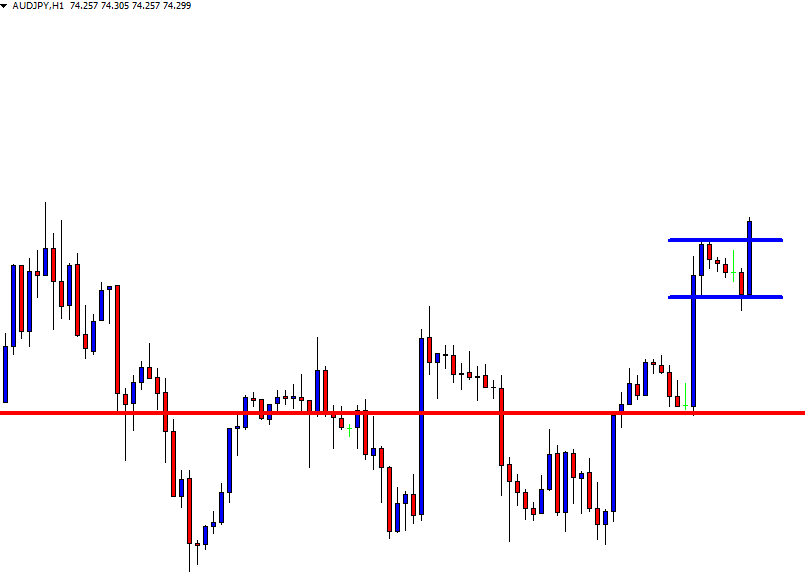
The reversal candle makes the breakout with good momentum. A trader shall trigger a buy entry shall right after the candle closes. When a reversal candle itself makes a breakout, it makes the fore coming move go towards the trend’s direction with good momentum. Look at the chart below.

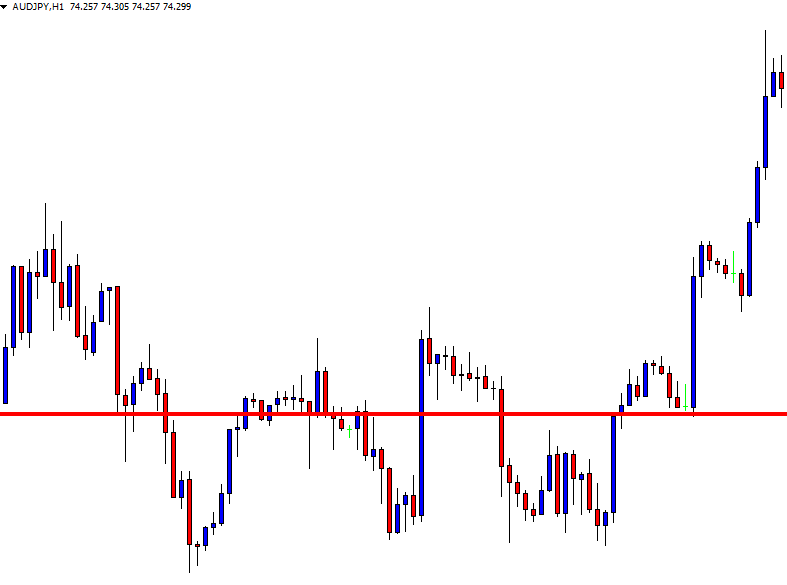
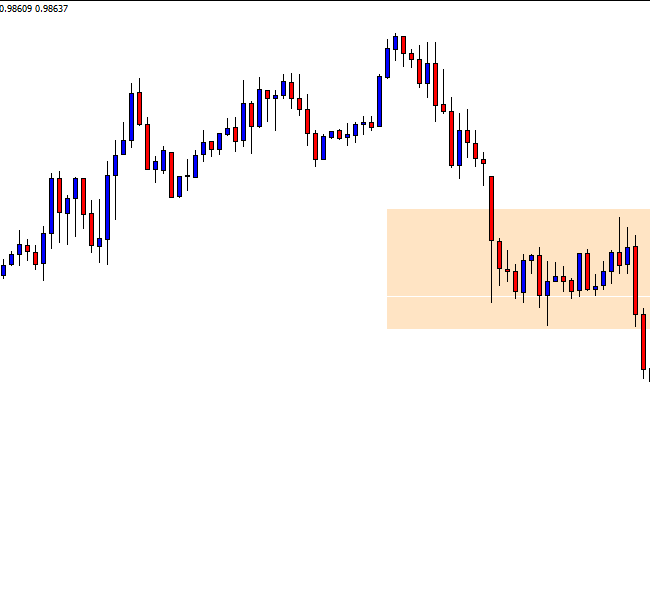
Look at the pace of the bullish move after the breakout. Here is another very important factor that traders must remember. A single candle breakout usually offers a 1:2 risk-reward ratio. This means traders shall add some extra pips with their profit target when they get such price action. The drama remains. Have a look at the chart below.

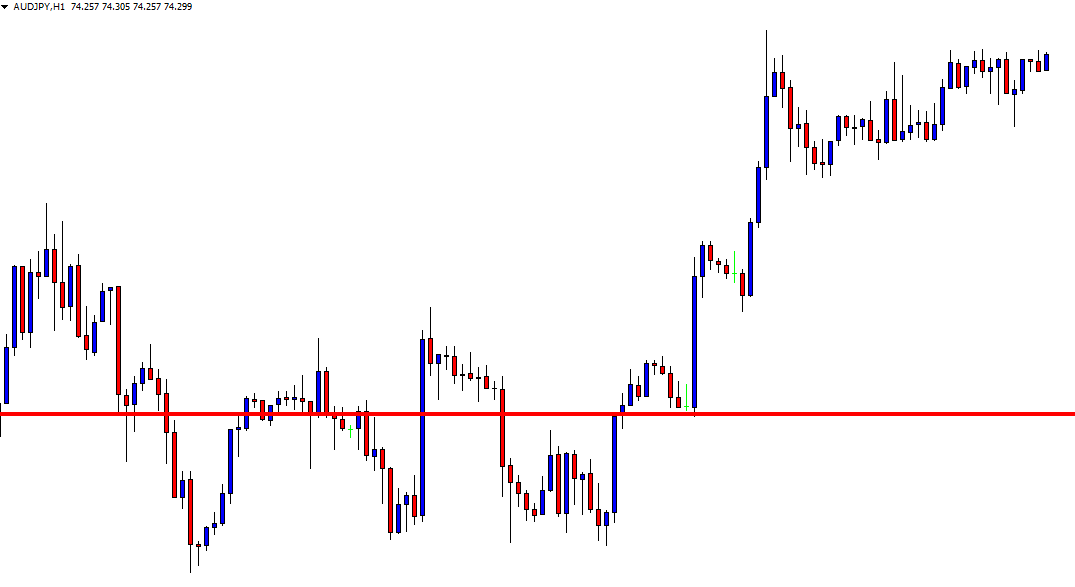
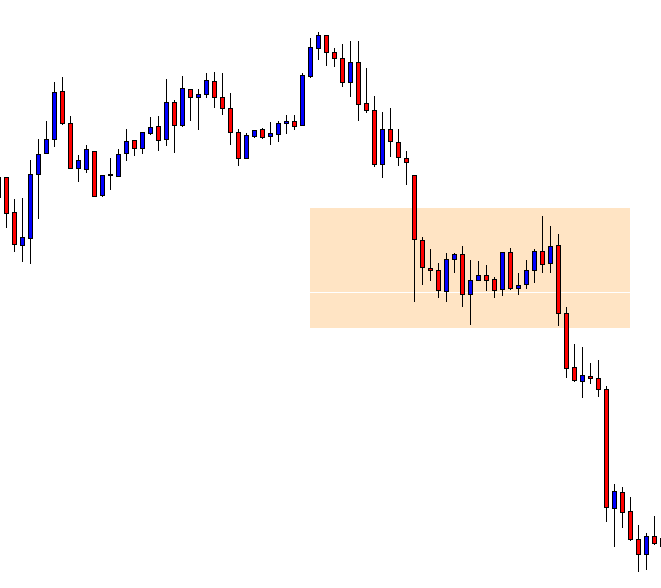
The price makes a correction and seems to have found support again. It suggests that the buyers are still in control. Smart buyers take their Partial profit and let the rest of the trade run to earn more pips.

As mentioned, breakout attributes give clues about the trend’s strength. Eventually, this helps traders manage their trade nicely and make more money out of trading.

Categories
Forex Chart Basics

Ideas that can be Blended with Candlestick to Trigger Entries-Part 3

In Part 2, we learned how important a breakout is for taking an entry. Even the strongest reversal candle itself is not enough to create a new trend. In this article, we are going to learn other steps that we need to maintain for taking an entry in case of engulfing candlestick.

Let us have a look at the chart below.

After producing the engulfing candle,

  1. The price breached through a support level.
  2. The breakout candle looks very strong.

First two equations have been met. Shall we take the entry right now? The answer is “NO”. We must wait for an upward correction/consolidation. A correction/consolidation gives us another level of support/resistance (in this case resistance). It offers a better risk and reward ratio as well as a better winning percentage. Thus, correction/consolidation is considered one of the most vital components of trading.

Let us have a look at how consolidation took place here.

Pay attention to those candles after the breakout. The pair produced one more bearish candle. Many traders may think an opportunity missed here. Look at the very next candle. That came as a Doji Candle followed by a bullish one. Be very careful. The market often keeps having a correction and changes the trend even by making new higher highs. Thus, a bearish reversal candle we must wait for.

We got one and luckily, it was a bearish engulfing candle. Candle Stick Pattern is being used here again to show us selling sign. What do we have to do now?

We have to wait for another breakout. This time we have to flip over to our Trigger Chart. This is an H4 chart. Thus, our trigger chart is H1 Chart. Let us flip over to the H1 Chart.

The price came out with the last candle from the consolidation zone. A Marubozu Bearish Candle made the breakout. A less low spike indicates that the sellers are very confident. Look, Candle Stick Pattern is being used here again. Here we go. This is the point where we trigger out short (sell) entry.

Let us have a look at the chart below how our trade would play.

Wow, it played well. Though it had consolidation on the minor time frames later, however, this should not be our concern. We followed our trading chart’s trend, breakout, consolidation (H4) and the H1 breakout. By setting our Stop Loss and Take Profit, we shall forget the entry. This is another thing of trading called “Set and Forget” that need to be integrated.

In this article, we learned these are the things to be integrated as well.

  1. Consolidation/ Correction on the trading chart.
  2. Reversal candle to be formed on the trading chart.
  3. Flipping over to the trigger chart and waiting for a breakout.

In the next article, we are going to demonstrate an example of how a Morning Star offered us entry with the integration of consolidation, breakout, and breakout candle with a Morning Star. Stay tuned.

Categories
Forex Indicators

Five Great Things you’ve Never Heard about Bollinger Bands


Everybody knows Bollinger Bands, that kind of rivery thing surrounding prices. But almost nobody knows what to do with them. Maybe we can help a bit with that.

1 – Bollinger Bands and Trends

Bollinger Bands are based on Moving Averages. Therefore the central line is the 20-period moving average. As a corollary, if the price of an asset is above the mid-BB-Line, it usually is trending UP. Conversely, if it is below the mid-BB-Line, it tends to be trending down.

Fig 1 – Uptrends see prices moving near the +1 Bollinger line

2 – Bollinger Bands Are more Useful Customized

There is no need to use only the standard 2-StDev Bollinger bands. We, as traders, can create different band types. In my case, I use to draw 1-StDev and 3-StDev bands. The reason will come clear in the next bullet point.

Fig 2 – 1,2 and 3 sigma Bollinger Bands as a Map of the Price Action

3 – Bands and Price Action

Bollinger Bands maps the price action. By that, I mean we can assess how much the price is away from the mean. If we think of the mean price as the consensus of value at a particular moment, Bollinger bands help evaluate if the asset is overpriced or underpriced and profit from that information. That is so because the lines are pictured at a standard distance from the mean.

There is one theorem about a broad class of probability distributions called Chebyshev’s inequality (also called Bienaymé–Chebyshev inequality). The Chevyshev’s inequality guarantees that there is a minimum of data values within a certain distance from the mean value of a distribution. And it does not need to be a normal or bell-shaped distribution for this theorem to hold. It only needs to have a finite average.

From these figures, we can see that if we spot prices moving beyond the +2 Bollinger line, there is a 75% chance the price moves back. If that price extension goes to the +3 BB-Line the chance of it retracing is 89% and so on. That applies to the negative side as well so, prices below -2BB-line and -3BBline have 75% and 89% chance of reversing.

That means Bollinger bands are terrific overbought and oversold indicators. Consequently, it pays to have visible at least a couple of bands in our charts. There bands: +1, +2 and +3 Sigma bands will map your price action beautifully.


4 – Prices Tends to Visit the Mean

From the extremes, the price tends to find support on its Mean price. That means the price tends to visit the mean Bollinger line before resuming the trend (of course, this also happens when the trend changes). One recurring pattern is for the price to move beyond +2 BB-line, creating one or two candlesticks with a large upper wick and closing lower. Then, the following candles move steadily back (or sideways) to visit the mid-BB line, and then start a new leg up. That also applies to downward trends. The price moves below the -2BB-line and even the -3BBline and then creates a large lower wicked candlestick to, then, move back to the mean.

Since the mean is a moving average, the mean continues moving up or down in the subsequent bars, so, it is not uncommon that the price moves quite horizontally as can be seen on the chart.


5- From Impulses to Corrections

Bollinger Bands warns about pauses and the end of a trend. It also warns about the continuation of the trend.

Bollinger Bands expand with volatility and shrink with le lack of it. When we spot that the Bollinger bands are starting to shrink, it is almost sure the trend has stopped moving. It might be a consolidation period or a reversal. Therefore, band shrinkage is a flag for traders to take some profits out of the table.

Sideways range-bound movements make the bands shrink. When a breakout of the range occurs, the bands expand, signaling a new period of increased volatility and price movements.