Categories
Forex Elliott Wave Forex Market Analysis

EURJPY Advances Toward Key Supply Zone

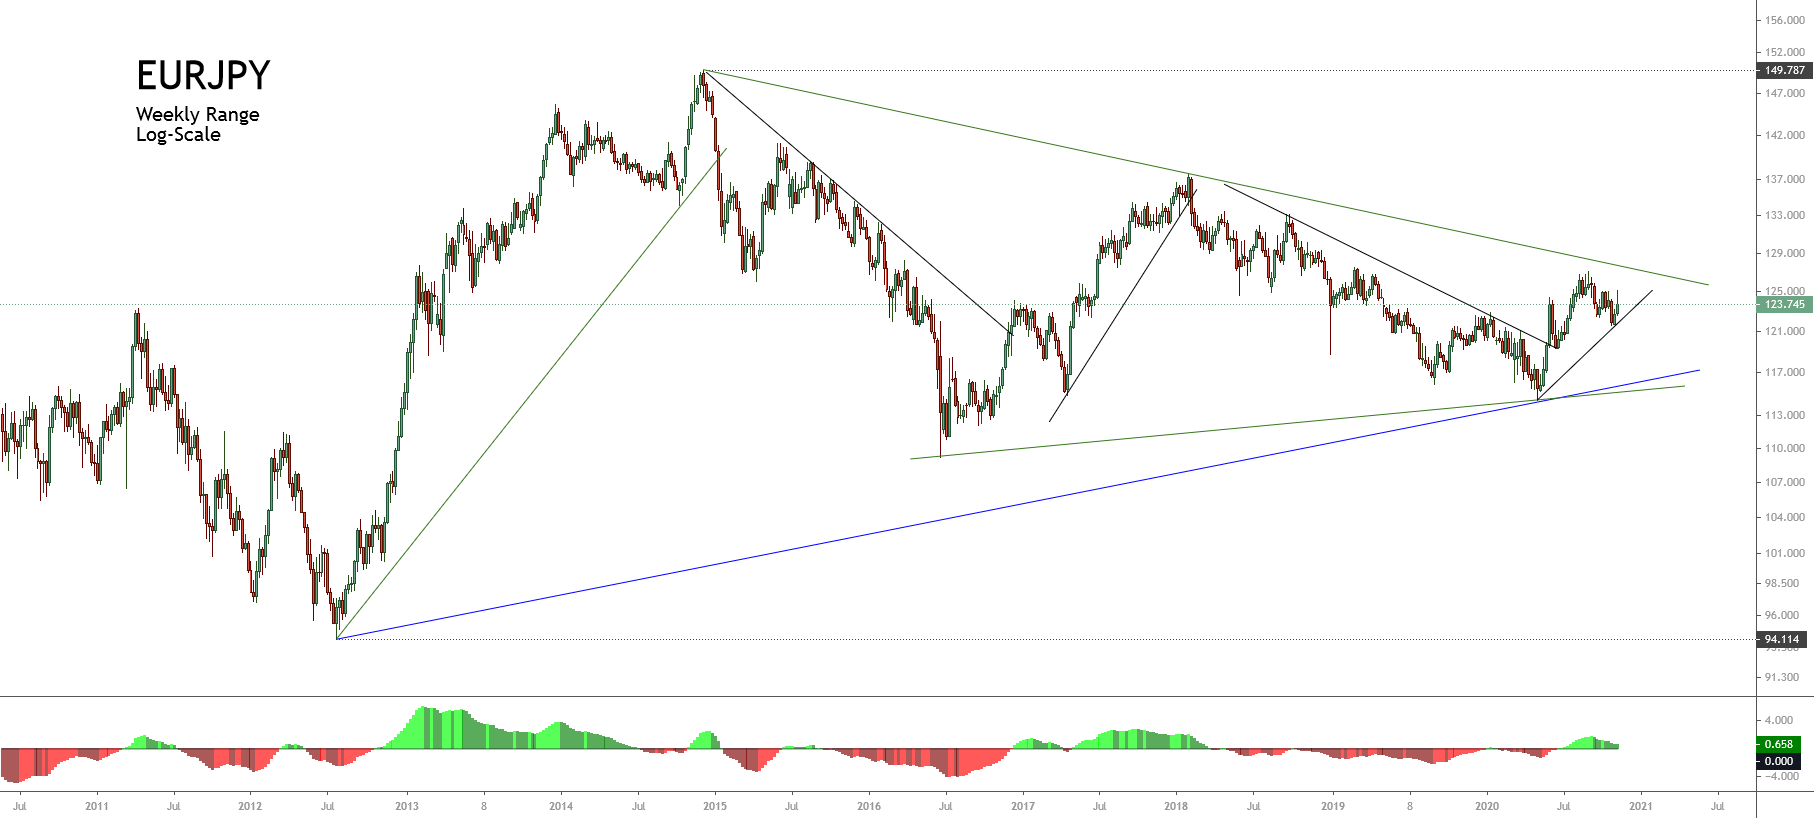
In our latest EURJPY analysis, we commented on its advance in an incomplete corrective structure identified as a triangle pattern, which remains in development since mid-2014.

Technical Overview

Also, we saw that the mid-term trend looks like an incomplete corrective structure, which seems to advance in a wave B of Minor degree, labeled in green. Moreover, the structure observed previously unveiled the progress in an incomplete wave ((b)), identified in black, which should develop a bounce toward the supply zone between 125.285 and 126.123.

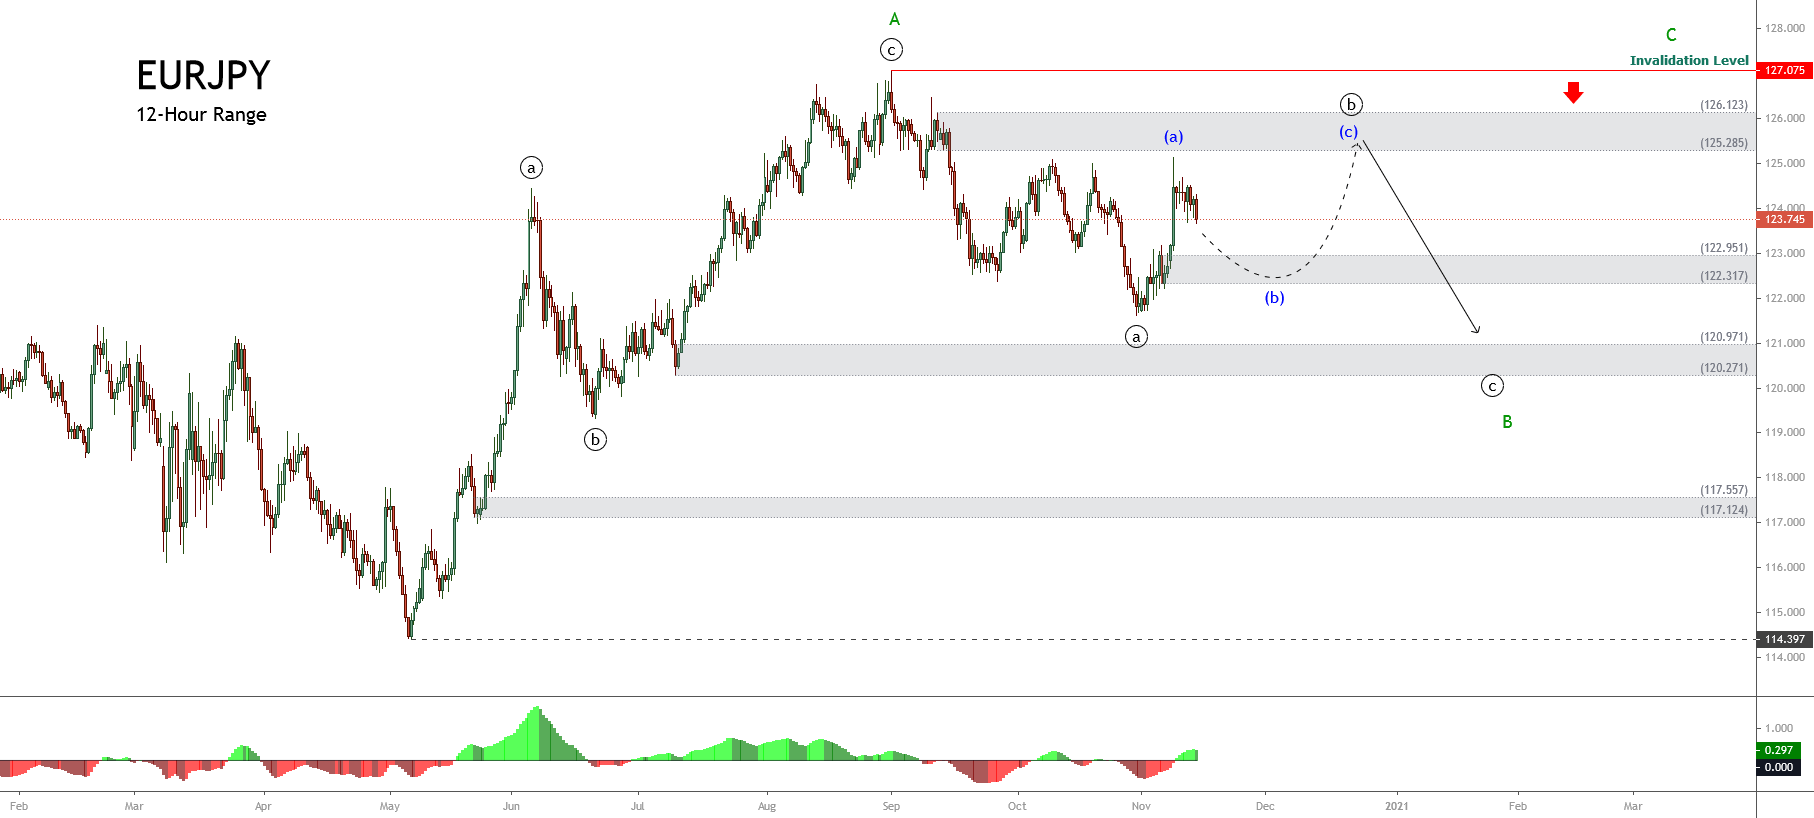
The price action is currently seen advancing in its wave (c) of Minuette degree, labeled in blue, which has now reached the supply zone between 125.285 and 126.123 forecasted in our previous analysis.

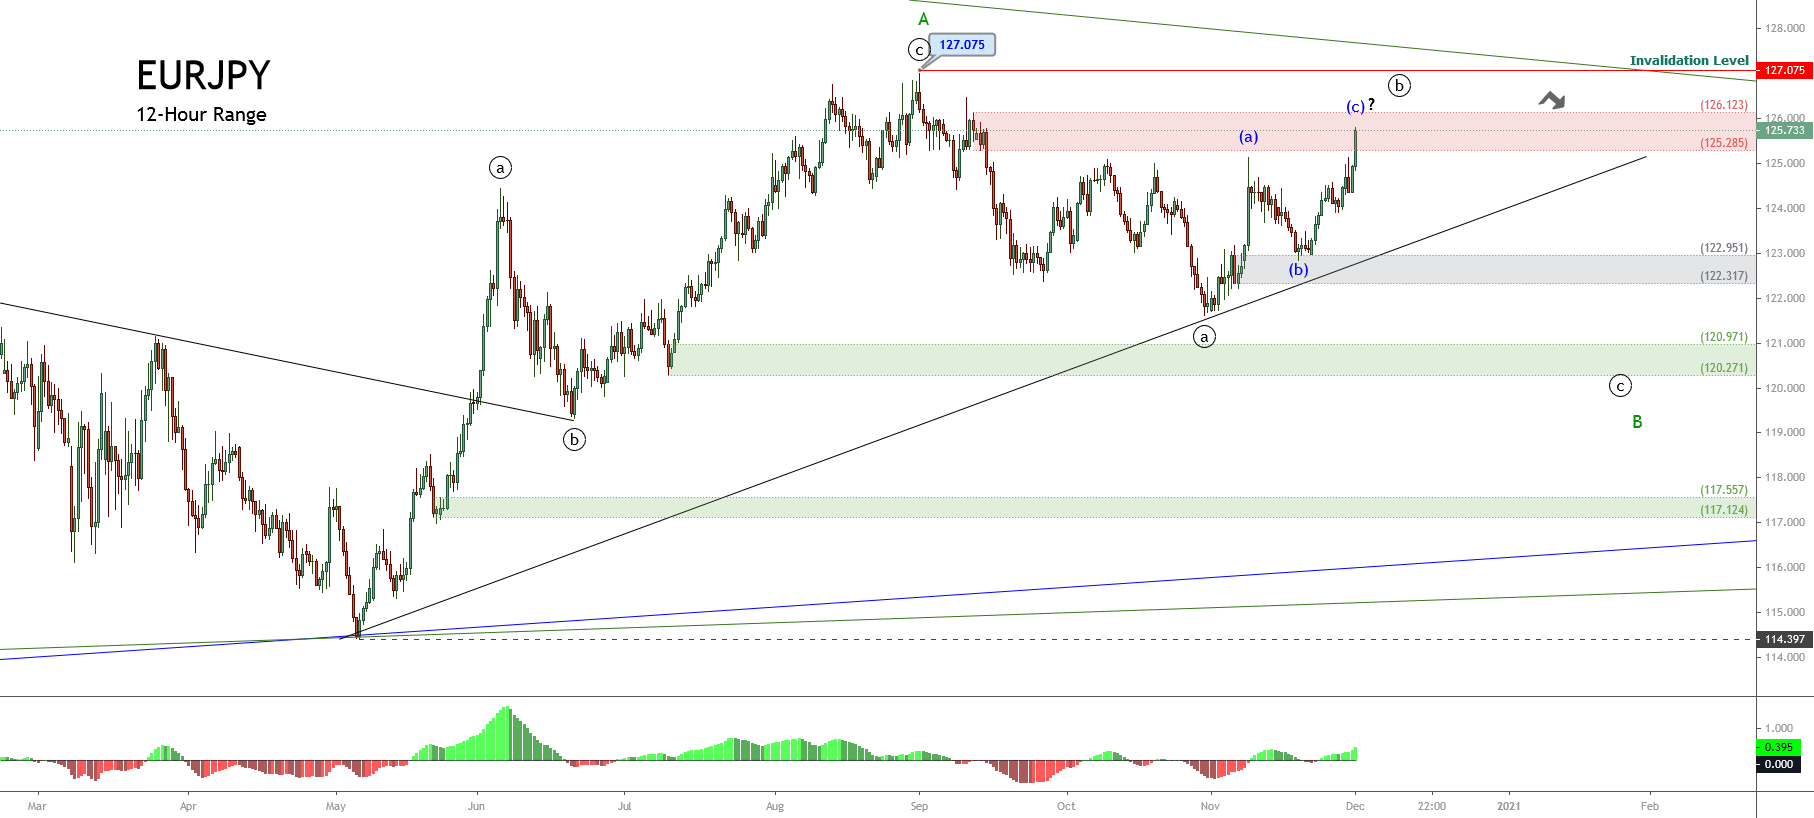
On the other hand, the current wave (c), in blue, that remains in development could extend its gains toward the psychological barrier of 126, where the cross could start to decline to the wave ((c)), in black. This bearish sequence, possibly developed with five internal segments, should complete the wave B of Minor degree, in green.

Short- term Technical Outlook

The EURJPY in its 2-hour chart reveals the internal structure created by the wave (c), in blue, which shows the intraday ascending channel plotted in green. The price action that has surpassed the ascending channel’s upper line suggests the rise of the third wave of Subminuette degree labeled in green that is in progress.

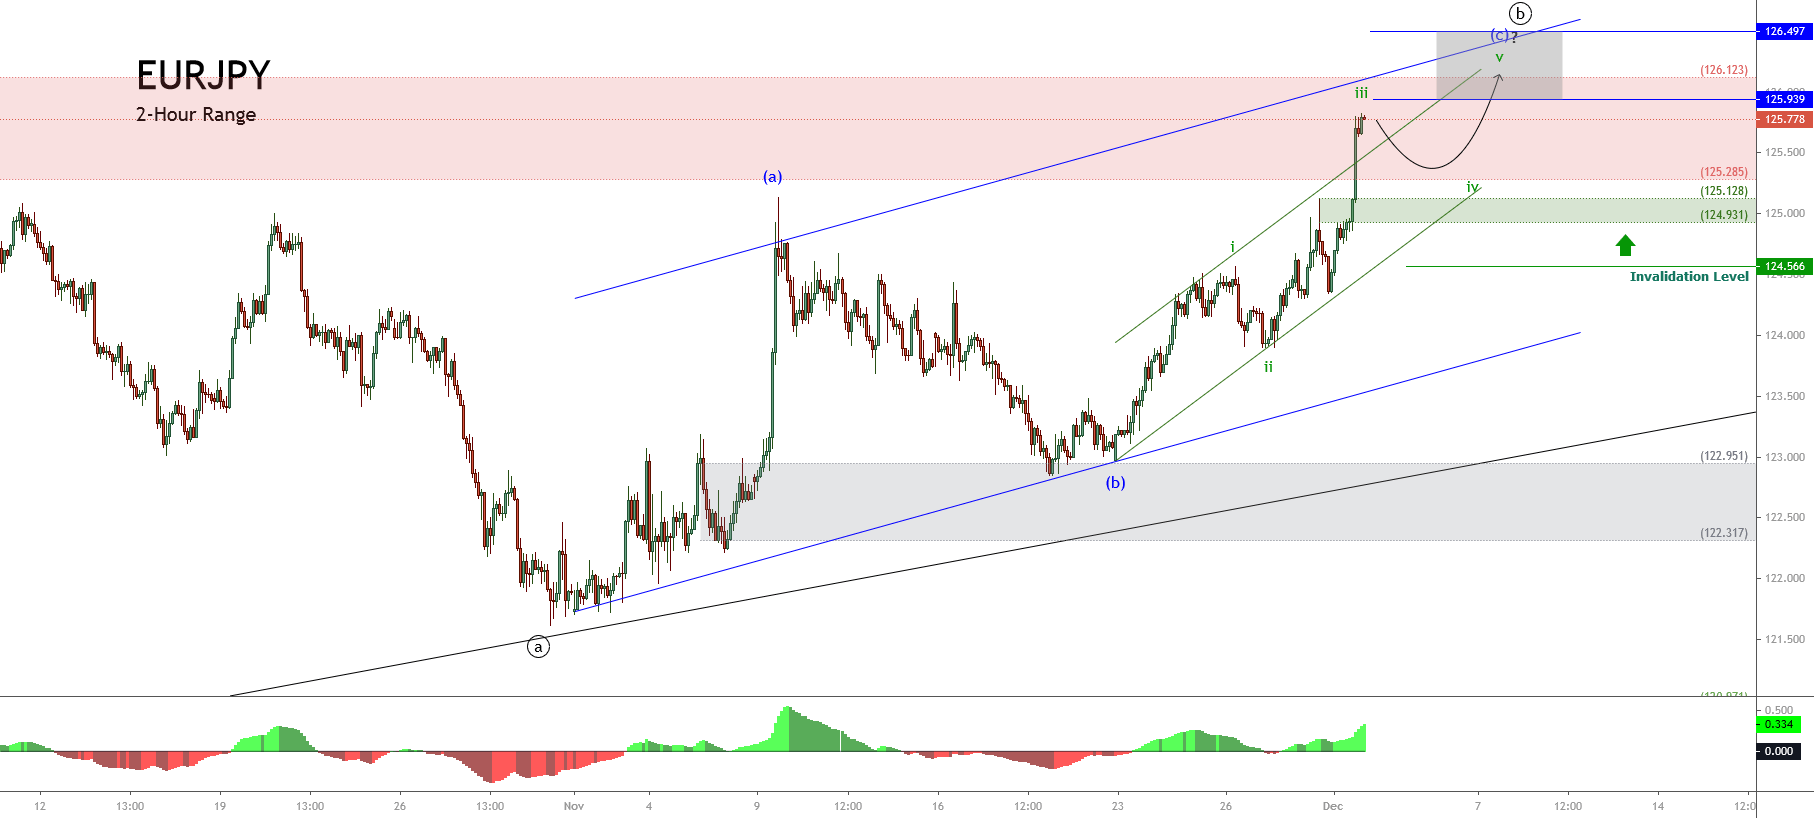
In this context, according to the Elliott Wave theory, once the EURJPY completes the advance of the third wave, in green, the cross should experience a limited decline corresponding to the fourth wave in green. This drop could reach the demand zone between 124.931 and 125.128, where the price could find fresh buyers expecting the price to head toward new highs.

The fifth wave’s potential target zone, in green, is located between 125.939 and 126.497. In this area, the cross could complete the wave ((b)) of Minute degree in black. 

Finally, the invalidation level of this intraday bullish scenario is found at 124.566, which corresponds to the top of the first wave of Minute degree.

Categories
Forex Course

134. Knowing the State of the Market

Introduction

Many newcomers and novice traders believe that the market moves in a random direction. They think it is all about the fundamental factors that keep the market going. In reality, the market does move based on fundamental factors, but it doesn’t imply that the prices move in random directions. The prices on the charts move in a specific direction as they are nothing but the past transactions of the big institutional players.

Charts tell a lot about the market environment. It clearly determines who is in control of the market – the buyer or the sellers. Based on this, there are three states of the market:

  • Trend
  • Range
  • Channel

Broadly speaking, in any market, be it Stock, commodity, currency, or cryptocurrency, the prices move only these three states. Let us understand each of them.

Of course, there are several types of chart patterns, but they all fall in one of the types on a bigger picture. All technical traders must have an understanding of the market environment. Whatever be the strategy, it will work applied in the right state of the market. Also, every type of market has its own concepts to trade.

Trend

The most evident type of market is a trending market. At the same time, it is one of the most confusing states to understand. A trending market is a type where the prices make Higher High & Higher Low sequences or Lower Low & Lower High sequences. In other words, in a trending market, the prices make a Higher High / Lower Low, retrace to the Support & Resistance, and continue with the same pattern.

A trending market is a type that can be found in any type of market. That is, even in ranges and channels, trends can be spotted (in a miniature picture).

Based on the direction of the market, we can divide trends into two types –

Uptrend (Bullish) – A market that faces upwards is an uptrend. The price makes Higher Highs and Higher Lows. It is a market where the buyers (bulls) are in control of the market. Note that a Higher High alone cannot be regarded as an uptrend.

Downtrend (Bearish) – A market whose trajectory is downwards is referred to as a downtrend. The price moves by making Lower Lows and Lower Highs. In this market, the sellers (bears) dominate the market.

Range

A ranging market is a type where the price does not create Higher Highs of Lower Lows. Thus, it moves sideways. There is a certain price shoots up and a price where it drops. It moves within these two prices. In this market, both buyers and sellers are strong. For example, if we say the market is ranging between 0.1200 and 0.2400, it means that the buyers are pushing up the market to 0.2400 from 0.1200, while the sellers are hitting it right back down to 0.1200.

Channel

A channel is basically a tilted channel. In other sense, a channel is a trend that is quite weak. In a channel, the price does try to make a Higher Highs or Lower Lows but retraces deeply before going for the next set. In a trend, the market respects the Support & Resistance, but the channel does not.

We hope you were able to get a gist on the states of the market. In the coming article, we shall elaborate on each of the types and understand how to trade them.

[wp_quiz id=”81457″]
Categories
Forex Signals

EURNZD Moves in a Short-Term Ascending Channel

Description

The EURNZD cross in its hourly chart exposes a short-term ascending channel that looks following the price action since the June 09th low at 1.71896, from where the cross started to develop a higher high and lower high sequence.

The June 11th high at 1.76530, which surpassed the previous swing high at 1.75890 from June 04th, the short-term picture changed the bias from bearish to bullish.

The RSI oscillator, which supports the change in our market sentiment, found support in the zone of level 40, which lead us to weight the bullish bias for the potential next move.

A bullish position will activate if the price soars above the last intraday swing at 1.7520, from where we expect an upside until the round level at 1.7605. However, we don’t foresee a rally over the upper long-term descending trendline in brown.

Our bullish scenario will be invalid if the price drops below 1.7475

Chart

Trading Plan Summary