Description
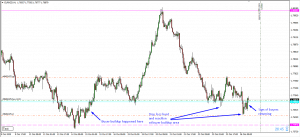
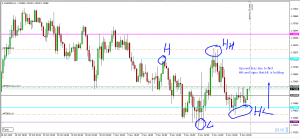
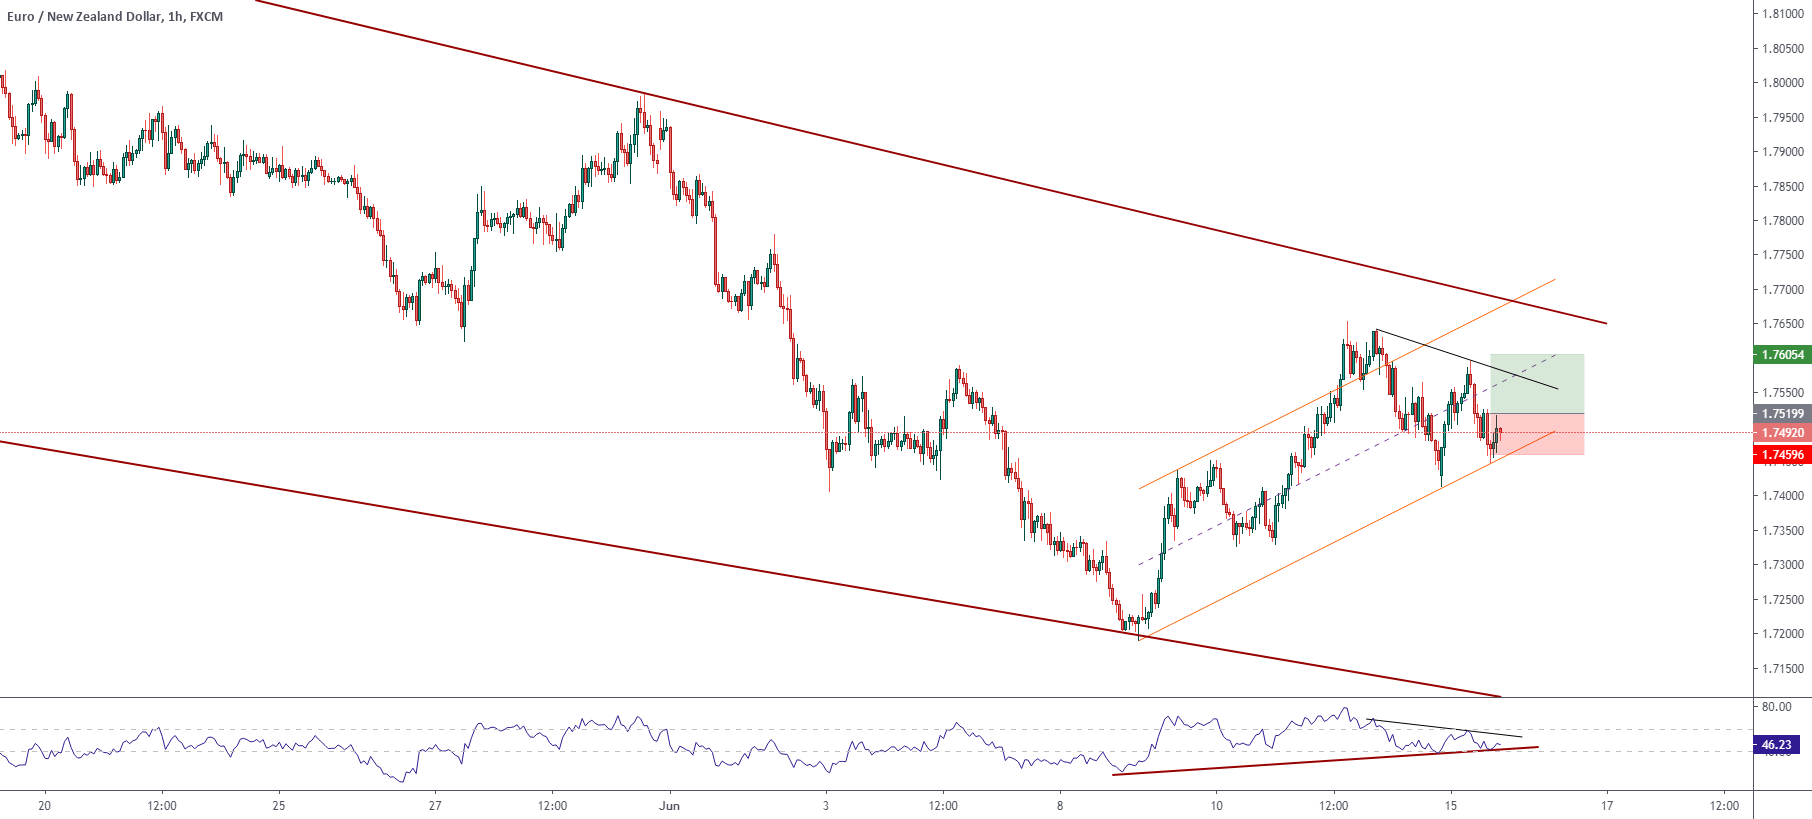
The EURNZD cross in its hourly chart exposes a short-term ascending channel that looks following the price action since the June 09th low at 1.71896, from where the cross started to develop a higher high and lower high sequence.
The June 11th high at 1.76530, which surpassed the previous swing high at 1.75890 from June 04th, the short-term picture changed the bias from bearish to bullish.
The RSI oscillator, which supports the change in our market sentiment, found support in the zone of level 40, which lead us to weight the bullish bias for the potential next move.
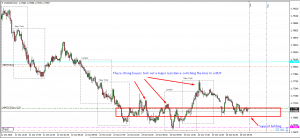
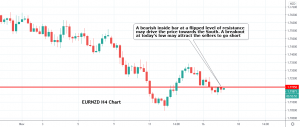
A bullish position will activate if the price soars above the last intraday swing at 1.7520, from where we expect an upside until the round level at 1.7605. However, we don’t foresee a rally over the upper long-term descending trendline in brown.
Our bullish scenario will be invalid if the price drops below 1.7475
Chart
Trading Plan Summary
- Entry Level: 1.7520
- Protective Stop: 1.7475
- Profit Target: 1.7605
- Risk/Reward Ratio: 1.5
- Position Size: 0.01 lot per $1,000 in trading account.