Categories
Forex Daily Topic Forex System Design

Trading System design – Basic Concepts

In previous articles, we explained the importance of a plan to succeed in Forex and described its general features. In this article, we will describe the concepts that need to be considered when designing a trading system.

A trading strategy is what most traders call a trading system, but it is not. A trading strategy is just a set of loose rules discretionary traders use to trade. A trading system is a set of closed rules used to systematically trade the market, usually through a computer EA, although a disciplined trader could also use it.

Traders, especially novice traders, get emotional and lose money because their emotions interfere and stop making rational decisions in the battle’s heat. Thus, the first thing to avoid is discretionary trading. Please read the article Know the Two Systems Operating inside Your Head. That’s why what we aim to create is a trading system that should be systematically traded.

Price imbalances

There are plenty of criteria to find these imbalances. There are two visual clues we can think of. The first one is a rubber band. The rubber band idea describes the price as if it was a rubber band or spring. When it moves far away from equilibrium, we expect the force to pull it to its center to increase and eventually drive it back to equilibrium.

The second visual clue is looking at the price moving in waves. Since there are numerous traders, their goals set in different timeframes, we can expect waves of different periods and amplitudes. A trend form when the combination of di
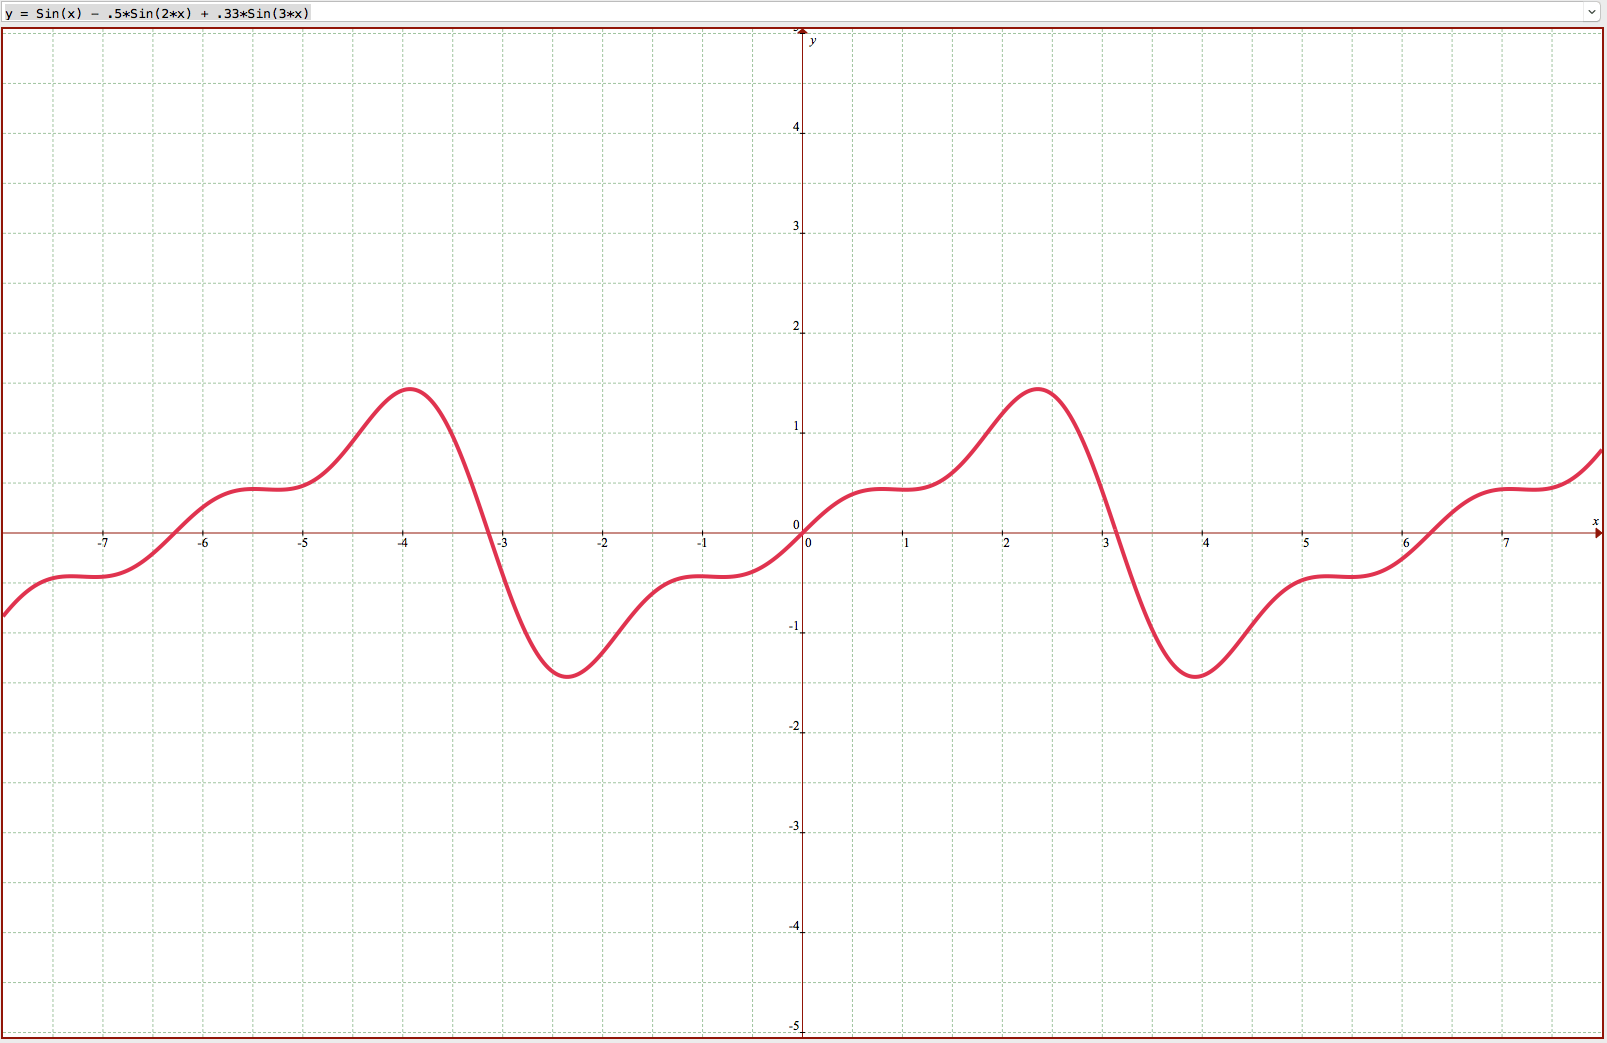
fferent waves are in sync, and chaotic moves occur when waves desync.

The main idea of a trading system is to find imbalances in the price and profit from it. Essentially, it takes the form of “buy low and sell high,” “sell high to buy back low,” or its variants “buy high sell higher,” “sell low, sell lower.”

The Effect of timeframes and a portfolio in the trading results

In their book Active portfolio management, Grinold and Kahn described the fundamental law of active management. The formula has two variables: The manager’s skill (IC) and the number of investments performed (N).

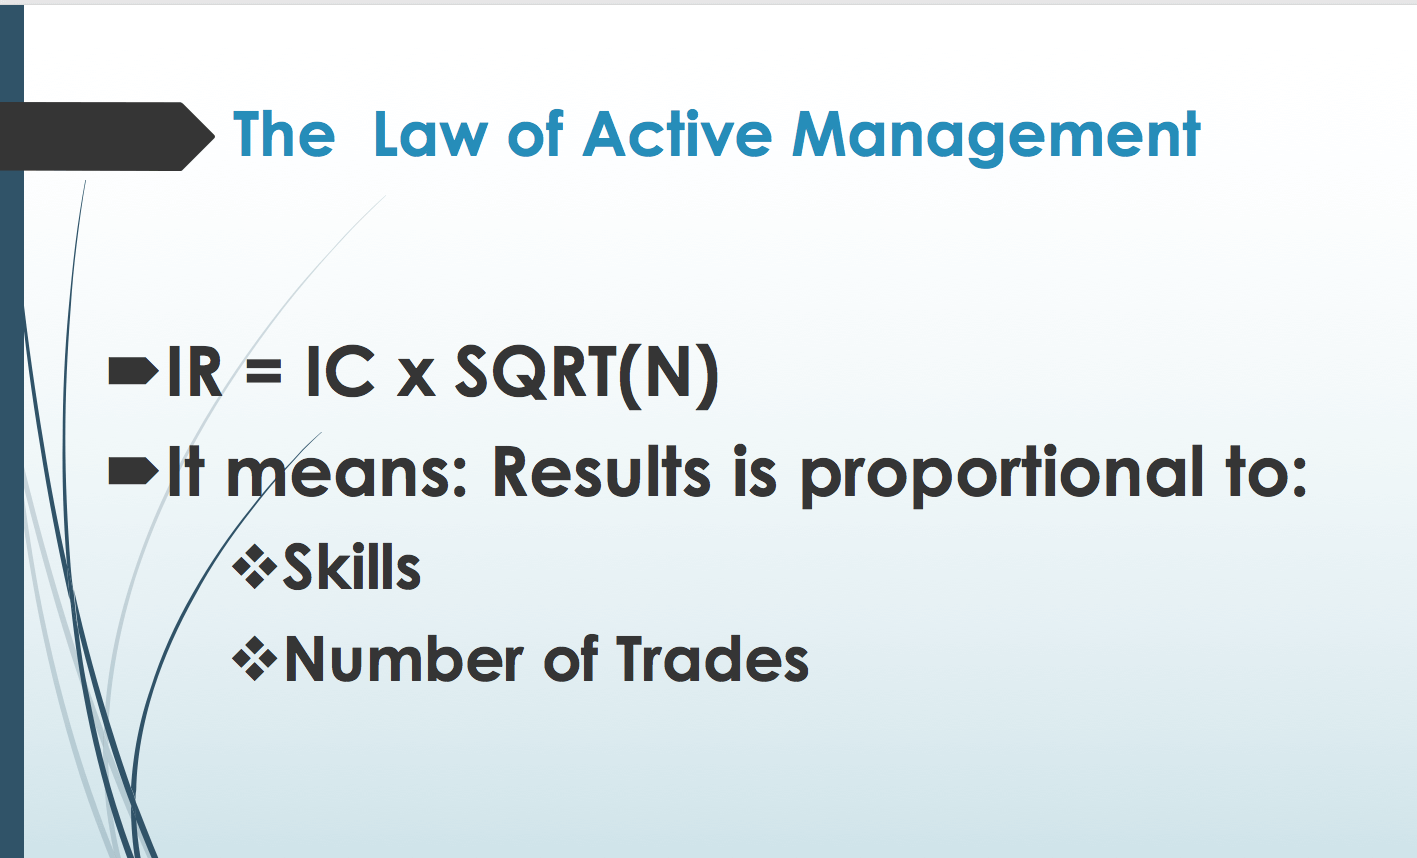
We could think of IR ( Information Coefficient) as a quality index of the results.

If we analyze the equation, we see that IC measures a trader’s ability to produce profits, since if N is constant, IR grows if IC grows.

But, if we keep the IC constant, we see that IR grows with the number of trades (N).

This explains that a portfolio of assets will be more profitable than only one asset. It also explains why shorter trading timeframes would produce higher results. Of course, with very short timeframes, the trading costs would eat a growing portion of the profits, so there is a limit to how short we could go.

Diversification

Diversification is a key concept to reduce the overall risk in trading. The idea is simple. Let’s say we have a long position the EURUSD with an overall dollar risk of 10 pips. If the dollar moves up and drives the pair southwards, we lose $100 on every lot. If we have an equivalent long position on the USDJPY, we will cover the risk on the EURUSD with the gains on the USDJPY, driving it to zero or, even, being positive overall.

If the assets are uncorrelated and the risk on each trade is similar on all trades, the overall basket’s risk will less than 50% of the sum of all open trades risk.

The profitability rule

Two parameters define the profitability of a system: the percent winners and the reward risk ratio.

The formula that tells the minimum percent winners (P) required with a determined reward/risk ratio (Rwr) for the system to be profitable is:

P > 1 / (1+Rwr) 

Conversely, below is the formula of the minimum reward/risk ratio needed with a determined percent winners figure on a profitable system:

Rwr > (1-P)/P

If you play with the second formula, you will see that at reward/risk ratios below one, the system should grant winners higher than 50 percent. Furthermore, Systems with high reward risk ratios would need less than 50% winners to be profitable.

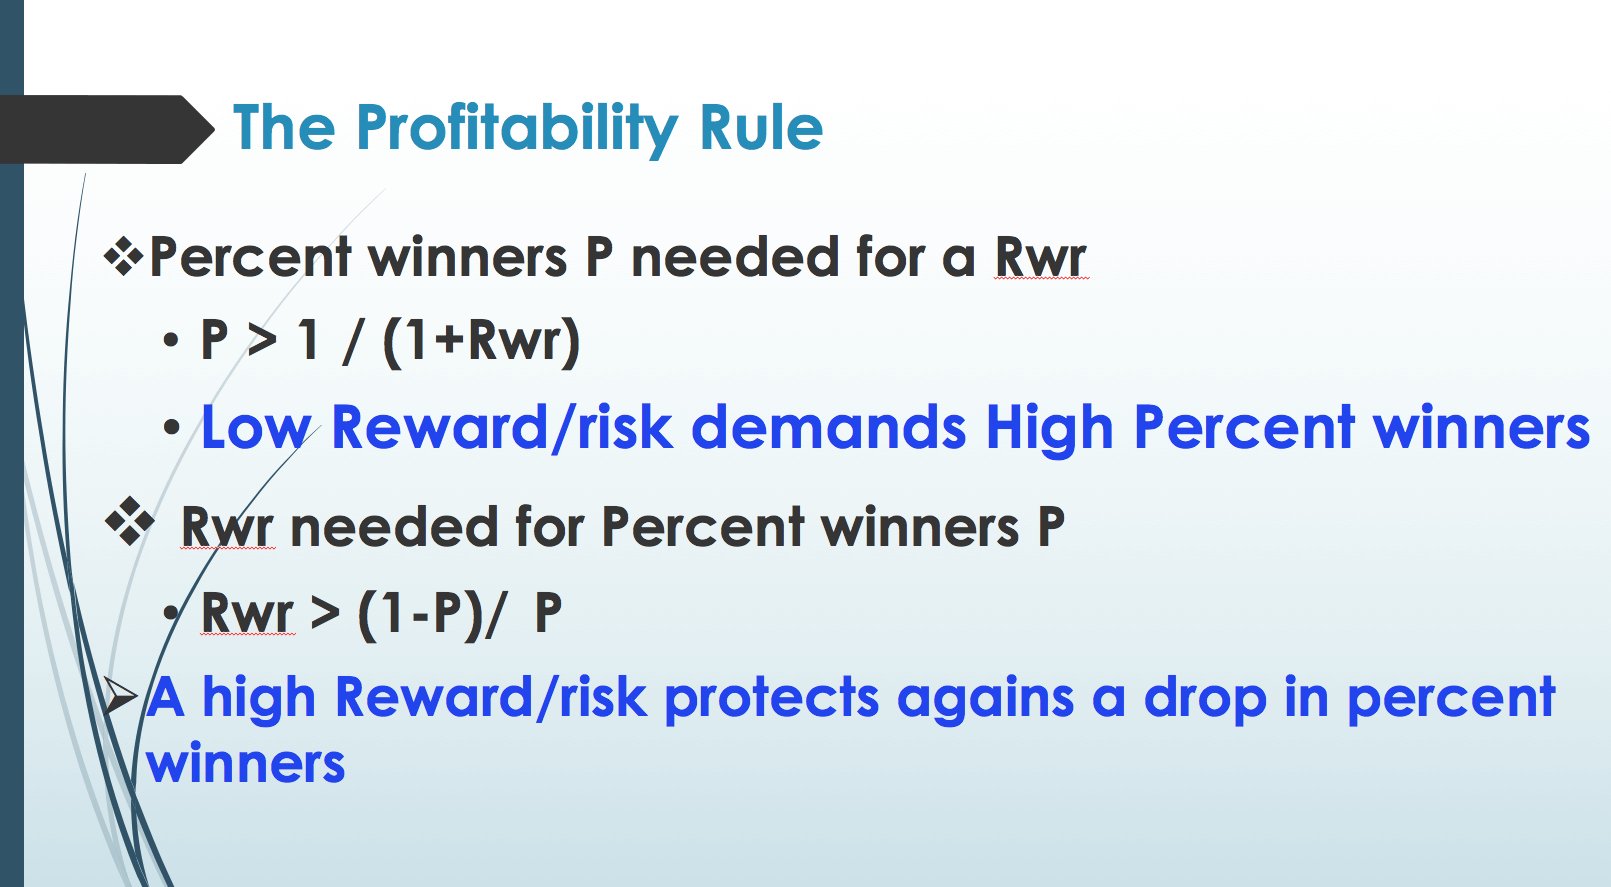
The conclusion is we must look for systems with high reward/risk ratios to protect us from periods of low winner’s percent.

Assessing the quality of a trading system

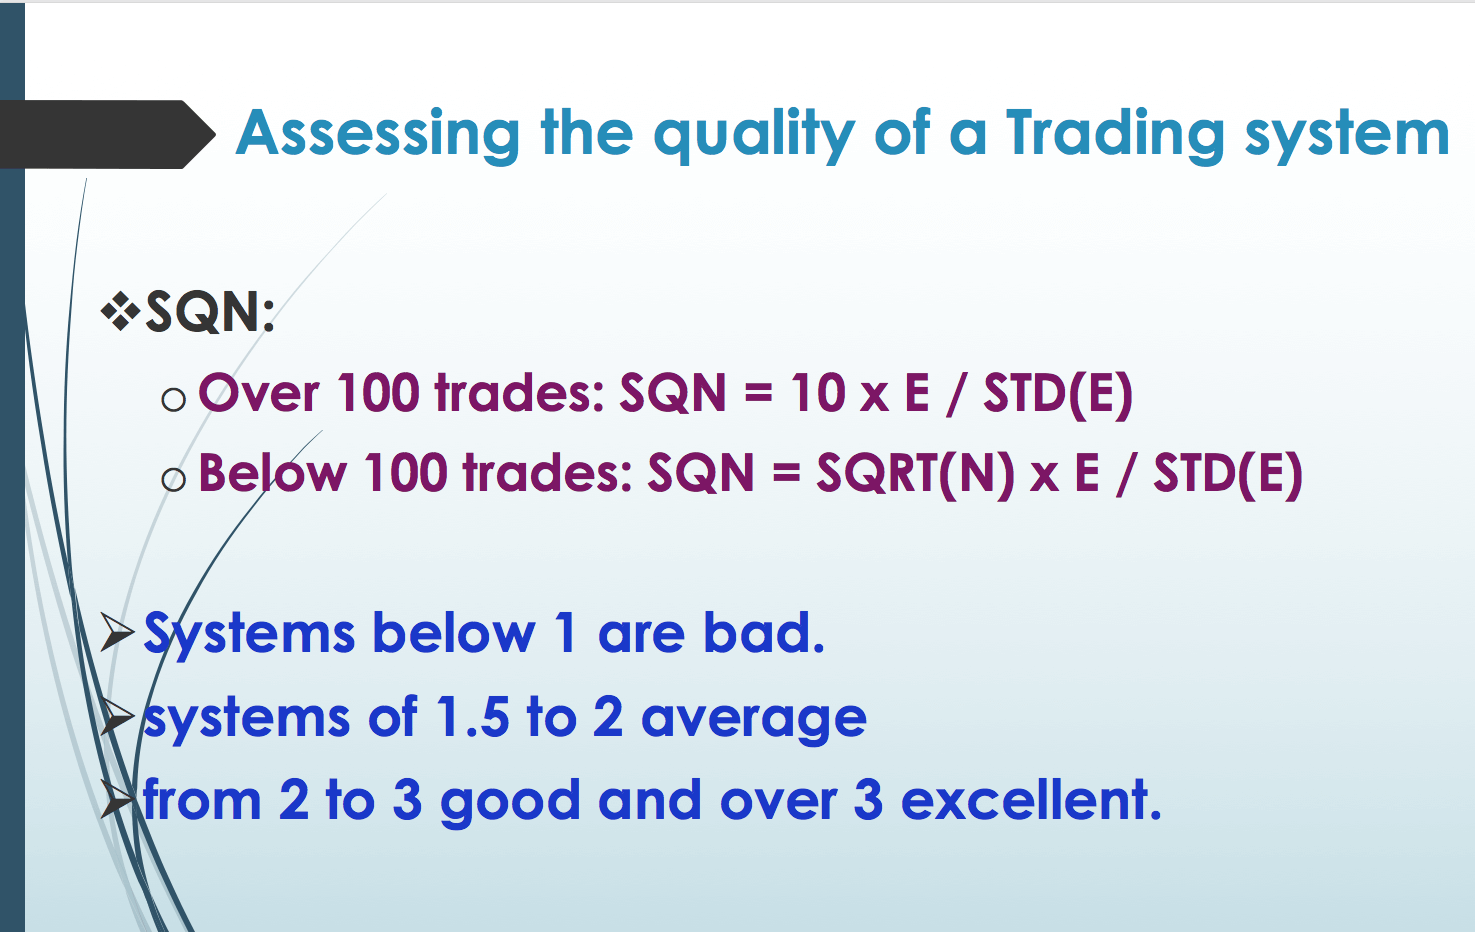
There are several methods to measure the quality of a trading system. We propose the use of Van Tharp’s SQN, which is a variation of the chi-square test, a well-known method to evaluate the goodness of a sample against a random distribution. The SQN test is a Chi-square test that is capped to 100 samples so that the length of the sample does not modify its value.

  SQN = 10 x E / STD(E)

Where E is the expected profit on each trade, which is the sum of all profits divided by the number of trades, and the denominator is the standard deviation of E.

But if the sample is less than 100 instead of 10, the multiplier is the square root of N, the number of trades.

SQN = √N x E / STD(E)

Systems below 1 are bad. systems of 1.5 to 2 average, and from 2 to 3 good and over 3 excellent.

Elements of a Trading System

We can decompose a trading system into its several elements, although not all of them need to be present.  We have already discussed this, but let’s describe its basic elements.

A Setup: The setup is a market state where we think there is an imbalance in the price, or a condition we expect can be resolved with a price move, for example, the price reaching a top or a bottom of a channel.

A permissioning filter: This forbids trading under specific market conditions: Low volume, extreme volatility, particular hours or days.

Entries: This the stage that times the market. It can be a breakout, a candlestick pattern, or an indicator signal.

Stop-loss: This defined an invalidation level, under which the trade is likely no longer profitable. This level will limit our losses and save our capital for further trades.

Take-profit: It defines our planned profit. It may be set using support/resistance levels or any other sign the current trade movement is over, such as a reversal signal or the crossover of averages.

Re-entry rule: You may also consider this rule in your findings. For instance, a market failing to do something, for example, continue moving up, may signify it will move down. Thus, you could stop and reverse instead of close the position. Also, if you got out of a position, you could consider re-entry if the market flags a continuation of the previous movement. That way, you could tight your stops keeping most of your profits and reenter instead of loose stops, which may eat a large portion of your hard-earned profits if the market does not recover.

Categories
Forex Education

Getting Started with your First Historical Simulation

Introduction

In the previous section, we learned the steps to create a trading strategy. At this stage of the trading strategy development, we will focus on the strategy’s simulation process using historical data.

What is the Historical Simulation?

The simulation is defined as a mathematical representation that describes a system or process, making it possible to generate forecasts of such a system.

As the years have advanced, computational technologies have evolved to allow many processes simultaneously performed.  Compared to what a processor could do 40 years ago, a mere smartphone outruns any of them. In this context, the trading strategies simulation has also done so, moving from the simulation using printed paper charts to the current computer systems we observe today.

By running a historical simulation on a trading strategy, the developer should be able to estimate the gains and losses the strategy would have generated under historic market conditions within a given period.

However, while the benefit of executing a historical simulation enables one to estimate the profits and losses and whether the strategy is profitable or not, this statement should be analyzed by the developer throughout the trading strategy developing process.

Getting Started

Once the developer has completed a trading strategy, including entry and exit rules, as well as the definition of risk management and position sizing, it is necessary to formulate the rules of the strategy using a computer language. This way, the trading simulation software will execute the rules algorithm and apply it to the study’s financial dataset.

Several programming languages are able to carry out the trading strategy simulation, such as MQL4 of MetaTrader, Easy Language of Trade Station, or Python. However, for this educational article, we will continue to use the MetaTrader MQL4 language.

First Steps in the Simulator

MetaTrader 4 offers its Strategy Tester to simulate trading strategies. In the following figure, we observe the Strategy Tester terminal, in which we can develop a historical simulation of any trading strategy under study. 

The figure highlights that Strategy Tester has a user-friendly and intuitive interface for the developer, who can select the Expert Advisor that will contain the trading strategy to simulate. Similarly, the user can choose both the financial market, the timeframe, and the date span in which the simulation should run.

Running the First Simulation in Strategy Tester

In this example, we will continue using a moving-average-crossover-based trading strategy. To recap, this strategy is based on the following rules:

  • A buy position will be opened when the 5-hour weighted moving average (LWMA) crosses above the 55-hour simple moving average (SMA). 
  • A sell position will be activated when the 5-hour LWMA crosses below the 55-hour SMA.
  • The buy position will be closed when the LWMA 5-hour has crossed below the SMA 20-hour.
  • The sell position will be closed when the LWMA 5-hour has crossed over the SMA 20-hour.
  • The position sizing will be a constant 0.1-lot.
  • Only one trade at a time is allowed.

The criteria for the execution of the historical simulation are as follows:

  • Market to simulate: GBPUSD pair.
  • Timeframe: 1 hour.
  • Simulation range: from January/02/2014 to October/02/2020.

From the simulation’s execution, we observe the following result provided by the Strategy Tester at the end of the simulation.

From the above figure, we note that the balance line was reduced by $2,230.63 from the initial balance of $10,000, reaching a final balance of $7,769.37. This result leads us to conclude that the average-crossover strategy is not profitable. However, this is just a preliminary result.  It is still possible that we could make this strategy profitable through an optimization process, where we will assess what parameter values perform the best.  We could also add stop-loss and take-profit targets that statistically boost the system into profitable territory.

Conclusions

In this educational article, we have seen the first steps to perform a historical simulation. This process provides the developer with an overview of the strategy’s performance in a given financial market under certain conditions. We highlight that the performance conditions could repeat in the future. For this reason, once evaluated the strategy feasibility in terms of profitability, the developer should test the trading strategy during a specific period with paper money in real-time.

On the other hand, the profitable or non-profitable result is just a snapshot of the strategy’s performance. During the optimization process, the developer will investigate the parameters that provide higher profitability or lower risk for the investor.

The next educational article will review the simulator’s information in detail once the historical simulation has been executed.

Suggested Readings

  • Jaekle, U., Tomasini, E.; Trading Systems: A New Approach to System Development and Portfolio Optimisation; Harriman House Ltd.; 1st Edition (2009).
  • Pardo, R.; The Evaluation and Optimization of Trading Strategies; John Wiley & Sons; 2nd Edition (2008).
Categories
Forex Service Review

REV Trader Pro FX Trading System Review

REV Trader Pro is an automated trading robot that was created by money manager and trading system developer Doug Price. The product works with the MetaTrader 4 trading platform.

Overview

REV Trader Pro is an automated system that uses trend reversal technology while avoiding false trading signals. It detects potential market reversals with high accuracy, according to the developer. Loss-prevention settings reduce losses from broker commission, spread, and slippage. The bot comes with default settings that have been adjusted to offer superior performance, although traders can change several settings if they prefer to. Traders can also set a certain percentage for the risk factor they would like to take on each trade. The system works with any type of broker (STP, NDD, etc.) on the H1 timeframe with the major pairs AUDUSD, GBPUSD, EURUSD, and NZDUSD. Alert popups and email notifications can be enabled for important updates as well.

Service Cost

This trading system was previously offered to wealthy clients and has supposedly experienced a price drop. Unfortunately, the developer does not list the exact price on the website, however, online reviews mention that traders have paid around $650 to $750 for the system. This does come with a lifetime license, a 60-day money-back guarantee, free updates and strategy improvements, and 24-hour access to Skype and/or email support with the developer.

Conclusion

Rev Trader Pro is marketed in the $650+ range, meaning that the software is only acquirable for traders that have a good amount to invest. Of course, traders will need to know that the product will turn a profit and eventually pay for itself. The website claims that the software is used by wealthy clients with more than $10 million dollars, but it is important to look at user reviews as well. Here is one helpful review we found online:

“Doug helped me with all the questions I had on this robot within 24 hours, so I consider his customer service as excellent. When I told him the REV trader PRO was not made for me, he refunded my money without any delay and hassle.”

While this review was written by an individual that speaks about the developer’s positive customer service, most of the product information is posted on other review websites. REV Trader Pro has earned a rating of around 3 to 4 stars in general– however, many have recommended avoiding the product because of the $700 price tag and “horrible” performance. With everything in mind, we would recommend trying out the free trial before making the purchase. Do keep in mind that there are some helpful risk management settings, but traders should purchase this EA with caution. Otherwise, you’ll lose a steep amount with this iffy investment.

REV Trader Pro can be found at the following web address: https://www.revtraderpro.com