Categories
Forex Education Forex System Design

How to Optimize a Trading Strategy

Introduction

Once the developer successfully ends both the multi-market and multiperiod test of a trading strategy, he can move to the optimization process. However, there are some risks associated with its execution that the developer should recognize.

In this educational article, we’ll present the different stages of a trading strategy’s optimization process.

Preparing for the Optimization

After passing the multimarket and multiperiod test, the developer has verified that the trading strategy works. Therefore, he could move toward the next stage that corresponds to the trading strategy optimization.

Optimization is used to determine the optimal parameters for the best result of a specific process. In terms of trading strategy, the optimization corresponds to selecting the most robust parameter set of a strategy that would provide the peak performance in real-time markets. 

Nevertheless, selecting the highest performance that provides the most robust set of parameters can result in challenging work. This situation occurs because each set of parameters will correspond to a specific historical data range used in each simulation.

In this regard, the developer’s top parameter selection must be part of a set of evaluation criteria defined before executing the optimization process.

Risks in Optimization

The optimization has pitfalls that the developer must consider at the time of its execution; these traps can lead to increased risks when applying the trading strategy.

The first risk is overconfidence that the results obtained during optimization will produce the same market results in real-time. The developer must understand the strategy and each effect of the results obtained in each part of the optimization stage.

The second risk involves excessive overfitting of the strategy’s parameters. This risk is due to the execution of the optimization without considering the guidelines and appropriate statistical procedures.

Finally, using a wide range of parameters can lead to obtaining extremely positive backtested results. However, such positive returns generated during the optimization stage do not guarantee that they will happen in real-time markets.

Optimizing a Trading Strategy in MT4

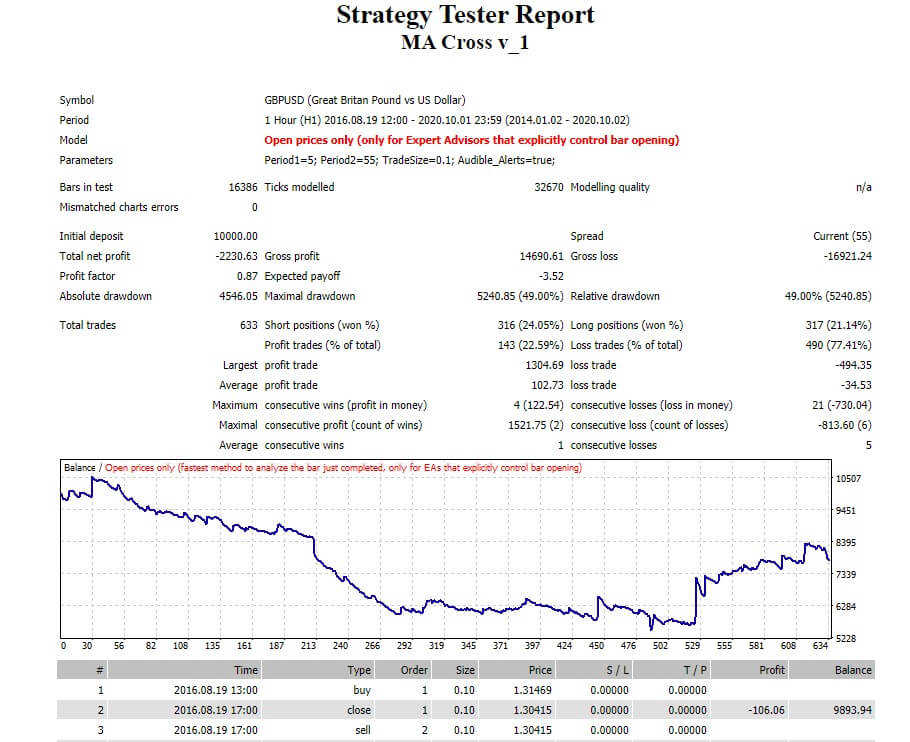
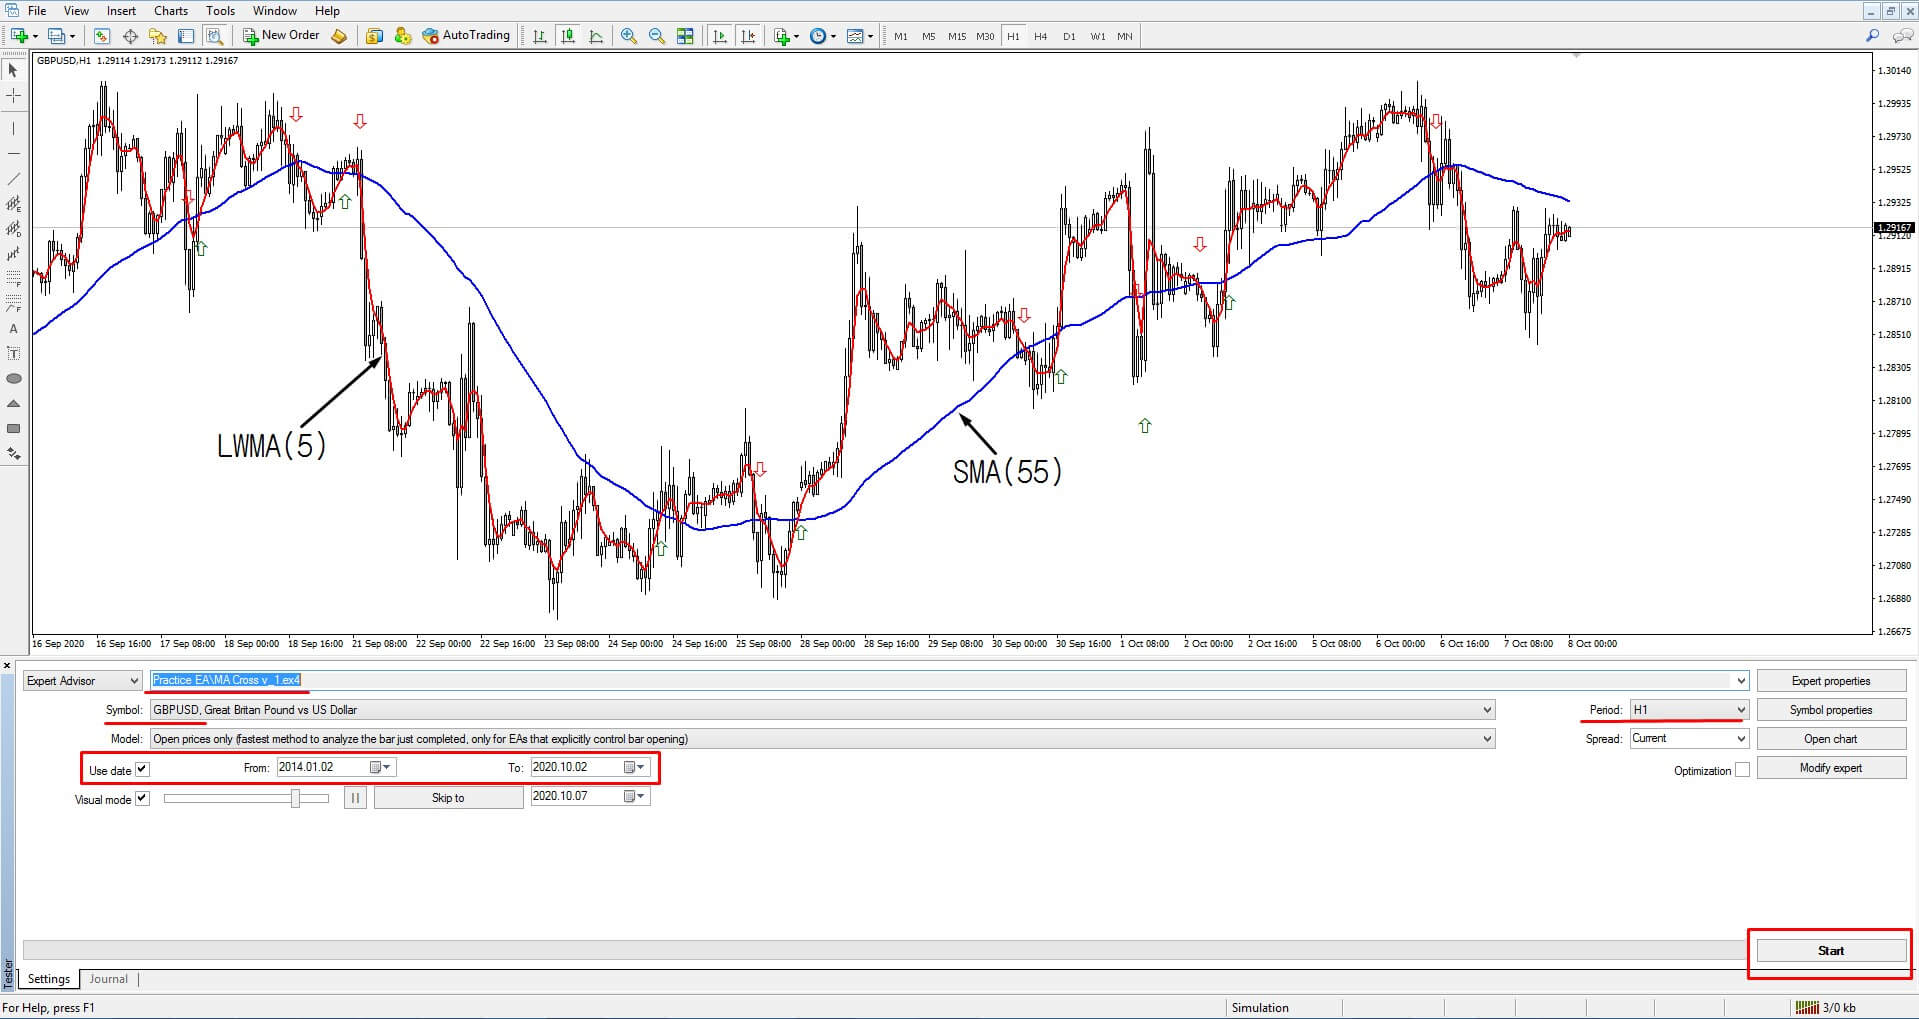
In a previous educational article, we presented the development process of a trading strategy based on the crossings of two moving averages, which corresponds to a linear weighted moving average (LWMA) of 5 periods and a simple moving average (SMA) of 55 periods. 

This example considers the execution of an optimization corresponding to both moving averages, and the optimization’s objective will be to find the highest profit.

Before executing the optimization, the developer must select the Strategy Tester located in the toolbar, as illustrated in the next figure.

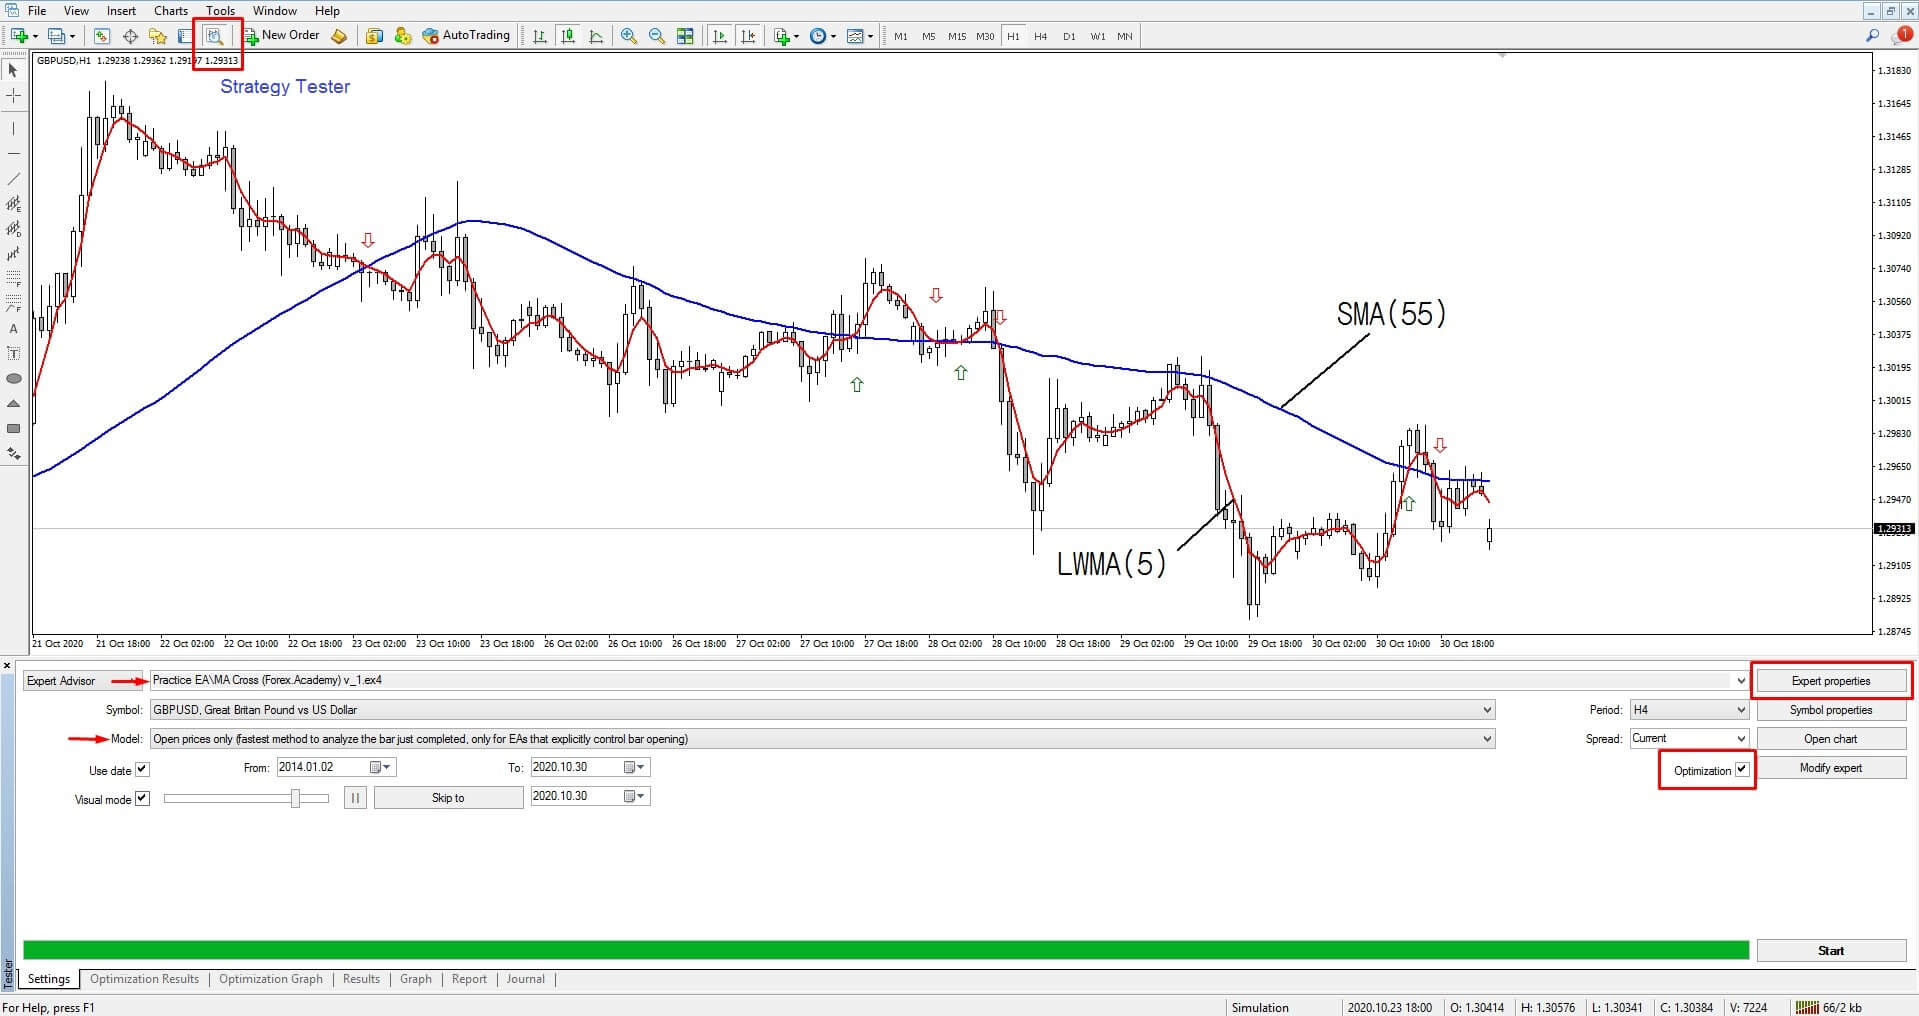
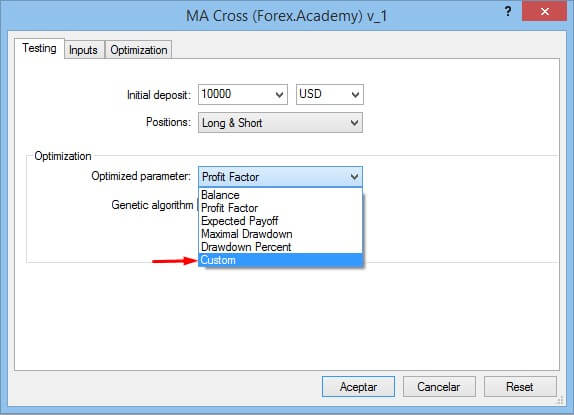
Once picked the trading strategy to optimize, it must select “Expert Properties,” where the developer will identify and define the parameters to optimize.

The next figure illustrates the “Expert Properties” box. In the first tab, the developer will select the Testing properties, where the “Custom” option will provide a broad range of outputs for each scenario obtained during the simulation stage. 

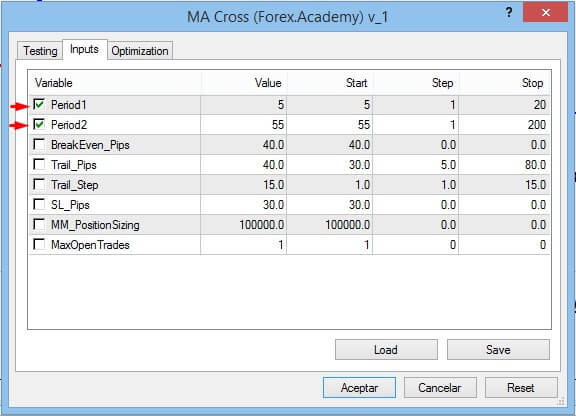
After the Testing selection criteria, the developer can select the parameters to optimize during the historical simulation. In the example, the parameters to optimize will be the fast (LWMA(5)) and the slow (SMA(55)) moving averages. The developer must consider that as long as it increases the parameters to optimize simultaneously, the simulation will increase its length of time.

Once the “Start” button is pressed, the Strategy Tester in the “Optimization Results” tab will reveal each parameter variation’s output. In the case illustrated in the following figure, the results are listed from the most to less profitable. 

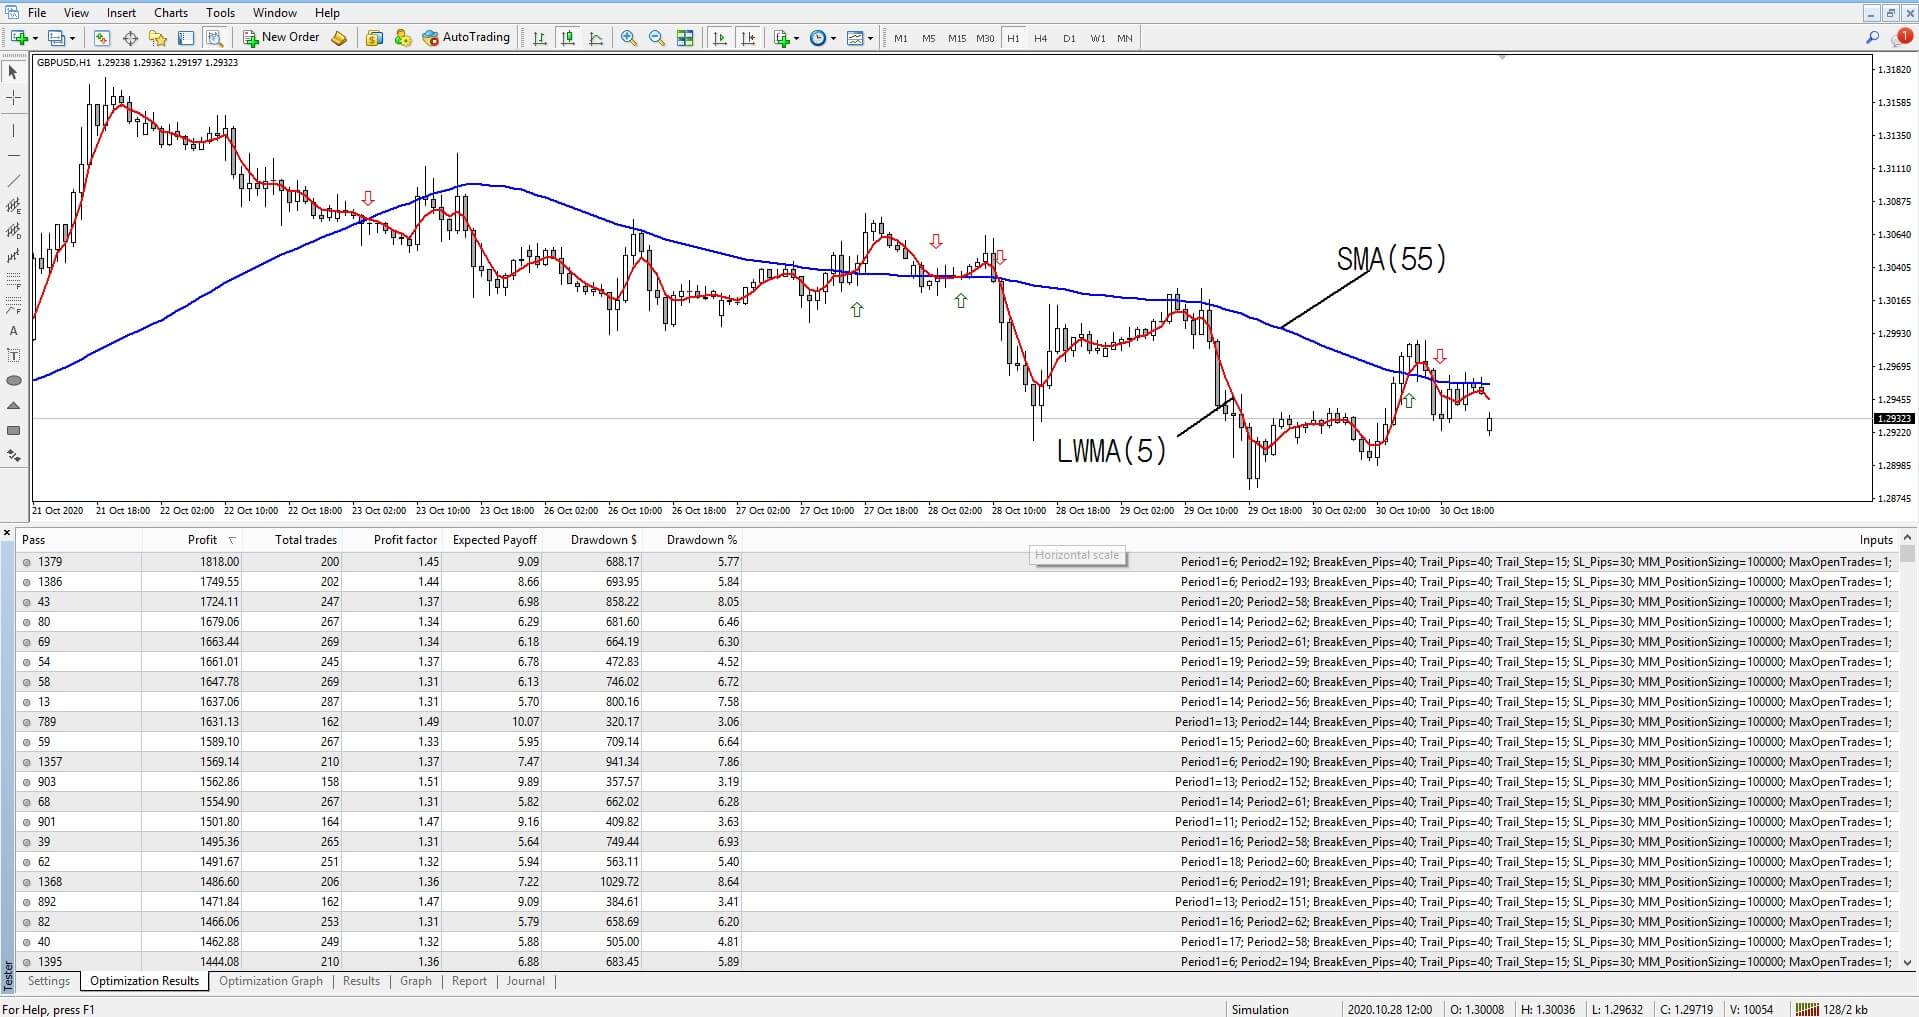
The results also expose the Total Trades, Profit Factor Expected Payoff, Drawdown ($), and Drawdown (%), and the inputs for each historical simulation.

In conclusion, the trading strategy based on the cross between LWMA(6) and SMA(192) in the historical simulation returned $1,818 of profits with a Drawdown equivalent to 5.77% or $688.17. Likewise, these parameters are valid only for a 4-hour chart

Nevertheless, analyzing the criteria described by Robert Pardo, which considers that a trading strategy should provide three times the drawdown, the strategy should generate three times the dropdown, in this case, the parameters applied into the model returned 2.64 times more profits over the drawdown. 

Next Tasks After the First Optimization

Once the first optimization was performed, the developer should analyze the trading strategy behavior with non-correlated assets and its performance in other timeframes. 

If the strategy passes this stage, the developer could make a walk-forward analysis. Among other questions, the strategist should answer whether the strategy will make money in real-time trading.  He also should evaluate the strategy’s robustness, where he would determine if the strategy is sufficiently robust and ready to trade in real-time.

Finally, once these stages are successfully passed, the trading strategy should be tested with paper money before its implementation in the real market.

Conclusions

In this educational article, we presented the steps for executing a simple optimization corresponding to a trading strategy based on the cross between two moving averages.

Before starting to optimize a trading strategy, the developer must weigh both the risks involved by the optimization process and the optimization analysis’s objective as the results that the study will generate.

Finally, although the optimization process reveals that the trading strategy is robust, the developer must continue evaluating if it can generate real-time trading profits.

Suggested Readings

  • Jaekle, U., Tomasini, E.; Trading Systems: A New Approach to System Development and Portfolio Optimisation; Harriman House Ltd.; 1st Edition (2009).
  • Pardo, R.; The Evaluation and Optimization of Trading Strategies; John Wiley & Sons; 2nd Edition (2008).
Categories
Forex Trading Platforms

MT4 Vs. MT5 – Which One Should I Use?

Forex traders can choose the trading platform they want to use. However, this choice is interrelated with the choice of the Forex Broker, as not all types of trading platforms are offered by all brokers. In addition, some brokers do not have real compatibility with certain Forex trading platforms, but giving access to them via a bridge, which is a way a software connects a Forex broker trading system to the platform. This may work satisfactorily, but if the bridge is malfunctioning or slow it may adversely affect the implementation and management of trades.

The trading platform MetaTrader 4 is well known and can definitely be said to set the industry standard. I have never seen a Forex broker who does not offer to trade directly through the platform or through an internal bridge to the platform, although this may be at the cost of a slightly higher spread and/or commissions. The MT5 trading platform is something less common, although it is produced by the same

Essentially, MT5 was designed to be able to operate in markets other than Forex, such as the stock or commodity market, basically because it is more able to connect to a centralized trading exchange. Forex is a completely decentralized market, with a number of major players providing liquidity to this huge market at slightly different prices, uncoordinated. Shares and commodities, the latter is traded largely as a futures contract (in fact, several contracts with different maturity dates), it should usually be negotiated through a centralized process before the property can change hands with full legal effect. At the time of the development and publication of MT5, it can be assumed that Metaquotes foresaw a boom in trading in equities and retail commodities, and designed the software to suit that market.

The other important factor of the differential design was the compliance with the “no cover rule” of the U.S., which states that clients of Forex brokers in the U.S. must negotiate on a F.I.F.O. (first-in, first-out) basis. This means that if, for example, an operator is going to buy 1 batch of EUR/USD, and then buys an additional batch of EUR/USD, the first transaction must be closed before the second can be closed. While Metatrader 4 records each transaction individually and allows the management of each individual position separately, Metatrader 5 automatically adds all positions. Therefore, only the Metatrader 4 can deal with coverage: Metatrader 5 does not.

This is fine for operators in the U.S., as they are legally prohibited from coverage in any case, but in almost all the world, many operators find the difficulty of not being able to carry out coverage operations a very annoying and unnecessary handicap. It is probably the main reason why many traders have become annoyed by being “pushed” to use Metatrader 5 instead of Metatrader 4 by their brokers and possibly by Metaquotes as well. So, to sum up, MT5 was developed to attract US markets. and to meet the needs of this market better than MT4 could. This is the story of MT4 vs. MT5.

What are the differences between MT4 and MT5 Forex platforms? The two main differences have already been covered, but there are others worth mentioning within any comparison between MT4 and MT5.

MT5 uses a programming type called MQL5 compared to the MQL4 used by MT4. The best thing about MQL5 is that it allows programming “black box” which, in a nutshell, means it is easier to program and therefore, logically will be a better framework for users and developers of trade robots and other expert advisors. However, Metaquotes expanded this capability in MQL4 in 2014, so it is no longer a difference between platforms, although there is a likelihood that if the language is updated at some point in the future, Metaquotes will not extend any updates in MQL4 as well as MQL5

It should be noted that there is no retroactive compatibility. Programs written for Metatrader 4 cannot run on Metatrader 5. This can be a serious inconvenience for traders who wish to “upgrade”, and is a key reason why such a change should not be seen as an update.

It is true that the Metatrader 5 retains two key advantages related to programming over the Metatrader 4. First, its backtesting functions, where you can test the scheduled trading strategies, run at a much faster rate, which is a feature that can save you a lot of time if you are the type of trader that needs to run a large number of backtests. It also allows for the simultaneous testing of multicurrency peer retrospectives. Overall, this can speed up back-testing procedures immeasurably.

Categories
Forex System Design

How to Read a Simulation Report

Introduction

When the developer performs the trading strategy design, it evaluates through a historical simulation process to overview its results under certain conditions. However, once finished the simulation, the software delivers a series of data that could confuse the developer with a broad kind of information provided by the report.

In this educational article, we will present the main elements of the historical simulation report.

Essential Data of the Historical Simulation Report

Within the wide variety of platforms that allow historical simulations, there is a set of essential data that the software provides at the end of the simulation process. These data are grouped into three large blocks: Performance Summary, Equity Chart, and Trades List.

The following figure shows the example of a report of a historical simulation performed in Strategy Tester of MetaTrader 4.

The report presents three blocks, which are detailed as follows.

Performance Data Summary

This section provides summarized statistical data from the historical simulation of the trading strategy. The key performance indicators are as follows:

  • Total Net Profit: This is the financial result of all trades executed during the simulation period. This value corresponds to the difference between the “Gross Profit” and the “Gross Loss.” A reading above zero is indicative of a trading strategy with positive mathematical expectation.
  • Maximal Drawdown: This is the highest local maximum loss expressed in the deposit currency and percentage of the deposit. In general terms, this value should be as low as possible. The criterion of maximum permissible drawdown will depend on the risk target of the trading strategy developer.
  • Total Trades: Corresponds to the total number of trades executed during the historical simulation. The developer might consider this value to assess the level of aggressiveness of the strategy. Also, it can use it to value the strategy in terms of its operational costs. For example, a strategy with a high number of trades could be more aggressive for a conservative investor. In turn, it implies a high operational cost in terms of paying commissions.
  • Percentage of Trades Winners: This is the number of profitable trading positions divided by the total number of positions. 
  • Profit Factor: This is the relationship between Gross Profit and Gross Loss. A reading lower than 1 suggests that the strategy generates more losses than gains. On the contrary, if it is greater than 1, then the strategy provides more profit than losses for each currency unit invested.
  • Sharpe Ratio: Some historical simulation platforms of trading strategies provide the Sharpe Ratio. This indicator represents the expected return on a risk-adjusted investment of an asset. In general, investors tend to consider as risk-free return the rate of the United States Treasury bond. A reading of less than 1 suggests that the trading strategy provides more volatile results. In other words, the developer could assume that the trading system is riskier than another with a ratio greater than 1.

Balance Curve

The balance curve chart presents the cumulative result of the trading strategy using a line chart. The information provided in this chart represents the result of the strategy execution under conditions and parameters in which the developer carried out the historical simulation.

Considering the investor’s objectives, the developer could improve its performance by optimizing the initial parameters.

List of Trades

This section of the report shows in detail each trade that the strategy performed during the simulation period. This list usually shows the following data:

  • Date of entry.
  • Type of order (buy, sell).
  • Entry price.
  • Size of the position.
  • Date of close.
  • Closing price.
  • Profit or loss of the trade.
  • Profits and losses accumulated or Balance.


Conclusions

The historical simulation process provides an overview of trading strategy behavior according to the developer’s parameters initially defined. This information is reflected in the simulation report, which provides a wide variety of information about the strategy’s performance under predetermined conditions.

Within the information provided at the end of the historical simulation, there are key data that the developer should not fail to value these are: Total Net Profit, Maximal Drawdown, Total Trades, Percentage of Trades Winners, Profit Factor, and Sharpe Ratio, which some simulation software does not provide it. However, the lack of availability of this data is not a limitation for assessing the strategy’s performance but will depend greatly on the criteria and experience of the developer of the trading strategy.

The developer can use this information to confirm that the trading strategy is proceeding as specified initially. Also, it can use this data to understand the strategy’s behavior during each trade.

This information is also important to spot potential improvements in the strategy. For instance, you could detect that several large losses may be trimmed with a better stop-loss replacement. You could also find out that a good portion of the trades was closed at a less than optimal level. The developer may conclude that the system would greatly improve with a better take-profit algorithm.

Also, the information gathered from the simulation may help improve the entries. For instance, you could find out that there are large losses at the beginning of the trade most of the time. That could signal the entries flag too quickly, or you may notice that the strategy would benefit from early entries to improve profits.

Finally, according to the developer’s objectives and the information analysis, the developer could attempt to adjust and optimize the needed parameters that could improve the strategy’s performance.

Suggested Readings

  • Pardo, R.; The Evaluation and Optimization of Trading Strategies; John Wiley & Sons; 2nd Edition (2008).


Categories
Forex Education

Getting Started with your First Historical Simulation

Introduction

In the previous section, we learned the steps to create a trading strategy. At this stage of the trading strategy development, we will focus on the strategy’s simulation process using historical data.

What is the Historical Simulation?

The simulation is defined as a mathematical representation that describes a system or process, making it possible to generate forecasts of such a system.

As the years have advanced, computational technologies have evolved to allow many processes simultaneously performed.  Compared to what a processor could do 40 years ago, a mere smartphone outruns any of them. In this context, the trading strategies simulation has also done so, moving from the simulation using printed paper charts to the current computer systems we observe today.

By running a historical simulation on a trading strategy, the developer should be able to estimate the gains and losses the strategy would have generated under historic market conditions within a given period.

However, while the benefit of executing a historical simulation enables one to estimate the profits and losses and whether the strategy is profitable or not, this statement should be analyzed by the developer throughout the trading strategy developing process.

Getting Started

Once the developer has completed a trading strategy, including entry and exit rules, as well as the definition of risk management and position sizing, it is necessary to formulate the rules of the strategy using a computer language. This way, the trading simulation software will execute the rules algorithm and apply it to the study’s financial dataset.

Several programming languages are able to carry out the trading strategy simulation, such as MQL4 of MetaTrader, Easy Language of Trade Station, or Python. However, for this educational article, we will continue to use the MetaTrader MQL4 language.

First Steps in the Simulator

MetaTrader 4 offers its Strategy Tester to simulate trading strategies. In the following figure, we observe the Strategy Tester terminal, in which we can develop a historical simulation of any trading strategy under study. 

The figure highlights that Strategy Tester has a user-friendly and intuitive interface for the developer, who can select the Expert Advisor that will contain the trading strategy to simulate. Similarly, the user can choose both the financial market, the timeframe, and the date span in which the simulation should run.

Running the First Simulation in Strategy Tester

In this example, we will continue using a moving-average-crossover-based trading strategy. To recap, this strategy is based on the following rules:

  • A buy position will be opened when the 5-hour weighted moving average (LWMA) crosses above the 55-hour simple moving average (SMA). 
  • A sell position will be activated when the 5-hour LWMA crosses below the 55-hour SMA.
  • The buy position will be closed when the LWMA 5-hour has crossed below the SMA 20-hour.
  • The sell position will be closed when the LWMA 5-hour has crossed over the SMA 20-hour.
  • The position sizing will be a constant 0.1-lot.
  • Only one trade at a time is allowed.

The criteria for the execution of the historical simulation are as follows:

  • Market to simulate: GBPUSD pair.
  • Timeframe: 1 hour.
  • Simulation range: from January/02/2014 to October/02/2020.

From the simulation’s execution, we observe the following result provided by the Strategy Tester at the end of the simulation.

From the above figure, we note that the balance line was reduced by $2,230.63 from the initial balance of $10,000, reaching a final balance of $7,769.37. This result leads us to conclude that the average-crossover strategy is not profitable. However, this is just a preliminary result.  It is still possible that we could make this strategy profitable through an optimization process, where we will assess what parameter values perform the best.  We could also add stop-loss and take-profit targets that statistically boost the system into profitable territory.

Conclusions

In this educational article, we have seen the first steps to perform a historical simulation. This process provides the developer with an overview of the strategy’s performance in a given financial market under certain conditions. We highlight that the performance conditions could repeat in the future. For this reason, once evaluated the strategy feasibility in terms of profitability, the developer should test the trading strategy during a specific period with paper money in real-time.

On the other hand, the profitable or non-profitable result is just a snapshot of the strategy’s performance. During the optimization process, the developer will investigate the parameters that provide higher profitability or lower risk for the investor.

The next educational article will review the simulator’s information in detail once the historical simulation has been executed.

Suggested Readings

  • Jaekle, U., Tomasini, E.; Trading Systems: A New Approach to System Development and Portfolio Optimisation; Harriman House Ltd.; 1st Edition (2009).
  • Pardo, R.; The Evaluation and Optimization of Trading Strategies; John Wiley & Sons; 2nd Edition (2008).
Categories
Forex Daily Topic Forex System Design

Designing a Trading Strategy – Part 5

Introduction

In a previous article, we presented the effect of incorporating additional rules in a trading strategy during the design process. In particular, we intuitively proposed a rule that opens a position using a size considering a percentage level of equity in the trading account.

In this educational article, corresponding to the last part of the series dedicated to designing trading strategies, we will expand position sizing concepts.

Position Sizing

The determination of the position size in each trade corresponds to the third element of a trading strategy. This decision will determine the capital that the investor will risk in each trade.

The position sizing corresponds to the volume committed in each trade. This volume can be the number of contracts, shares, lots, or another unit associated with the asset to be traded. The complexity of the position sizing is based on the efficient determination of the position to ensure maximum profitability with an acceptable risk level for the investor.

Programming the Position Sizing

To visualize the difference between some methods of position sizing, we will apply the criteria to the strategy of crossing moving averages analyzed in previous articles:

Fixed Size: This method is probably the most typical when developing a trading strategy. The rule consists of applying a fixed volume per trade. For example, consider the position size of 0.1 lot per trade, the code for our strategy is as follows:

extern double TradeSize = 0.1;

   //Open Buy Order, instant signal is tested first
   if(Cross(0, iMA(NULL, PERIOD_CURRENT, Period1, 0, MODE_LWMA, PRICE_CLOSE, 0) >
 iMA(NULL, PERIOD_CURRENT, Period2, 0, MODE_SMA, PRICE_CLOSE, 0))
 //Moving Average crosses above Moving Average
   )
     {
      RefreshRates();
      price = Ask;
      SL = SL_Pips * myPoint; //Stop Loss = value in points (relative to price)   
      if(IsTradeAllowed())
        {
         ticket = myOrderSend(OP_BUY, price, TradeSize, "");
         if(ticket <= 0) return;
        }
      else //not autotrading => only send alert
         myAlert("order", "");
      myOrderModifyRel(ticket, SL, 0);
     }
   
   //Open Sell Order, instant signal is tested first
   if(Cross(1, iMA(NULL, PERIOD_CURRENT, Period1, 0, MODE_LWMA, PRICE_CLOSE, 0) <
 iMA(NULL, PERIOD_CURRENT, Period2, 0, MODE_SMA, PRICE_CLOSE, 0))
 //Moving Average crosses below Moving Average
   )
     {
      RefreshRates();
      price = Bid;
      SL = SL_Pips * myPoint; //Stop Loss = value in points (relative to price)   
      if(IsTradeAllowed())
        {
         ticket = myOrderSend(OP_SELL, price, TradeSize, "");
         if(ticket <= 0) return;
        }
      else //not autotrading => only send alert
         myAlert("order", "");
      myOrderModifyRel(ticket, SL, 0);

Percentage of Risk per Trade: this criterion considers the account’s size given the account’s capital and estimates the stop loss distance needed to execute the trade according to the devised strategy. The common practice is to risk 1% of the equity currently available in the trading account. In this case, the implementation of the strategy is as follows:

double MM_Percent = 1;
double MM_Size(double SL) //Risk % per trade, SL = relative Stop Loss to
 calculate risk
  {
   double MaxLot = MarketInfo(Symbol(), MODE_MAXLOT);
   double MinLot = MarketInfo(Symbol(), MODE_MINLOT);
   double tickvalue = MarketInfo(Symbol(), MODE_TICKVALUE);
   double ticksize = MarketInfo(Symbol(), MODE_TICKSIZE);
   double lots = MM_Percent * 1.0 / 100 * AccountBalance() /
 (SL / ticksize * tickvalue);
   if(lots > MaxLot) lots = MaxLot;
   if(lots < MinLot) lots = MinLot;
   return(lots);
  }

Position Sizing to Equity: this method executes the trading order according to the trading account’s equity. For example, the developer could place one lot per $100,000 in the trading account. This method will increase or reduce each transaction’s volume as the capital of the trading account evolves.

extern double MM_PositionSizing = 100000;
double MM_Size() //position sizing
  {
   double MaxLot = MarketInfo(Symbol(), MODE_MAXLOT);
   double MinLot = MarketInfo(Symbol(), MODE_MINLOT);
   double lots = AccountBalance() / MM_PositionSizing;
   if(lots > MaxLot) lots = MaxLot;
   if(lots < MinLot) lots = MinLot;
   return(lots);
  }

There are other methods, such as martingale and anti-martingale, discussed in a forthcoming educational article. For now, we present your definition.

  • Martingale: this rule is based on the money management of gambling. This method doubles the position size after each losing trade and starts at one position after each win. This method is extremely dangerous and should be avoided.
  • Anti-Martingale: this method opposes martingale, that is, doubles the position size after each winning trade and starts with a position after a losing trade. This method plays with what the trader considers to be “market’s money.” It is advisable to reset the size after a determined number of steps since the logic bets on a winning streak, which will end at some point. A 3-step is good enough to increase profits substantially. 4-step may be an absolute maximum on most trading strategies.

Conclusions

Position sizing is one of the critical decisions that the trading strategy developer must make. This choice will influence both the trading account’s growth and the capital risk to be exposed in each trade.

On the other hand, we have seen three examples of position sizing, representing a criteria guide that the trading strategy developer can use.

Finally, the developer of the trading strategy should explore and evaluate which is the best option of position sizing to use, taking into account the benefits of each of the impacts on the strategy’s execution.

Suggested Readings

  • Jaekle, U., Tomasini, E.; Trading Systems: A New Approach to System Development and Portfolio Optimisation; Harriman House Ltd.; 1st Edition (2009).
  • Pardo, R.; The Evaluation and Optimization of Trading Strategies; John Wiley & Sons; 2nd Edition (2008).