Categories
Forex Basic Strategies Forex Trading Strategies

Why You Should Spend More Time Working on Strategies

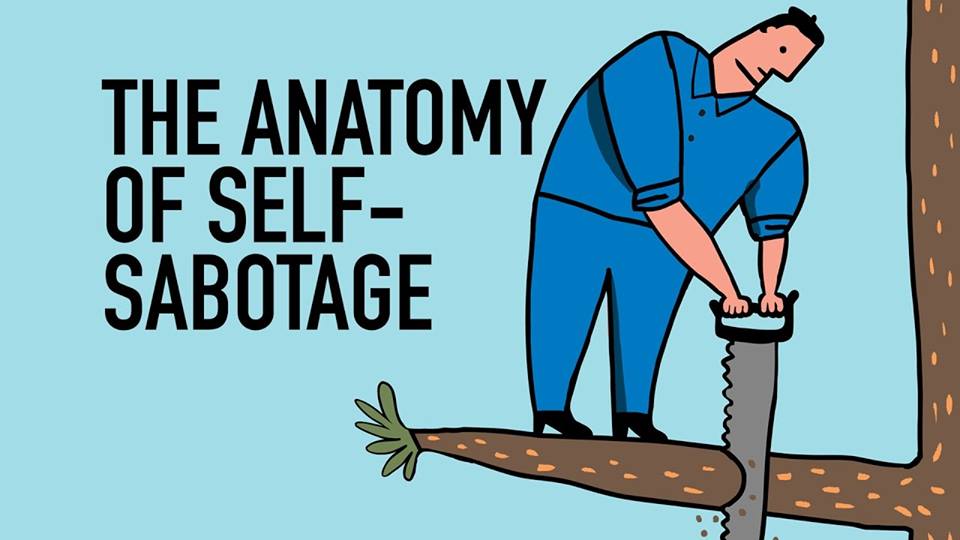
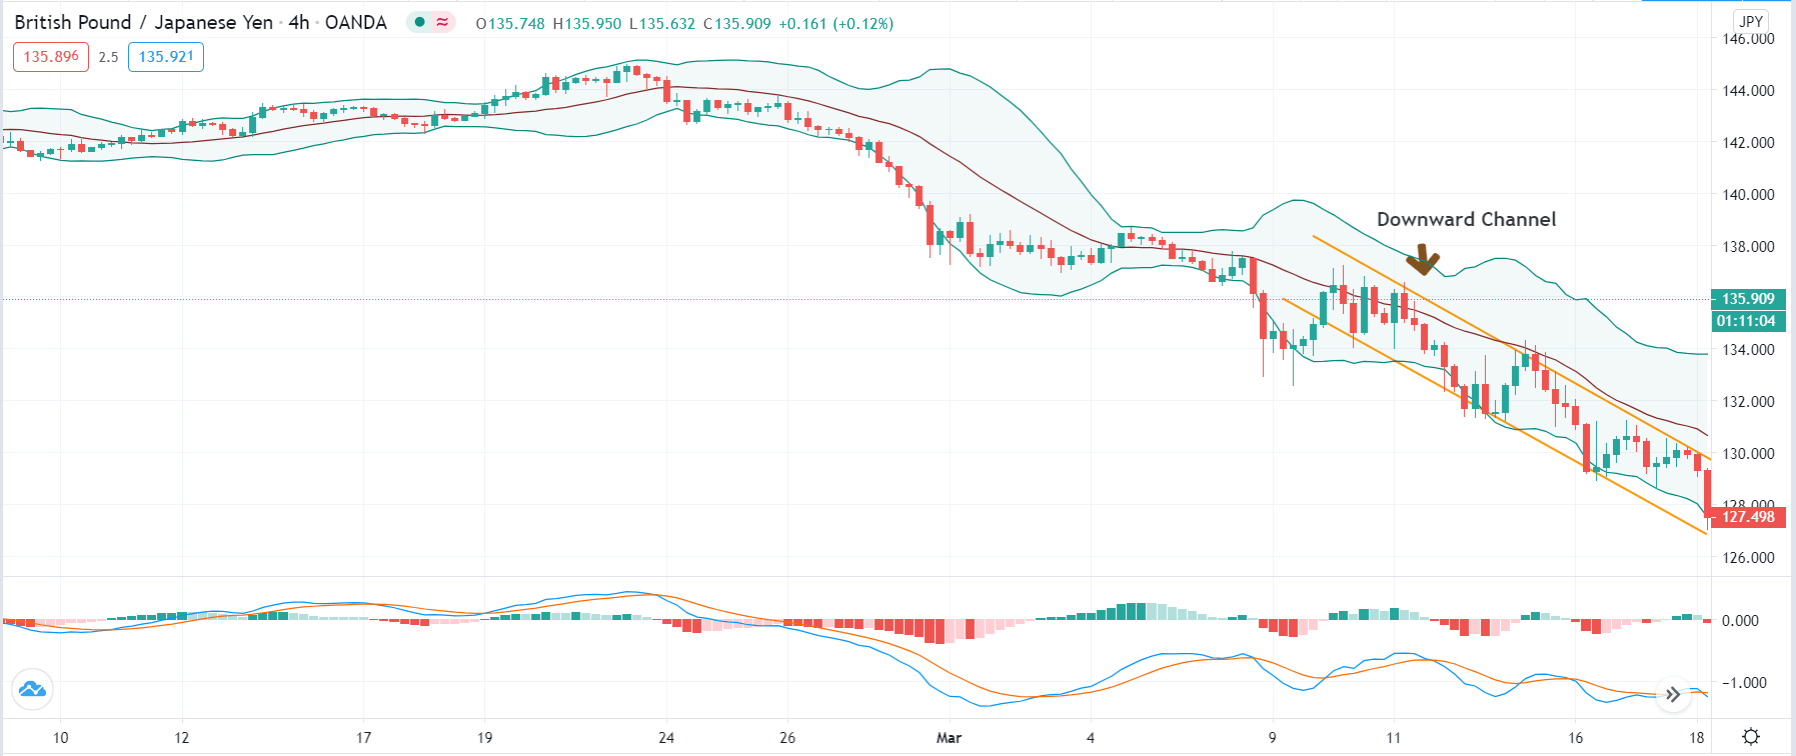
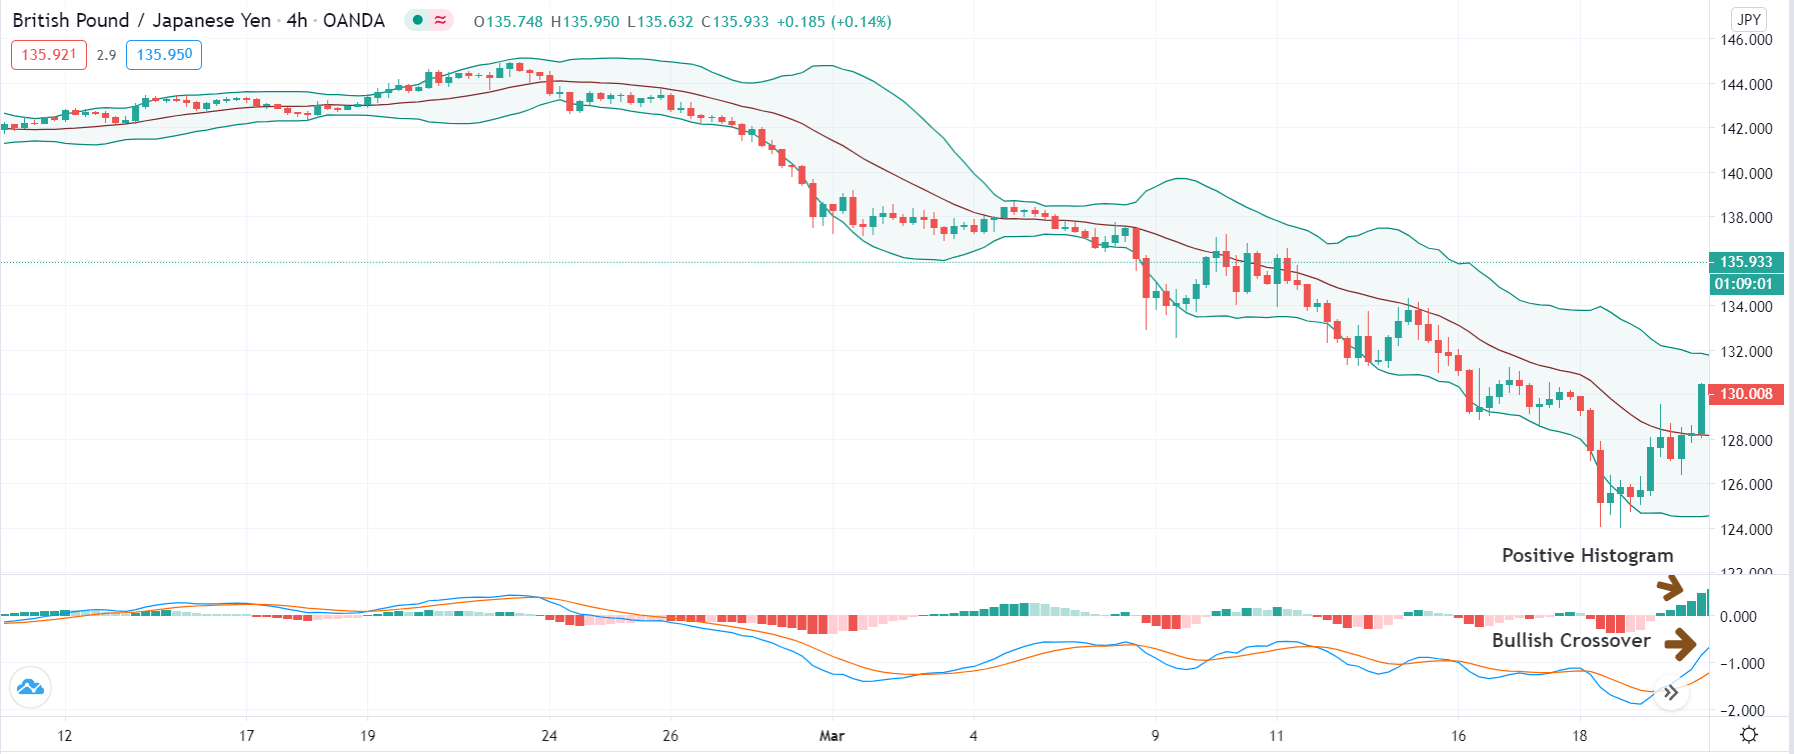
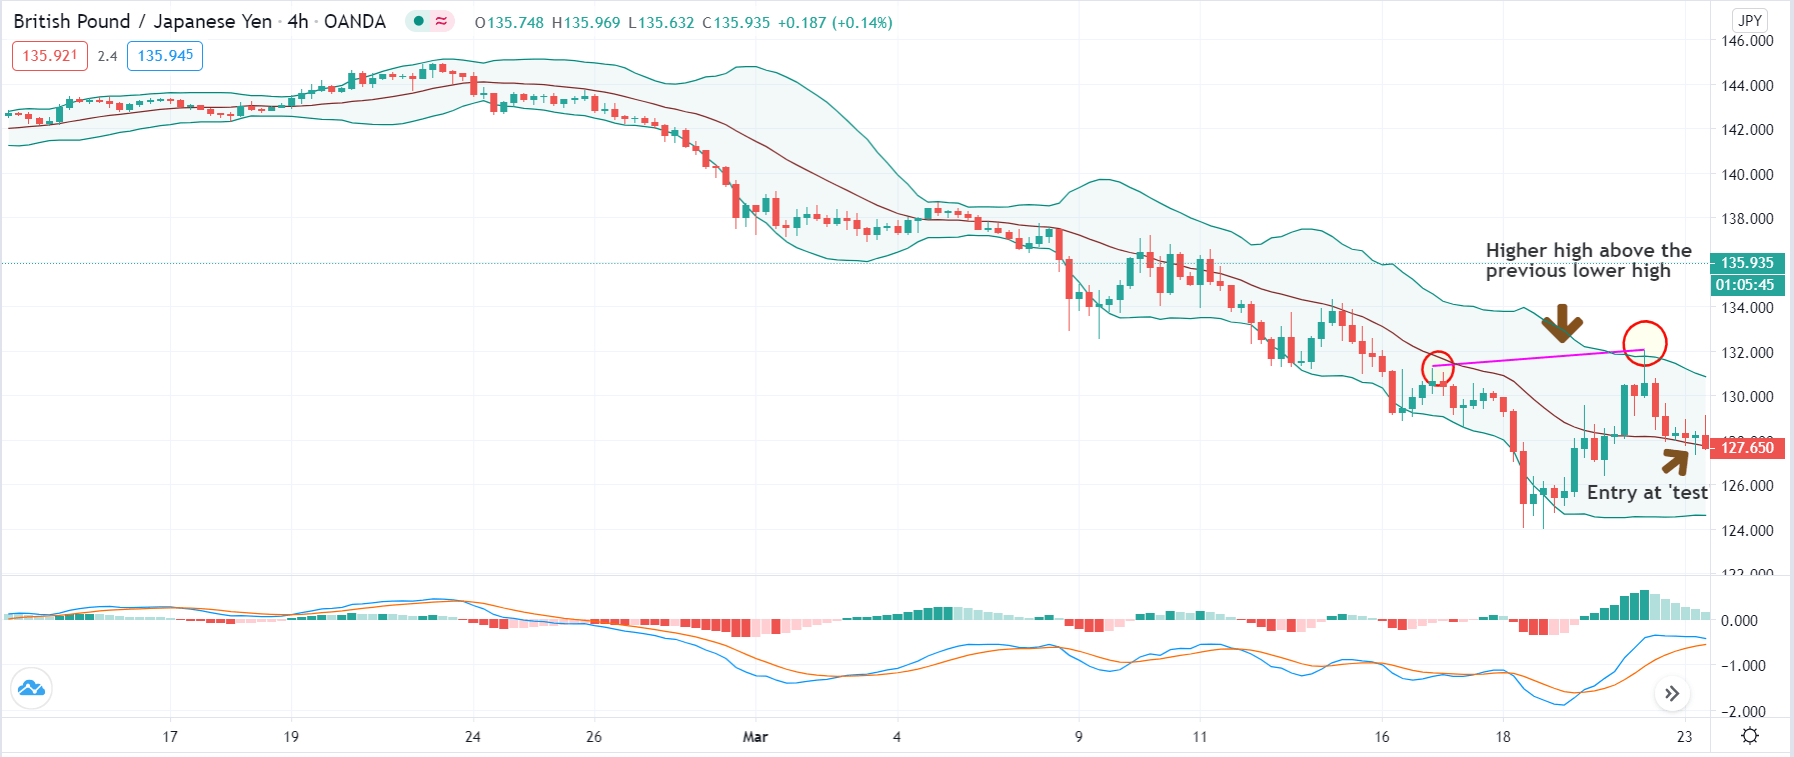
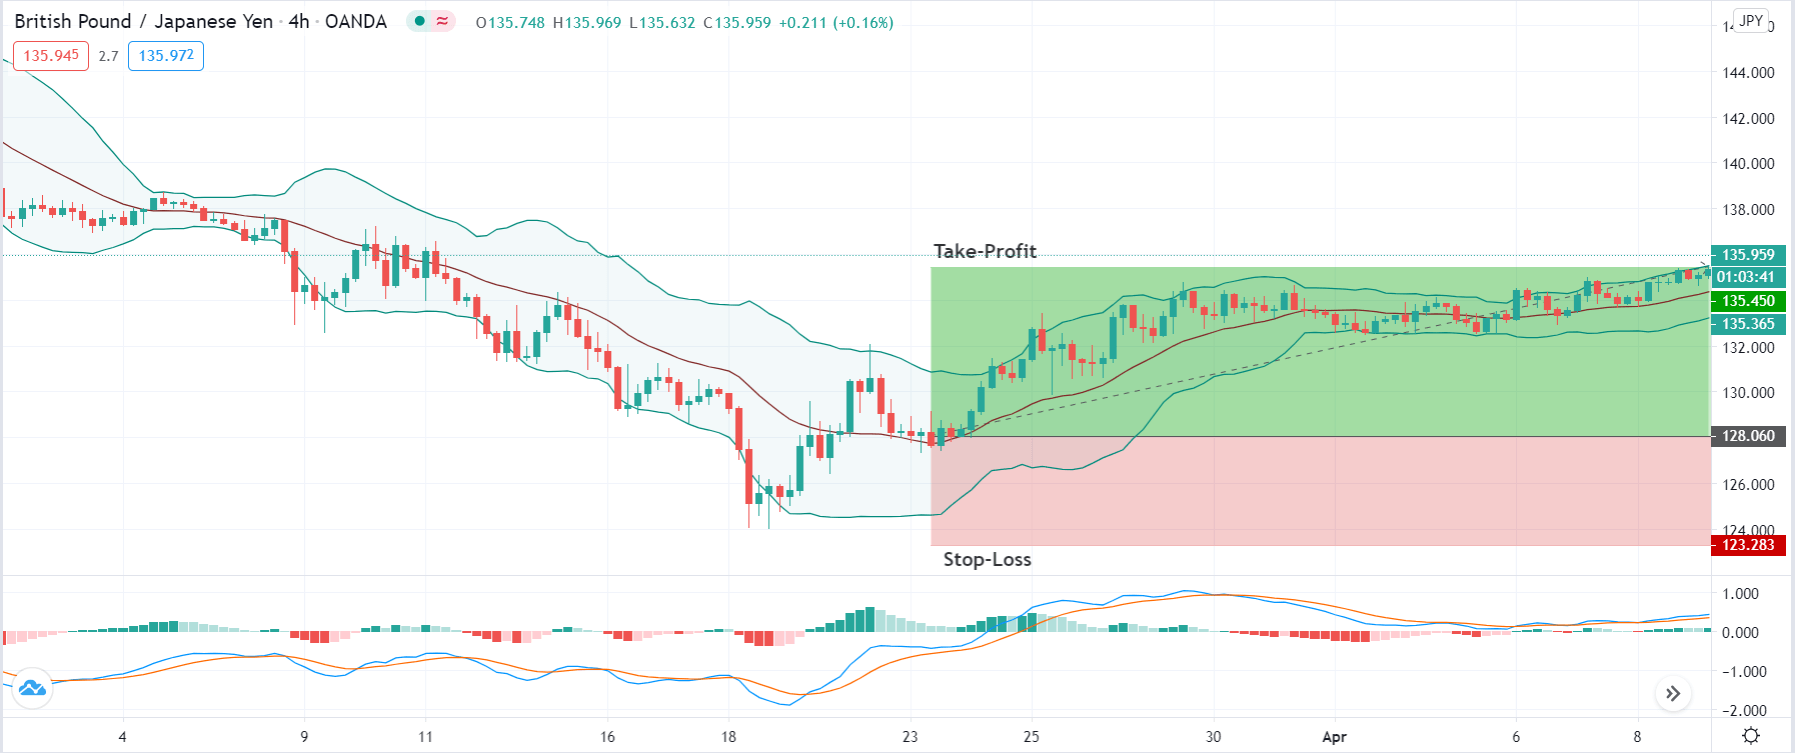
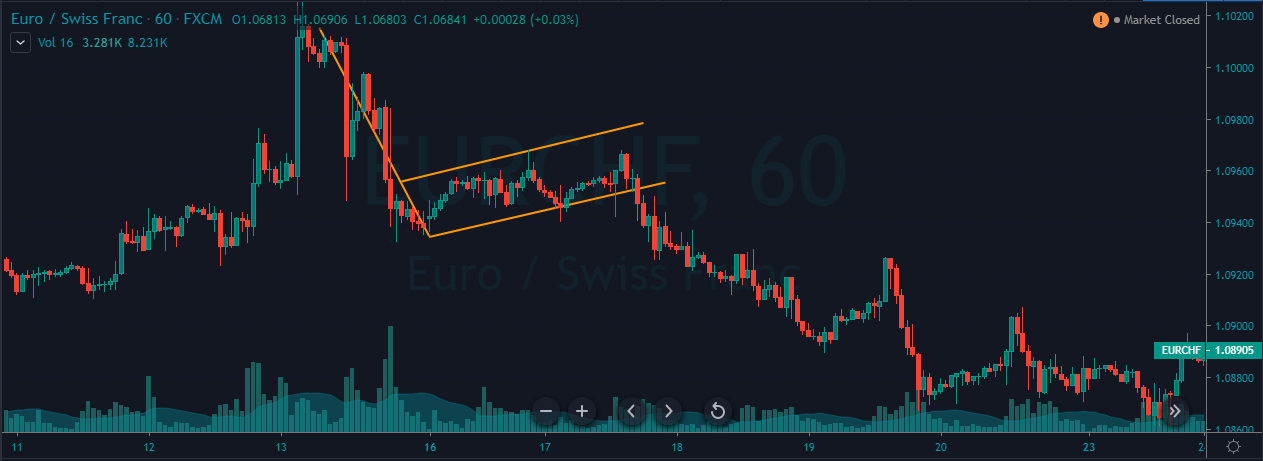
Time, something that forex trading needs a lot of, and there are a lot of different things that you can be spending your time on. So much so that you are most likely leaving certain things out. For many, that thing would be the creation of their strategy. Either you are spending too much time on other things, or you simply just want to get started with your trading. Either way, you won’t be spending enough time on your strategy, getting it right and so this can lead to some negative results. Today, we are going to be looking at some of the reasons why you should be spending just a little more time on your strategy.

Create It

The first step for any strategy is to simply create it. Depending on the strategy it can take a different amount of time to create. Some will take a few hours, others may even take a few days to create. You need to look at what you are planning to trade, when you are planning to trade it, and also how much free time you have, as this will affect the type of strategy that you can use. You need to take your time when creating it, do not rush it, the last thing that you want is a half-complete strategy, you won’t get any success from that. So take as long as you need in order to ensure that your strategy is working and is suitable for the current trading conditions.

Learn It Inside Out

There is absolutely no point in only learning the bare bones of the strategy that you are planning on using. Instead, you need to learn everything that there is to know about it, for a number of different reasons. You need to know what the training rules are in order to know when you should be putting on trades and when you should be avoiding trades. Knowing which market conditions work well for it and which ones do not. You need to learn the limitations and what the strengths are of the strategy. Ensure that the first thing that you do is learn what there is to know about it before you even consider starting to put on trades.

Learn How to Adapt It

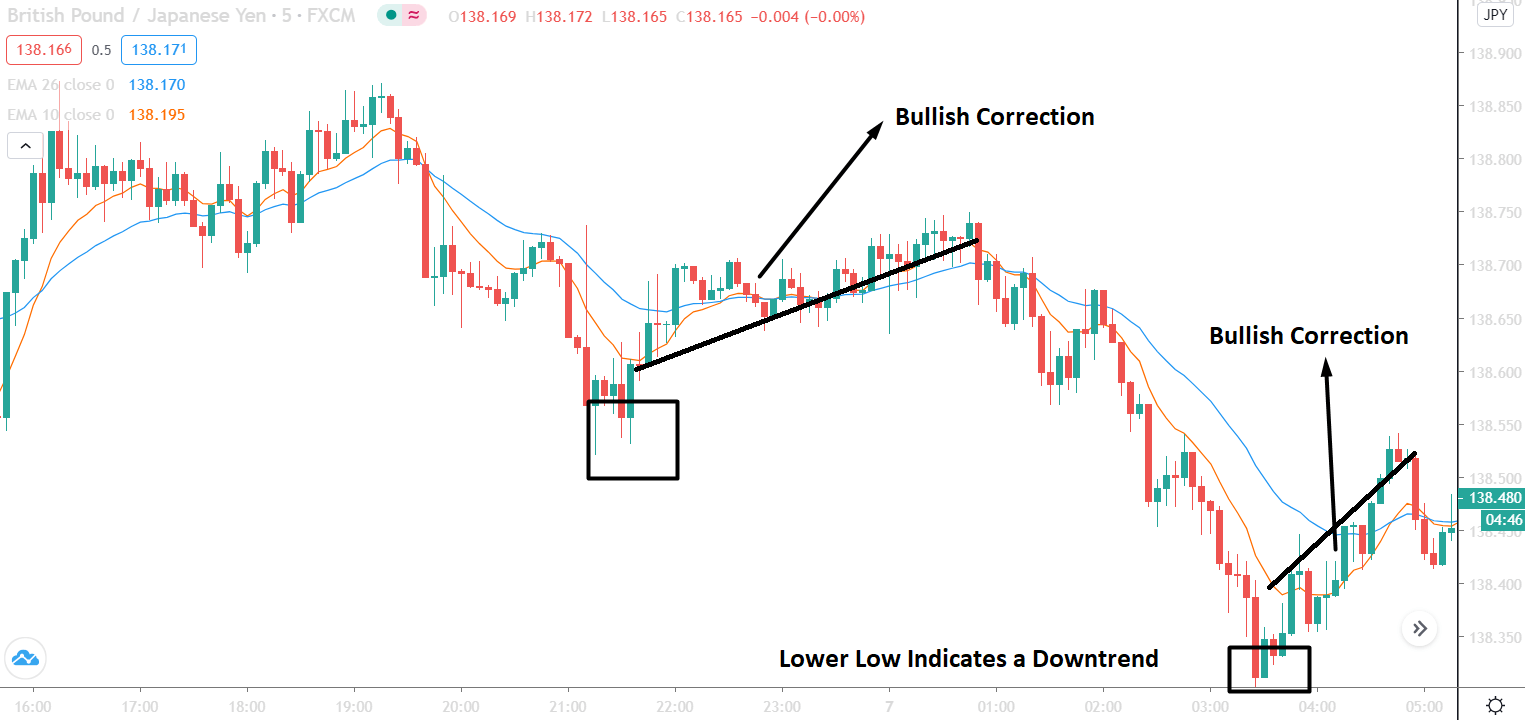
Let’s be honest, sometimes a strategy works brilliantly, the markets are working for you and each trade that you put on is doing well, but that isn’t going to last forever. It never will because the markets will always be changing. Due to this, you need to have a good understanding of how you can adapt the strategy that you are using. In order to do this, you will need to spend a little extra time looking at different contingencies. If you do not do this, then as soon as the markets change, you will struggle to make profitable trades as you do not know how to adapt the strategy and so stick to the older rules that were previously working before. So spend that extra time on your strategy to work out how you can make small and subtle changes to keep up with the ever-changing markets.

Learn More Than One Strategy

There will be times during our trading career when we believe that we have learned all that there is to learn when it comes to the strategy that we are using. That is great, but that doesn’t mean that there is nothing else for you to learn. Your strategy may work well in certain conditions, but it won’t work in all of them. So in order to combat this, we need to start thinking about learning a second strategy too. This will give you a lot more variation in your trading. It will give you better insights into how you can trade and will also let you trade when your other strategy would not work well. You never know, it may also help you to learn a little bit more about the strategy that you are already using or to look at it from a different point of view, giving you the opportunity to improve it further than you thought you could.

Never Stop Learning

We have covered this a little bit above, but the fact is that you will never actually stop learning about your strategy or even new strategies. You should never get into the mindset that you are always able to learn more and always able to improve. As soon as you begin to get complacent, that is where the problems often start. Never sit back and believe that you know it all, consider looking into new aspects of trading which could then give you better insight into your own strategies.
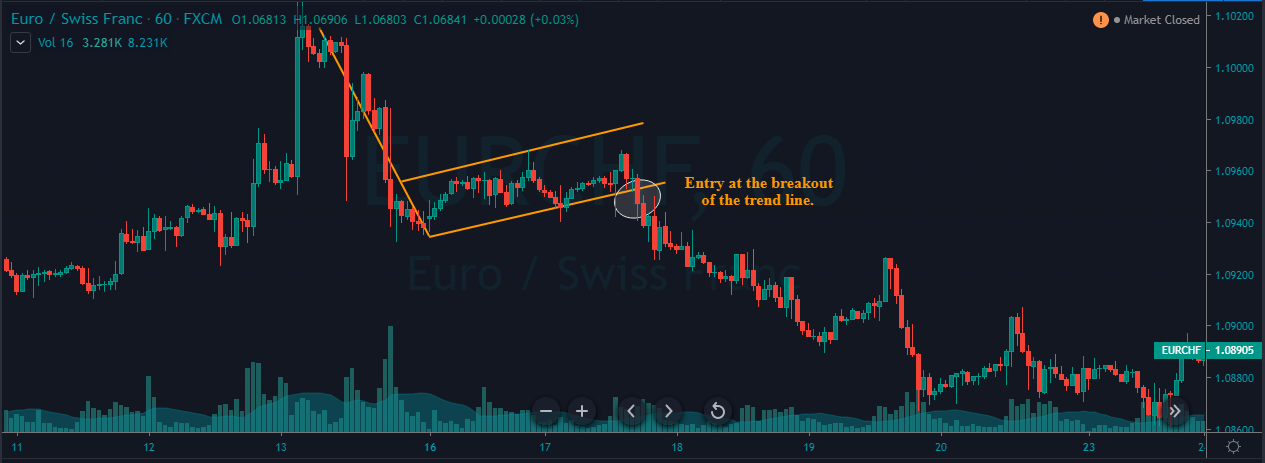
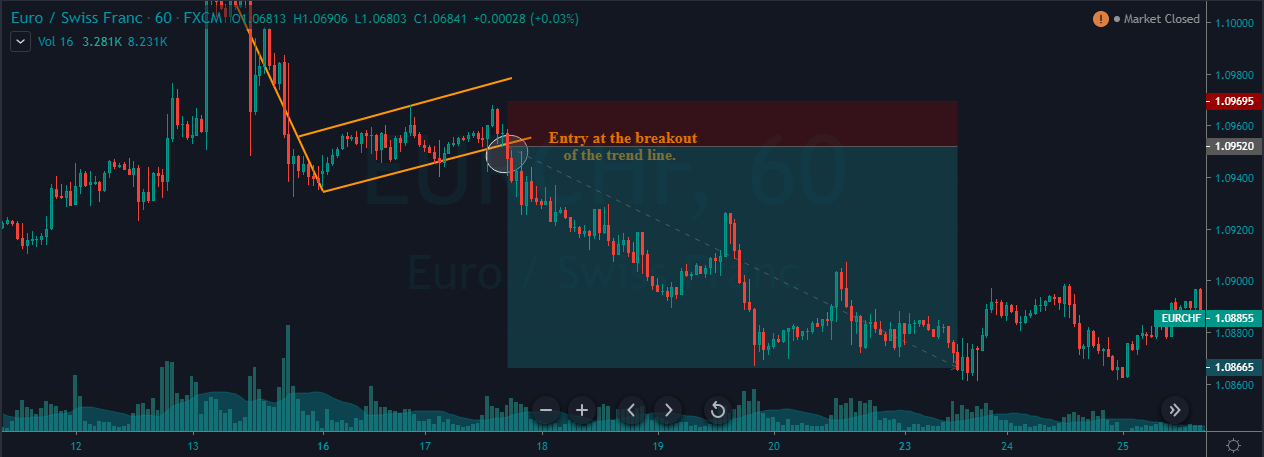
Stay Vigilant

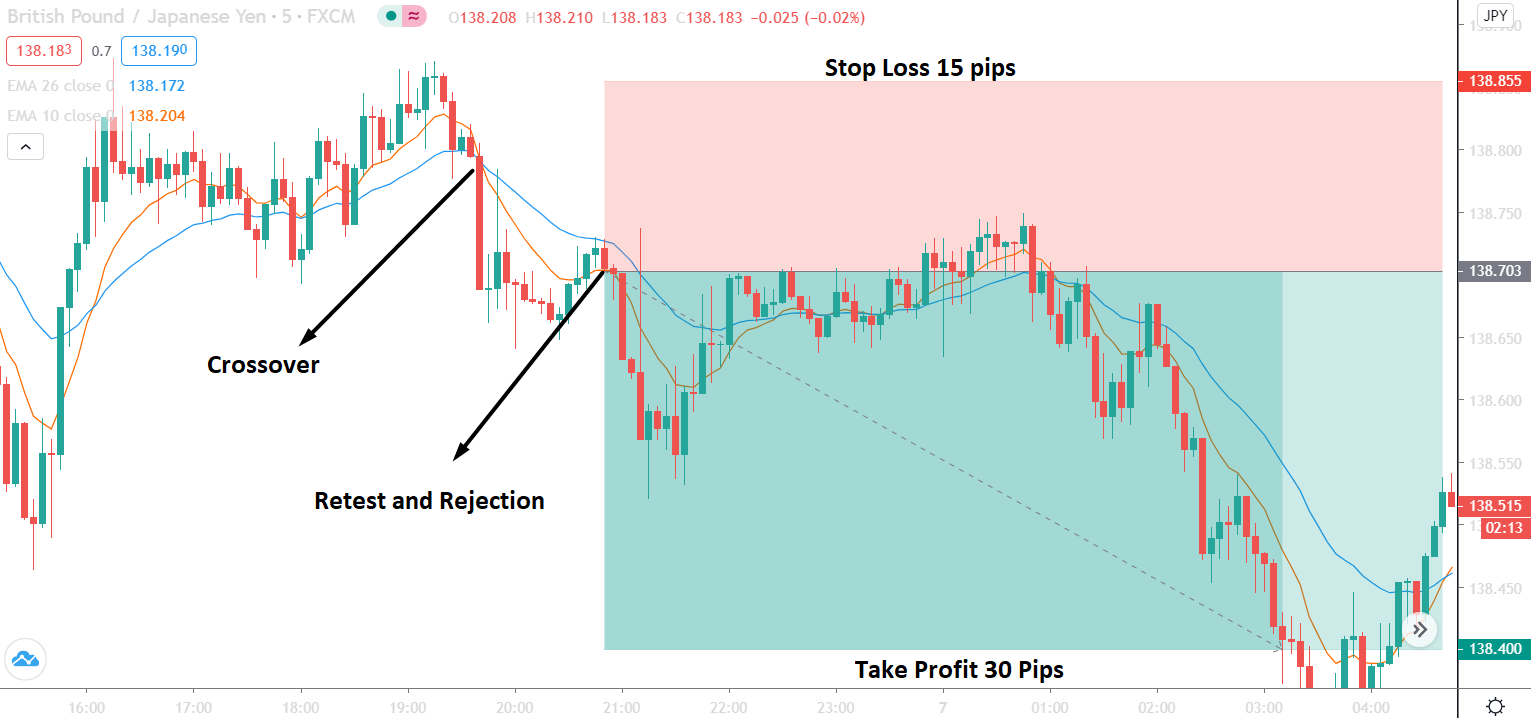
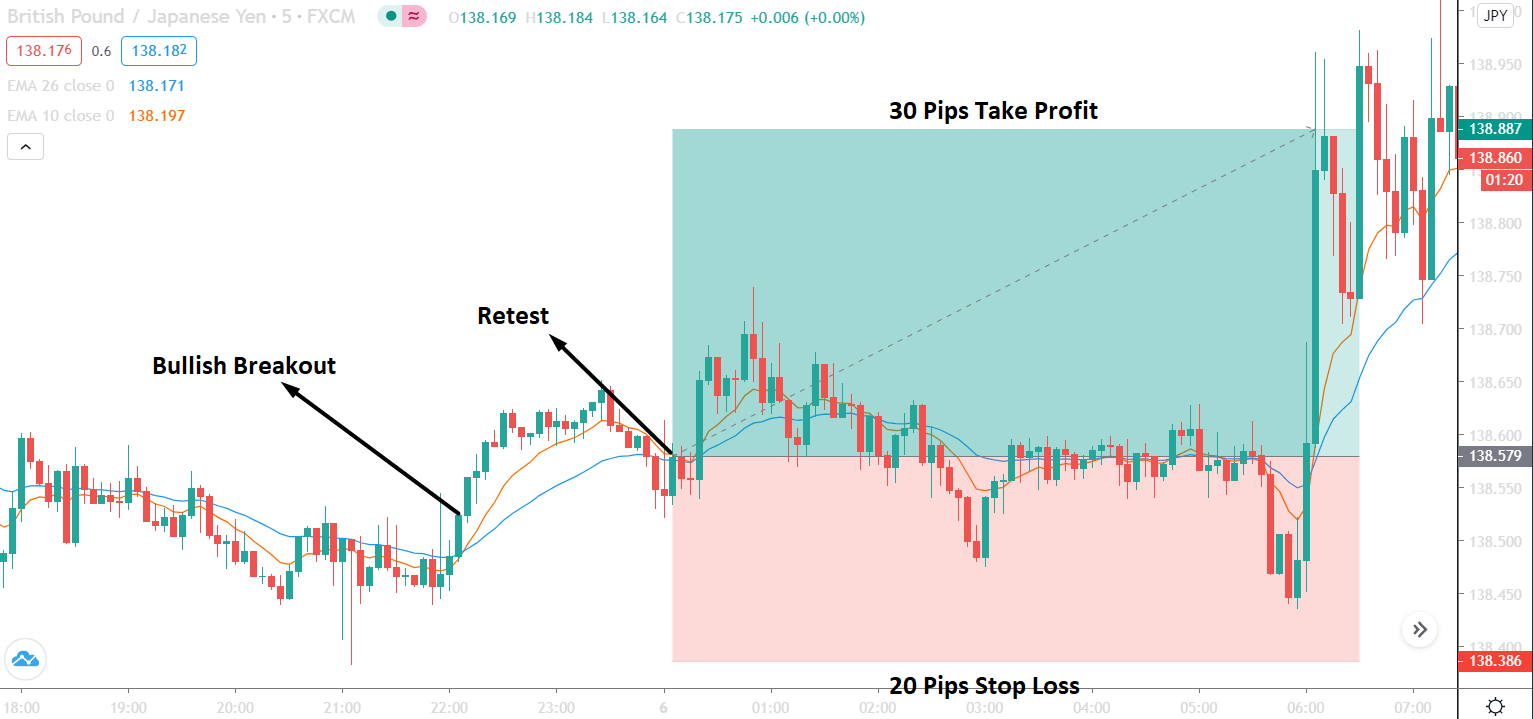
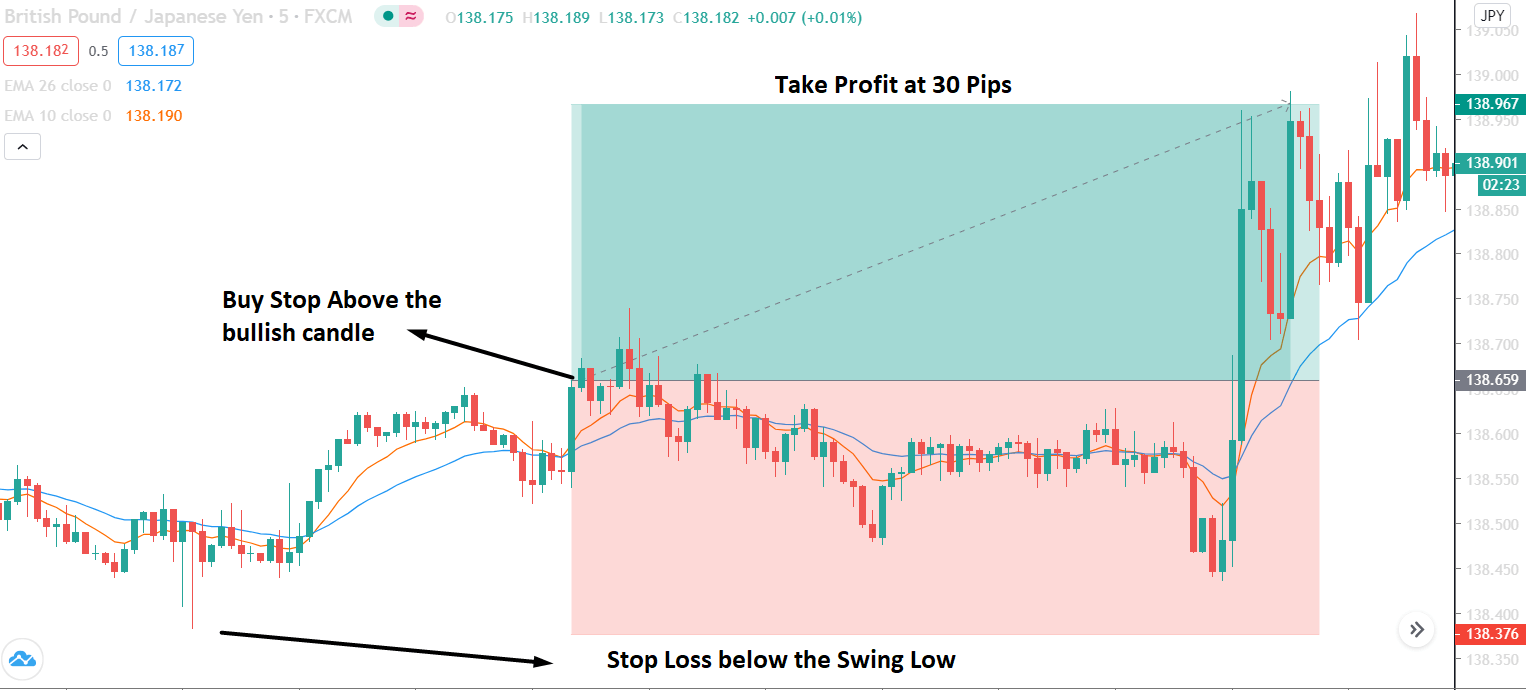
You will need to remain vigilant on things like your trading rules. We have set those rules for a reason. They are there to give us an idea of when we should be trading, what we should be trading, and when we should be getting out of trades. The rules are there to be followed and so we should stick to them as much as we can. When we go against those rules then we are placing what would be considered bad trades. We need to spend that little extra time making sure that we are placing the right trade, it may add an extra few seconds or minutes to each trade but the overall results will be worth it, ember, those rules are there for a reason.

Always Adapting

Once your strategy has been created, that is not the end. You will always need to continue to adapt and change little parts of it. The market conditions will be constantly changing, and so you will need to adapt to it. Most strategies have the capabilities of working within different trading conditions, changing parts to better suit them. You will only be able to do this by knowing the strategy inside out and by spending a little extra time to work out what it is that you need to change in order to adapt it and how you can maintain the strategy’s profitability.

So those are some of the reasons why you should be spending a little more time working on our strategies. You don’t have to stick to one once you believe you have mastered it, but you should also remember that you have never learned everything that there is to know about the strategy that you are using. Spend some time developing it, but then also make sure that you spend some time following it too.

Categories
Forex Trading Strategies

Ways to Completely Sabotage Your Trading Strategy: Part 1

If you are so keen on wiping your account off the map, you are welcome to follow this new series of articles that comprise expert opinions on harmful trading habits and practices. Today, we present you with a thoughtful collection of our favorite mantras for master trading account demolition.

Yes, you read that right. These are really some of the best ways to stop trading in record time. And, today we are giving special attention to the best of the best – the very gem that possibly consumed the most souls. Meet the number 1 strategy sabotage and take your pen out – you will need it.

  • Part 1: Don’t Have a Trading Plan

Ok, ok. We’ve got you. You have your system set up. Your algorithm is there, waiting to be used. You’ve searched the internet countless times and you are ready to hit the jackpot. You could just go on and guess your next move. Bring on the adventure and the suspense!

Oops! You forgot something. Or….did you not? 

Well, it all depends on what you want to achieve.

We’d say that you may want to stay and finish this article if you really want to see how sabotage works at its finest. By the way, did you know that the word sabotage actually first meant to deliberately and maliciously destroy property

Anyway, let’s start with trading and money management biggest slips.

  • Taking action just because there seems to be movement

Traders love this one. They recognize that some action is taking place in the chart and they want to be in the zone right now, naturally without a specific plan. Expectations build up, creating a false sense of courage, and disappointment typically ensues.

The slip: Traders lack insight into the market’s nature and the skills to plan their actions. 

Corrective measure: Wait for an actual trend or a move that is worth the risk you are about to take on and knowing when to get out.

  • Not showing any inquisitiveness

Many beginners tend to take bits and pieces from different websites and/or social media pages before ever showing curiosity towards why different strategies exist and what their purpose is. Then, when their strategy renders poor results, they still don’t see the point in trying to understand what went wrong.

The slip: Many people don’t understand the value of being eager to learn and how a deeper understanding of things actually gives perspective, power, and confidence.

Corrective measure: Understand why your results do not match your initial expectations. Practice discipline in notetaking before and after every trade. Eliminate loss drivers first. Keep upgrading your strategy.

  • Embracing inconsistency everywhere

Traders often fail to see the bigger picture. They have a desire to earn a few pips here and there and they think that the sole knowledge of how to use MT4 is sufficient to get them where they want to go. Alas, strategy entails much more.

The slip: Traders have no idea what to do in every step of the trade they entered.

Corrective measure: If you plan your entry and exit points properly, you will be able to go long or short in the best possible spot. 

  • Implementing a “one size fits all” approach

After much studying, a lot of traders think that they finally get everything, so what they do is use the exact same approach for every single trade they are in.

The slip: Traders miss the point of money and trade management. When conditions are different, they still hope to get a good result with the same formula.

Corrective measure: Professionals say that if volatility levels and the time frames you are using are different for the trades you are currently in, you cannot have the exact same stop loss. You need to be adjustable, not rigid.

  • Chasing losses

Traders often fall for this trap. They feel angry with themselves and they want to make it up for the losses that they took. 

The slip: Traders think that because a trade started to go against them, they can just tweak the settings a little bit, make some changes here and there, move their stop losses as they please and the trade will finally respond to their commands.

Corrective measure: You must never make changes in the middle of trading, particularly in terms of moving your stop loss (not related to trailing stop). You may feel insecure when you see that something is not working, but if you have a plan to fall back onto, you will also be able to compare results and optimize it later.

  • Capping your upside

Some experts loudly oppose the strategy where 1:2 or 1:3 Risk/Reward ratios are used to enter a trade and then exit only when your trade well exceeds your stop loss. They believe that, this way, traders only limit their potential to earn a higher return.

The slip: With this strategy, you will miss high-yield trades that matter to the year-end line.

Corrective measure: Traders should strive to be a part of long runs where a trade can go from 1000 to 1500 pips in one go (trends seizing). This ratio strategy will prevent you from getting these big wins. While small wins are there to offset your losses, big wins are those that go directly in your pocket, professionals say.

  • Seeing success as every win you make

A lot of traders think that being a good trader is getting one win after the other. However, this is not entirely true. 

The slip: Traders forget that trading is very much about protecting the account from losses. If one’s strategy is only aimed at winning, the losses they take may overpower and outgrow all their wins.

Corrective measure: Build your strategy so that you limit the losses. Track your net gain and loss as shown in the table below, delete the losses as you improve the strategy without cutting the winners too, if possible.

So, what do professionals advise novice and underachieving traders to do?

How can we limit the losses and ensure winning?

No. 1 Advice

First of all, you must set a stop loss and take profit. Instead of capping your trades as a form of protection, you can take half of the winning trade off the table and keep the remainder running. Move your stop loss to break even and add a trailing stop as well.

What’s the benefit, you may be wondering.

This way, you will no longer be asking whether you are going to win – you are now free. You can only wonder how much you are going to win. Even if any trade goes against you, you will earn at least half, which is still better than capping the upside, experts suggest. 

Success Factors

There are two conditions you need to meet for any trading plan to reap benefits:

  • Write your trading plan step by step 
  • Follow it religiously

This is important because, if you don’t respect your plan, you will end up trading by feel, which is something we will be discussing in the next article of this series.

The thing is…great traders are not just born. They gradually work towards becoming one. 

They invest in understanding what works best along with learning more about themselves. Don’t forget that you – your personality and habits – also make an essential component and a determining factor of your success. See you next time where you will learn another set of perfect ways (not) to completely sabotage your trading strategy.

Categories
Forex Basic Strategies

Generating Profitable Forex Signals Using The ‘Indicator-Price Action’ Combo Strategy

Introduction

Few strategies discussed previously focussed on chart patterns and indicators. Now let us a strategy that is based on two of the most powerful indicators in technical analysis. We already know how to trade using these indicators separately. But using any technical indicator in isolation will not generate a great amount of profit.

Therefore, it becomes necessary to combine at least two indicators and use them in conjunction to produce signals. In today’s article, we not only combine two indicators but also provide a price action edge to it that will make this one of the best strategies of all time. This particular strategy gives traders an insight into both volatility and momentum in the forex market.

The two indicators we will using are Bollinger Band (BB) and MACD. Using the two indicators together can assist traders in taking high probability trades as they gauge the direction and strength of the existing trend, along with volatility. Let us find out the specifications of the strategy and how we imbibe concepts of price action here.

Time Frame

The strategy is designed for trading on longer-term price charts such as the 4 hours and ‘Daily.’ This means the strategy is suitable for the swing to long-term traders.

Indicators

As mentioned earlier, we use Bollinger Band and MACD indicators in the strategy with their default settings.

Currency Pairs

We can apply this strategy to both major and minor currency pairs. However, pairs that are not volatile should be avoided.

Strategy Concept

In this strategy, we first identify the trend of the market and see if the price is moving in a channel or not. When looking for a ‘long’ setup, the price must move in a channel below the median line of the Bollinger band. The lesser time price spends above the median line of the Bollinger band better for the strategy.

The reason behind why we chose to have the price below the Bollinger band is to verify that the price is moving into an ‘oversold’ zone. When price moves into the zone of ‘overbought’ or ‘oversold,’ it means a reversal is nearing in the market. Similarly, in a ‘short’ setup, the price should initially move in an upward channel above the median line of the Bollinger band. This indicates that the price is approaching an ‘overbought’ area.

The MACD indicator shows when a true reversal is taking place in the market. The histogram tells about the momentum and strength of the reversal. Depending on the level of the bars, we ascertain the strength of the reversal. Not only is the strength of the reversal important, but also the ’highs’ and ‘lows’ it makes. Once price crosses previous highs and lows, we enter the market at an appropriate ‘test.’ Let us understand in detail about the execution of the strategy.

Trade Setup

In order to execute the strategy, we have considered the 4-hour chart of the GBP/JPY pair, where we will be illustrating a ‘long’ trade. Here are steps to execute the strategy.

Step 1: Firstly, we have to identify the trend of the market. In a ‘long’ trade setup, we need to look for series of ‘lower lows’ and ‘lower highs’ below the median line of the Bollinger band, and in a ‘short’ trade setup, we need to look for series of ‘higher highs’ and ‘higher lows’ above the median line of Bollinger band. When this is confined in the channel, the trend becomes very clear, and reversal can easily be identified.

Step 2: We say that an upward reversal has taken place when we notice a bullish crossover in MACD along with a positive histogram. While in an uptrend, we say that a reversal has occurred when we notice a bearish crossover in MACD along with a negative histogram. Once reversal becomes eminent in the market, it is necessary to confirm that the reversal is ‘true,’ and thus, we could take a trade in the direction of the reversal.

The below image shows a downtrend reversal, as indicated by MACD.

Step 3: In this step, we should make sure that the price makes a ‘high’ that is above the previous ‘lower high,’ in an upward reversal. While in a downward reversal (reversal of an uptrend), the price should make a ‘low’ that is lower than the previous ‘higher low.’ When all these conditions are fulfilled, we can say that the reversal is real, and now we will look to trade the reversal.

We enter the market for a ‘buy’ or ‘sell’ when price ‘tests’ the median line of the Bollinger band after the reversal and stays above (‘buy’) or below (‘sell’).

Step 4: Finally, after entering the trade, we need to define appropriate levels of stop-loss and ‘take-profit’ for the trade. The rules of stop-loss are pretty simple, where it will be placed below the lowest point of the downtrend in a ‘long’ position and above the highest point of the uptrend in a ‘short’ position. ‘Take-profit’ will be set such that the risk-to-reward (RR) of the trade is at least 1:1.5. Once the price starts moving in our favor, we will put our stop-loss to break-even and extend our take-profit level.

Strategy Roundup

The combination of the Bollinger band and MACD is not suitable for novice traders. Since it involves complex rules and indicators, we need prior experience of using the indicators and charts before we can apply the strategy successfully. Traders should pay attention to every rule of the strategy to gain the maximum out of it. As there many rules and conditions, there is a tendency among traders to skip some rules, but it is not advisable.

Categories
Forex Basic Strategies

Learning To Trade The Forex Market Using ‘2-Period RSI’ Trading Strategy

Introduction

When we look for a trade setup, most of the times we do not have an idea of the strategy, we will be using for taking a particular trade. From there, we start to pick random indicators and start trading using those indicators without a proper strategy associated with that indicator. With our 2-Period RSI strategy, we will solve this confusion by looking at the market with a systematic approach that involves using the RSI indicator. In addition to the RSI indicator, we will also use a 20-period EMA. Most importantly, we will look to take trades in the direction of the main trend.

Now that we know what our goals are, we will look into the various parameters of the strategy and understand how to apply the same.

Time Frame

This strategy works well on the 5-minutes and 15-minutes time frame. This is a perfect intraday trading strategy.

Indicators

The strategy uses RSI as its major indicator. We also use the EMA for identification of the trend. Both the indicators are applied with their default settings.

Currency Pairs

This strategy is applicable to most of the currency pairs listed on the broker’s platform. However, illiquid pair should be completely avoided.

Strategy Concept 

The concept of the strategy is very simple if we have a clear understanding of the previously discussed strategy. The basic idea of here is to trade the retracement of an established trend. Therefore, the strategy can only be used when the market is trending. Once the trend has been identified, we wait for a ‘pullback’ in the price and then take an ‘entry’ in the direction of the market after a suitable confirmation. The Relative Strength Index (RSI) is an important indicator in this strategy which helps us in measuring the over-extended phase of the retracement.

A reading above 70 indicates an over-extended ‘up’ move while a reading below 30 indicates an over-extended ‘down’ move. In an uptrend, we will look for a retracement that is overextended, implying that the RSI should be below 30. While in a downtrend, we will look for a retracement that is overextended, implying that the RSI should be above 70. The crucial part of the strategy is that we don’t enter for a ‘buy’ or ‘sell’ soon after the RSI gives an indication, but instead wait for a sign of reversal that confirms the continuation of the trend.

Trade Setup

In order to explain the strategy, we will be taking a ‘long’ trade in the GBP/USD currency pair on the 5-minutes chart using the 2-period RSI strategy.

Step 1

The first step is to identify the major direction of the market. Many technical indicators help in identification of the trend, but the one that is suitable for this strategy is the EMA. We will identify the trend of the market using the 20-period EMA, which is best suited as per the conditions of the strategy.

In our example, we have identified an uptrend whose retracement shall be evaluated.

Step 2

Next, we need to wait for the market to turn from its highest or lowest point, depending on the trend, and then check if that is a retracement or a reversal. After the price starts to pull back, we wait until the RSI shows a reading below 30, in an uptrend and above 70, in a downtrend. Once that happens, we become alert and watch the price cautiously.

Step 3

Now we wait for the price to reverse and close above the 20-period EMA, in an uptrend and close below the EMA, in a downtrend. Ensuring this step is critical as it confirms the continuation of the trend. We enter the market with an appropriate position at the close of the candle. There are two ways of entering the market. One, wait for the candle to close and then enter. Second, enter at the crossing of the price above or below the EMA. The second approach is an aggressive form of ‘entry’ and is not recommended for everyone. There is also a conservative form of entry, that is entering at the re-test of the EMA.

In the below image, we can see that we are entering at the close of the bullish candle above the EMA. But since the candle is long and has a large body, the ‘entry’ price is much higher than what we were looking for.

Step 4

Finally, we determine the stop-loss and take-profit for the strategy. The stop-loss is placed below the ‘low’ from where the market reverses and starts moving higher in case of a ‘long’ trade. In a ‘short’ trade, it will be placed above the ‘high’ from where the market reverses and starts moving lower. Since we are trading with the trend, the ‘take-profit’ can be set at the new ’high’ or ‘low’ that will result in a higher risk-to-reward ratio.

In our case, the risk-to-reward ratio of the trade is just 1:1 since we took a late ‘entry.’

Strategy Roundup

We are making use of the RSI indicator in a most constructive way which helps us in identifying when the market is overbought or oversold. Using the concept of trends, we are applying the strategy to reduce risk and maximise gains. The rule for entering the market in this strategy is what stands out. We are entering only after getting clear signs of confirmation from the market. We can also trail our stop-loss and exit when we get signs of another reversal. This is an aggressive way of taking profit and is mostly done to increase the gains.

Categories
Forex Basic Strategies

Reliable Way To Make 30-Pips A Day In The Forex Market

Introduction

The 30 pips a day is a trading strategy that is based on market continuation pattern. This strategy is very profitable and has a long history of providing a substantial gain. Therefore, if you can implement this strategy well, you can make a decent profit from the forex market. This strategy is focused on a quick gain from the market; therefore, the currency pair that usually make a fast move is recommended for this strategy.

In this trading strategy, we will use the following elements:

  • 10 EMA and 26 EMA to identify the market direction. The main reason for using the Exponential Moving average over the simple moving average is that it provides the most reliable result in a short timeframe.
  • We will use 5-minute timeframe for trading as our focus is to make a quick gain from a short move.
  • We will implement the strategy in GBPJPY pair as it provides fast move in a short timeframe.

30 Pips a Day Trading System

In this trading strategy, we will consider the trend as an uptrend if the 10 EMA crosses the 26 EMA. Similarly, we will consider the trend as a downtrend if the 10 EMA crosses the 26 EMA. The reason for choosing the GBPJPY pair is that it has a higher daily movement compared to the other major currencies. GBPJPY pair can move 100-200 pips a day while most of the major currency pairs can move 60-100 pips a day.

However, our aim is not to catch every move during the day. Instead, we will focus on a little part of it, like 30 pips. That’s why the name of this trading strategy is 30 pips a day. In this trading strategy, the Potential Trading Zone is significant.

What is the Potential Trading Zone?

It is the zone where we will make trades based on our trading element. It is usually the reversal zone from where the price is likely to reverse from the current direction. Therefore, we will make the buying and selling decision at this zone depending on the current market trend.

In the above example, we can see that the major trend of the currency pair down. Despite the downtrend, the price will move up with a corrective speed, which is a minor counter-trend rally. In the 30 pips a day trading strategy, we will focus on the minor trend reversal movement and wait for the price to return to the major trend.

We can find the same market movement in the uptrend where the price will come down with a corrective speed. Later on, we will focus on the price zone from where the price is likely to resume its major trend.

Sell Setup Using the 30 Pips a Day Trading Strategy

  • Identify the major trend. If the primary trend is down, we will focus on sell trades only.
  • Find the location of price where 10 EMA crosses down the 26 EMA.
  • Do not sell immediately after the crossover. Wait for the price to make a retracement.
  • Enter the sell as soon as the candle crosses the potential trading zone halfway between the 10 and 26 EMA.
  • Stop-loss should be 15-20 pips.
  • Take profit should be 30 pips.

Example of 30 Pips a Day Sell Setup

In the above image, we can see that the 10 EMA crossed below the 26 EMA and moved up. The crossover is the first indication of sell entry. Later on, the trade setup comes as soon as price creates a bearish candle after a bullish rejection.

Buy Setup Using the 30 Pips a Day Trading Strategy

  • Identify the major trend. If the major trend is bullish, we will focus on buy trades only.
  • Find the location of price where 10 EMA crosses above the 26 EMA.
  • Do not buy immediately after the crossover. Wait for the price to make a retracement.
  • Enter the buy as soon as the candle crosses the potential trading zone halfway between the 10 and 26 EMA.
  • Stop-loss should be 15-20 pips.
  • Take profit should be 30 pips.

Example of 30 Pips a Day Buy Setup

In the above image, we can see that the 10 EMA crossed above the 26 EMA and moved down. The crossover is the first indication of buy entry. Later on, the trade setup comes as soon as price creates a bullish candle after a bearish rejection.

Alternative Trading Entry for 30 Pips a Day

  • If you don’t have enough time to manage your trade, you can simply use a pending order.
  • Once the candlestick comes back after the primary crossover, wait for a reversal candle to appear. Later on, place a buy stop or sell stop above or below the reversal candlestick.
  • You can place the stop loss above or below the candle high or low with some buffer. However, you can use the nearest swing points as a stop loss level also. Moreover, to take profit, you can set it to 30 pips.

Pros and Cons of 30 Pips a Day Trading Strategy

Like other trading strategies, 30 pips a day trading strategy has both strength and weakness.

Pros

  • As the GBPJPY pair is very volatile, it is straightforward to make 30 pips daily.
  • In a trending market, this strategy works well.
  • This strategy works well in Asian and London Session.

Cons

Summary

Let’s summarize the 30 pips a day trading strategy:

  • Identify the trending market in the GBPJPY pair.
  • Move to the 5-minute chart and identify a market where 10 EMA crosses the 26 EMA.
  • Wait for correction and enter the trade as soon as market rejects from the potential trading zone.
  • Set stop loss at 15-20 pips and take profit at 30 pips.

In every trading strategy, trade management is an important part. In the forex market, we anticipate the movement of various currency pairs and every pair moves in a different way. Therefore, if you face some consecutive losses, it is better to take a break from trading and enter the trade again as soon as the market starts to move as you expect.

Categories
Forex Basic Strategies

Best Way of Trading The ‘Rectangle Chart Pattern’

Introduction

The ‘Rectangle’ is a classical technical analysis pattern described by horizontal lines showing support and resistance levels on the price chart. This pattern resembles the concept of buying at A significant support level and selling at a predominant resistance level. The price can stay between the Rectangle pattern for a long time, or the pattern can be very small.

The appearance of this pattern implies that the supply and demand of the currency pair are in balance for an extended period. The price action finds resistance at the top of a rectangle and support at the bottom of a rectangle. The pattern can easily be recognized and confirmed after the formation of two highs and two lows. These highs and lows form two parallel lines above and below the price action. These lines act as a strong support and resistance levels to the price action.

Keep in mind that this pattern doesn’t have a bullish or bearish bias. It is a neutral pattern that shows both parties are holding an equal amount of power. Using this pattern, we can trade with the trend, or it can be used to trade the counter trend and reversals also. In short, the Rectangle chart pattern is both continuous and reversal as well. However, technical experts believe that using the Rectangle as a continuation pattern has higher odds of performing.

Trading The Rectangle Chart Pattern

Example 1

The Rectangle pattern can be easily found on the price charts, and it mostly appears on all the trading timeframes. The below chart indicates the formation of the Rectangle chart pattern on the AUD/NZD daily chart.

As discussed, there is no such thing as a bullish or bearish Rectangle pattern. When we find this pattern on any timeframe, all we need to do is to trade with the trend. We can also trade the Rectangle pattern, just like how we trade ranges.

The image below represents the same Rectangle chart pattern that is shown in the above figure but on the 240 Minutes timeframe. The orange box represents a couple of buy and sell opportunities, but we have decided only to trade this pattern with the trend. The green arrows represent our buying entry in the pair.

The below chart represents our entry and exit in the AUD/NZD Forex pair. The green arrow represents our entry in this pair, and the stop-loss is placed just below the orange box that represents the formation of this pattern. The placement of stop-loss depends on you. If you are an aggressive trader, place the stop-loss just below the entry, and the conservative traders must go for more profound stop-loss.

The take-profit placement is an art as we can exit our positions in many correct ways. You can make use of technical indicators to close the positions. When the trend loses its momentum, use the support, resistance area to close your positions. In the above example, we can see the reversed deeply as soon as we exited our position. This is because that is the place where the significant resistance line is.

Example 2.1

On the daily chart of the AUD/NZD, the below image represents the formation of two rectangle chart patterns in a downtrend.

The below image is the same rectangle pattern (1st) that is shown in the above chart but on a lower timeframe, which is 240 Minutes chart. Most of the time, we will find the Rectangle patterns in a trending market only. Also, this pattern represents the pullback phase of an ongoing trend. Another thing that a Rectangle pattern implies is that both of the parties hold equal power during the pullback phase. That is the reason for this pattern to form in the first place.

So be careful while trading this pattern because, in the consolidation phase, markets often throws a couple of spikes on the price chart. The safest way of trading this pattern is when the price action approaches at the upper area of the Rectangle. In the below chart, the Red arrow represents our selling trade in this pair.

The below chart represents our entry, exit, and risk management in this pair. The entry was at the top of the box. If you compare the stop-loss with take-profit, it clearly shows that we have opted for a smaller stop-loss, it was because the upper line of Rectangle acts as a primary resistance line. If the price action breaks the resistance line, the pattern by default gets invalid, and there is no need to hold our position. Around our take profit area, the price action started struggling, which indicates the power. Hence we decided to close our position.

Example 2.2

The below AUD/NZD Forex chart represents the formation of a Rectangle chart pattern on the 240 minutes chart. The pattern that you see below has appeared right after the previous trade that is discussed above. At times we will see these patterns consecutively, especially in a strong trending market. It is strongly recommended to go with the flow and trade them with confidence. The chart below shows that the price action spends some time in the rectangle box, and when it hits the bottom of the Rectangle, we activated our selling trade in this pair.

The chart below represents the entry, exit, and take-profit in this pair. As we can see, the entry was at the bottom of the Rectangle, and the stop-loss placement was above the Rectangle. For take-profit, we have waited for the sellers’ momentum to die out to close our trade.

Conclusion

For a Rectangle pattern to be valid, the price must have gone through at least two tops and two bottoms on the price chart. Always make sure to hold your trade till the market loses its momentum. You can also look for the formation of any candlestick patterns to exit the trades. If you activate your trade at the top of the Rectangle, make sure to place the stop-loss just above the Rectangle pattern. If the activation was after the breakout, place the stop-loss in the middle of the Rectangle range.

We hope you understood the trading of the Rectangle chart pattern. In case of any queries, let us know in the comments below. Cheers.

Categories
Forex Basic Strategies

Trading The Bullish & Bearish ‘Flag Pattern’ Like A Pro

Introduction

A Flag Pattern is one of the very well-known trend continuation patterns. Visually, this pattern looks like a flagpole and a flag, hence the name ‘Flag Pattern.’ A flagpole is printed by the sharp price upward move, followed by the symmetrical pullback, which forms the flag on the price chart of any underlying currency pair. When the flag breaks the trend line, it triggers the next trend move of an underlying asset. In simple words, flag forms when price action turns sideways after the sharp upward movement. This pattern can be seen on any timeframe; however, it is mostly found on lower timeframes such as 15, 5 or 3-minute chart.

Flag patterns can be both Bearish & Bullish

Bullish Flag Pattern

The bullish flag pattern starts with a strong upward move. This move implies that the sellers are entirely off guarded as the buyers took over the entire show. Eventually, the price action peaks, and it prints a pullback. The higher high and lower low of the pullback will be parallel to each other. This action results in the formation of a tilted rectangle. This whole process appears like a bullish flag pattern on the price chart.

By placing the trend line at the upper and lower end of the pullback, we can observe the diagonal parallel nature of that pullback. The breakout of the upper trend line indicates that the trend is ready to resume, and that is the best time to activate an extended position.

Bearish Flag Pattern

The bearish flag pattern is just the opposite of the bullish flag pattern that we discussed above. When the price action hits bottom, it prints the pullback where the lower low and higher high are parallel to each other.

The breakout of the lower trend line indicates that the trend is ready to resume, and it’s the best time to go short in any underlying asset.

Flag Pattern – Trading Strategies

Bull Flag Pattern Strategy

A Bull flag is a trend continuation chart pattern that indicates the likeliness of the market to move higher. (Uptrend Continuation)

Pattern Confirmation Criteria:

  • Find out a strong uptrend in any currency pair. In other words, the range of candles should be more bullish.
  • After the strong move, wait for the pullback to occur. A pullback is generally in the form of lower low and lower high. Here’s where we can expect to see a bull flag pattern on the price chart.
  • Draw the upper and lower trend lines on the price chart. When the price action breaks the upper trend line, it a sign to go long.

Here’s how the bull flag pattern looks like on price chart.

Entry – In the below NZD/USD Forex chart, we can see that the pair was in an overall uptrend. During the pullback phase, price action has printed the bullish flag pattern. The breakout of this pattern indicates a clear buy signal in this currency pair.

Stop-Loss & Take-Profit – When the price action breaks the upper trend line, it’s a sign to go long in this pair. The bull flag is quite a reliable pattern, so we can place our stop-loss just below the second trend line (lower part of the tilted rectangle). Placing the take-profit order is purely based on your trading style. If you are an aggressive trader, go for extended targets; but if you are a conservative trader, use smaller targets. In this particular trade, we closed our full position at one of the significant resistance areas.

Bear Flag Pattern Strategy

A Bearish Flag Pattern is also a continuation chart pattern, but it indicates the downward movement of the market. (Downtrend Continuation)

Pattern Confirmation Criteria:

  1. Find out a steady downtrend in any currency pair. In other words, the range of candles should be more bearish.
  2. After a strong move, wait for the pullback to occur. A pullback is typically in the form of a lower higher low and higher high. Here’s where we can expect the formation of a bearish flag pattern on the price chart.
  3. Draw an upper and lower trend line on the price chart. When price action breaks the lower trend line, it’s a sign to go short.

Here’s how the bearish flag pattern looks like on price chart.

Entry – In the below EUR/CHF 60 Forex chart, the overall market was in an uptrend. Then suddenly, sellers overwhelmed the buyers by printing a couple of strong red candles. If a bearish flag pattern appears on the price chart, we can confirm that the downtrend is going to continue. In the below picture, we can clearly see the formation of a bearish flag pattern. We can activate our sell positions as soon as the lower trend line breaks.

Stop-Loss & Take-Profit – In this trade, we must go for minimal stop-loss because the market is in a consolidation phase and not in a strong downtrend. We had closed our whole position when the price action started struggling to print a new lower low and lower high.

Bottom Line

The Flag pattern is always created by a swift up/down move, followed by the consolidation, which runs between the parallel lines. Always use the breakouts of the Flag pattern to take the positions.

Always remember that the trend is your friend. Take only buy trades in the appearance of a Bullish Flag and sell trades in the presence of a Bearish Flag.

Traditional ways suggest that the stop-loss must be set below the pole of the flag, but we don’t always have to follow this idea. While trading flag breakouts, the stop-loss just below the recent low is good enough.

In the Forex market, the flag pattern performs very well in active trading hours as most of the swift moves (like flagpole formation) occur in busy hours only. If you are a strict confirmation trader, let the price action to retest the trend line to activate your trades. This procedure will help you in picking the higher probability trades, although you’ll miss the higher-momentum moves that don’t pause to continue moving.