
Introduction
When we look for a trade setup, most of the times we do not have an idea of the strategy, we will be using for taking a particular trade. From there, we start to pick random indicators and start trading using those indicators without a proper strategy associated with that indicator. With our 2-Period RSI strategy, we will solve this confusion by looking at the market with a systematic approach that involves using the RSI indicator. In addition to the RSI indicator, we will also use a 20-period EMA. Most importantly, we will look to take trades in the direction of the main trend.
Now that we know what our goals are, we will look into the various parameters of the strategy and understand how to apply the same.
Time Frame
This strategy works well on the 5-minutes and 15-minutes time frame. This is a perfect intraday trading strategy.
Indicators
The strategy uses RSI as its major indicator. We also use the EMA for identification of the trend. Both the indicators are applied with their default settings.
Currency Pairs
This strategy is applicable to most of the currency pairs listed on the broker’s platform. However, illiquid pair should be completely avoided.
Strategy Concept
The concept of the strategy is very simple if we have a clear understanding of the previously discussed strategy. The basic idea of here is to trade the retracement of an established trend. Therefore, the strategy can only be used when the market is trending. Once the trend has been identified, we wait for a ‘pullback’ in the price and then take an ‘entry’ in the direction of the market after a suitable confirmation. The Relative Strength Index (RSI) is an important indicator in this strategy which helps us in measuring the over-extended phase of the retracement.
A reading above 70 indicates an over-extended ‘up’ move while a reading below 30 indicates an over-extended ‘down’ move. In an uptrend, we will look for a retracement that is overextended, implying that the RSI should be below 30. While in a downtrend, we will look for a retracement that is overextended, implying that the RSI should be above 70. The crucial part of the strategy is that we don’t enter for a ‘buy’ or ‘sell’ soon after the RSI gives an indication, but instead wait for a sign of reversal that confirms the continuation of the trend.
Trade Setup
In order to explain the strategy, we will be taking a ‘long’ trade in the GBP/USD currency pair on the 5-minutes chart using the 2-period RSI strategy.
Step 1
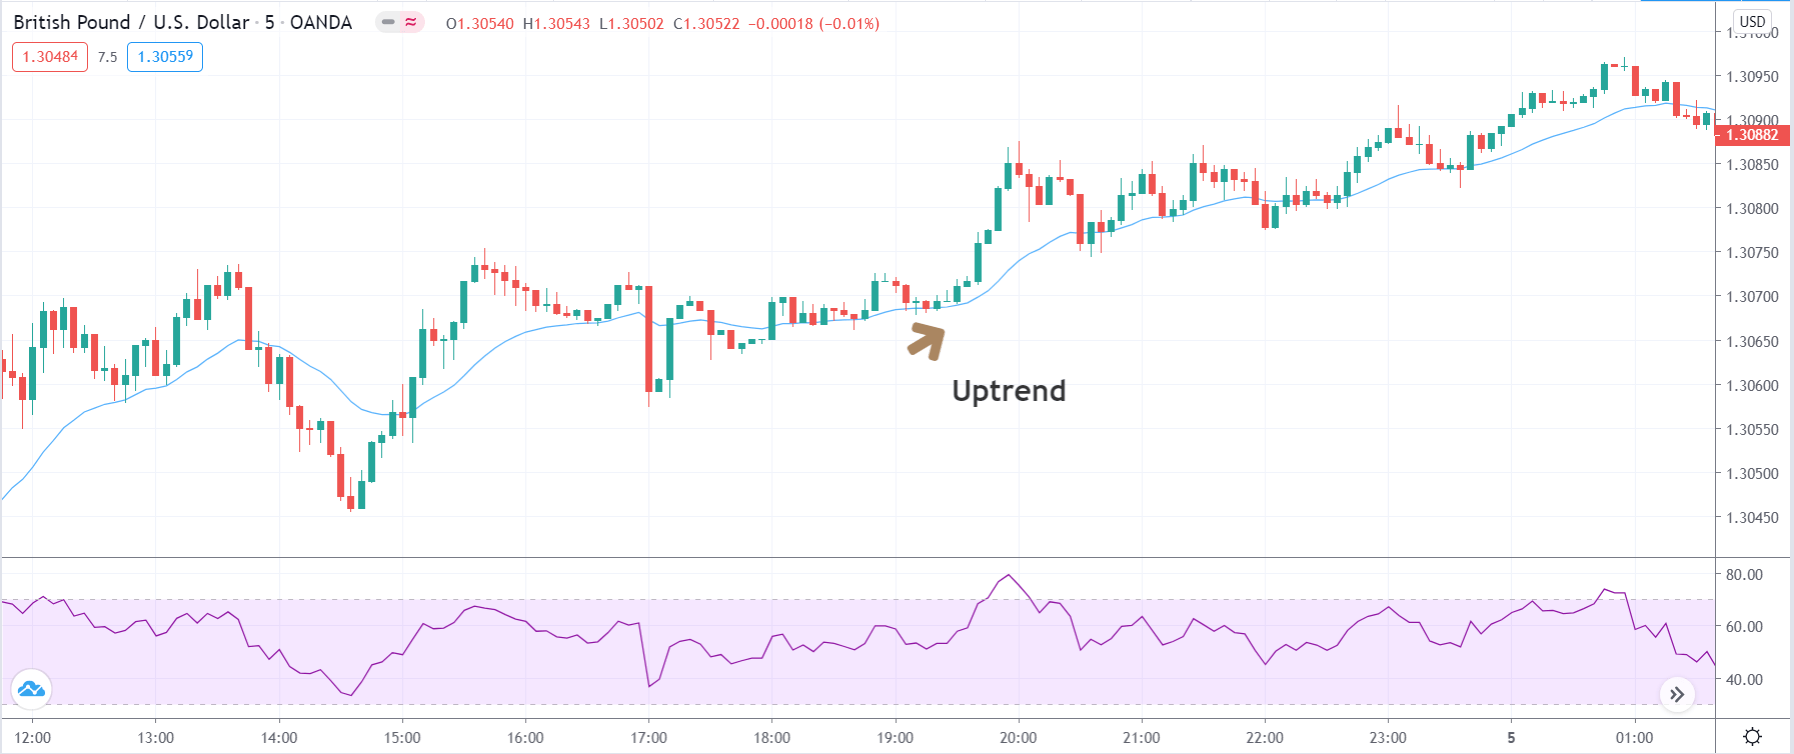
The first step is to identify the major direction of the market. Many technical indicators help in identification of the trend, but the one that is suitable for this strategy is the EMA. We will identify the trend of the market using the 20-period EMA, which is best suited as per the conditions of the strategy.
In our example, we have identified an uptrend whose retracement shall be evaluated.
Step 2
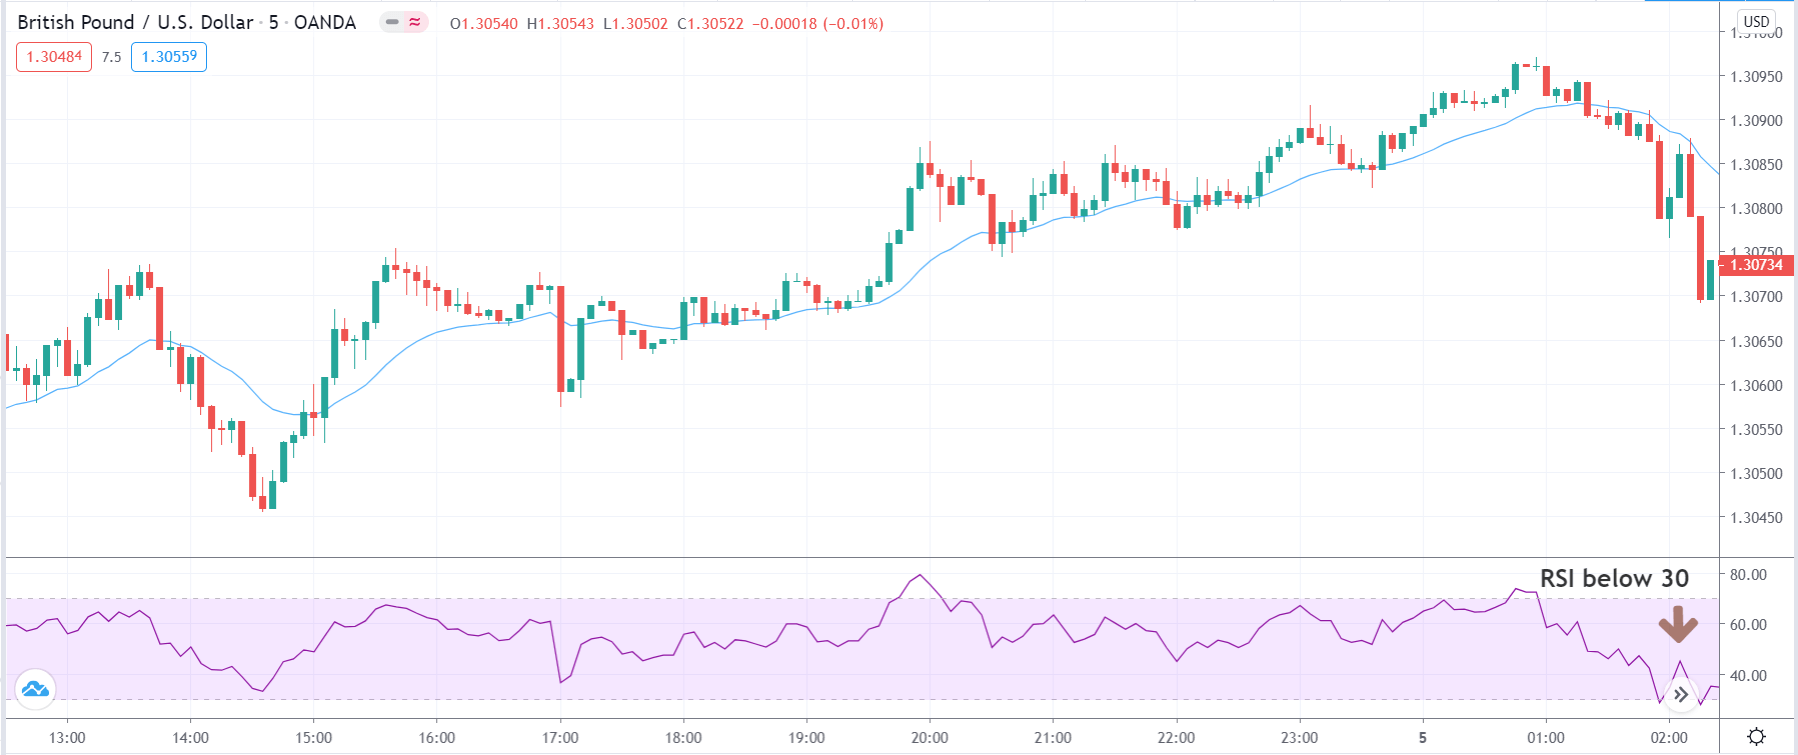
Next, we need to wait for the market to turn from its highest or lowest point, depending on the trend, and then check if that is a retracement or a reversal. After the price starts to pull back, we wait until the RSI shows a reading below 30, in an uptrend and above 70, in a downtrend. Once that happens, we become alert and watch the price cautiously.
Step 3
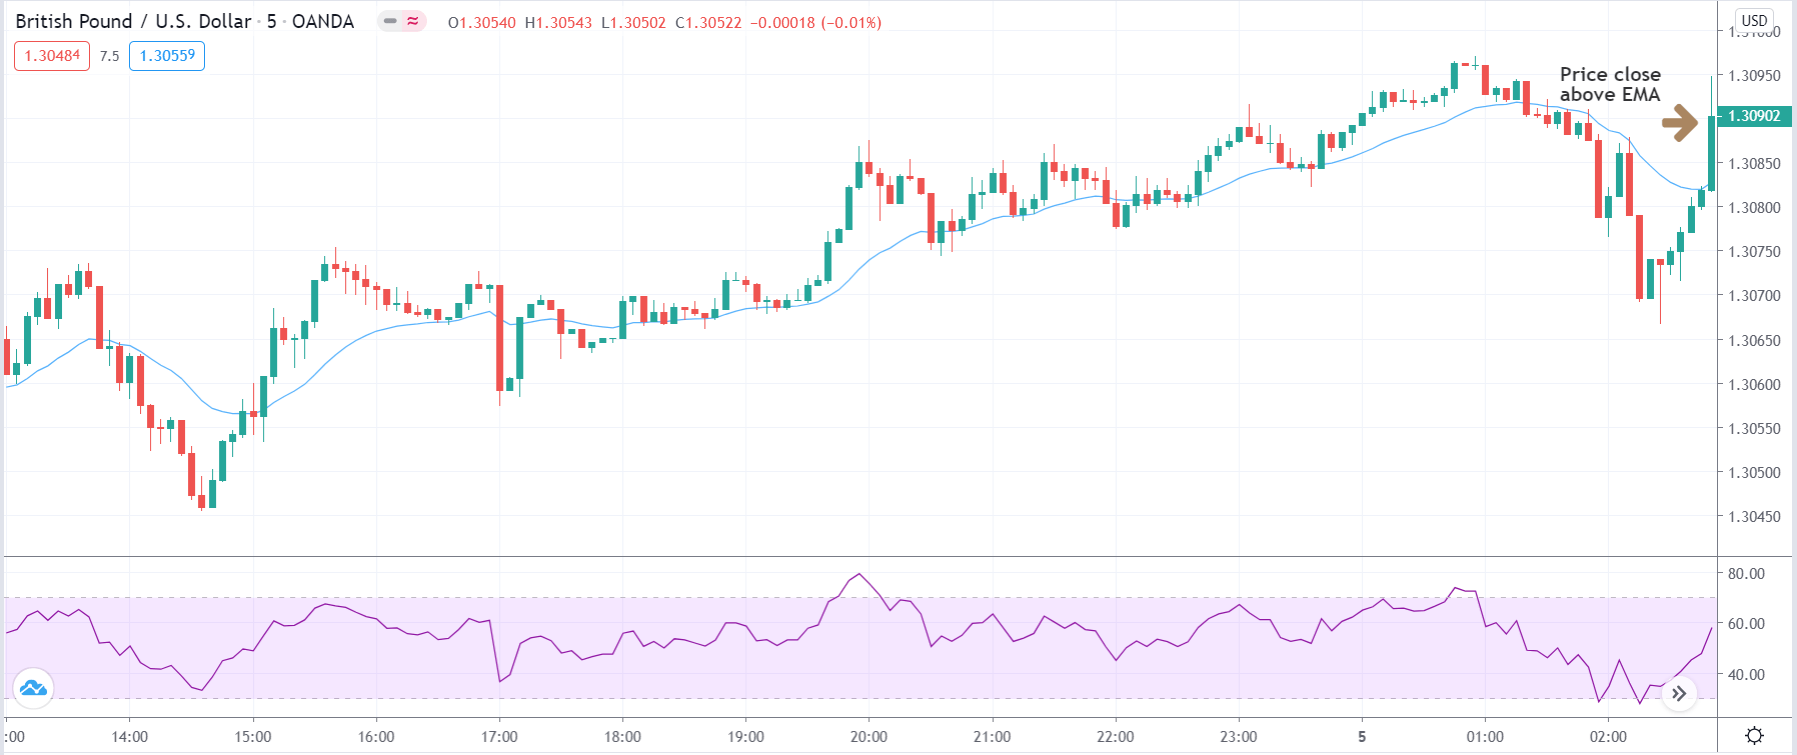
Now we wait for the price to reverse and close above the 20-period EMA, in an uptrend and close below the EMA, in a downtrend. Ensuring this step is critical as it confirms the continuation of the trend. We enter the market with an appropriate position at the close of the candle. There are two ways of entering the market. One, wait for the candle to close and then enter. Second, enter at the crossing of the price above or below the EMA. The second approach is an aggressive form of ‘entry’ and is not recommended for everyone. There is also a conservative form of entry, that is entering at the re-test of the EMA.
In the below image, we can see that we are entering at the close of the bullish candle above the EMA. But since the candle is long and has a large body, the ‘entry’ price is much higher than what we were looking for.
Step 4
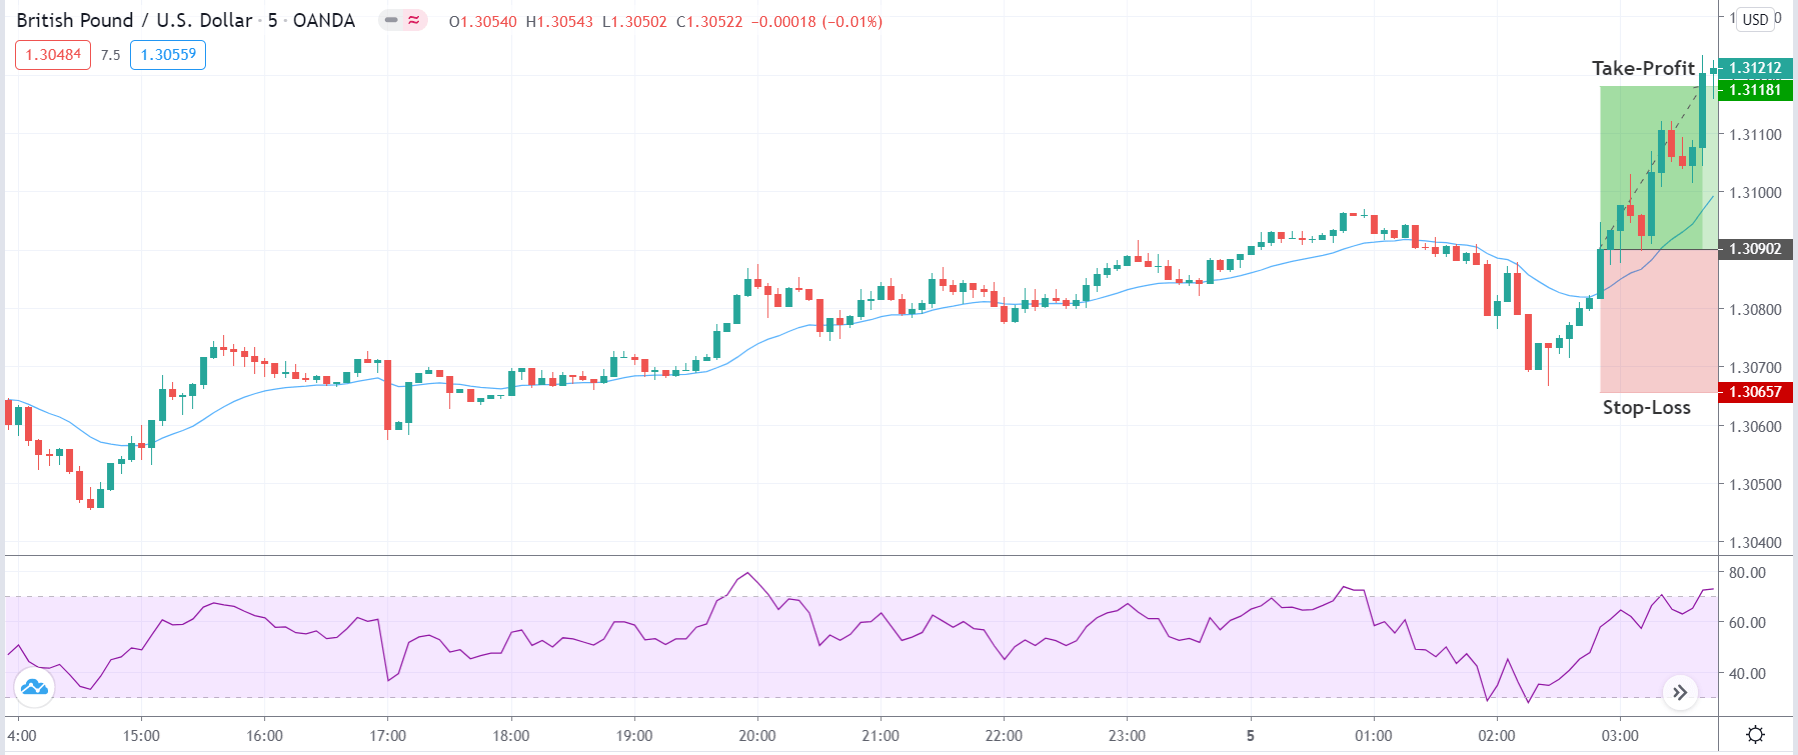
Finally, we determine the stop-loss and take-profit for the strategy. The stop-loss is placed below the ‘low’ from where the market reverses and starts moving higher in case of a ‘long’ trade. In a ‘short’ trade, it will be placed above the ‘high’ from where the market reverses and starts moving lower. Since we are trading with the trend, the ‘take-profit’ can be set at the new ’high’ or ‘low’ that will result in a higher risk-to-reward ratio.
In our case, the risk-to-reward ratio of the trade is just 1:1 since we took a late ‘entry.’
Strategy Roundup
We are making use of the RSI indicator in a most constructive way which helps us in identifying when the market is overbought or oversold. Using the concept of trends, we are applying the strategy to reduce risk and maximise gains. The rule for entering the market in this strategy is what stands out. We are entering only after getting clear signs of confirmation from the market. We can also trail our stop-loss and exit when we get signs of another reversal. This is an aggressive way of taking profit and is mostly done to increase the gains.