Introduction
A Flag Pattern is one of the very well-known trend continuation patterns. Visually, this pattern looks like a flagpole and a flag, hence the name ‘Flag Pattern.’ A flagpole is printed by the sharp price upward move, followed by the symmetrical pullback, which forms the flag on the price chart of any underlying currency pair. When the flag breaks the trend line, it triggers the next trend move of an underlying asset. In simple words, flag forms when price action turns sideways after the sharp upward movement. This pattern can be seen on any timeframe; however, it is mostly found on lower timeframes such as 15, 5 or 3-minute chart.
Flag patterns can be both Bearish & Bullish
Bullish Flag Pattern
The bullish flag pattern starts with a strong upward move. This move implies that the sellers are entirely off guarded as the buyers took over the entire show. Eventually, the price action peaks, and it prints a pullback. The higher high and lower low of the pullback will be parallel to each other. This action results in the formation of a tilted rectangle. This whole process appears like a bullish flag pattern on the price chart.
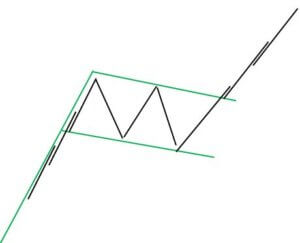
By placing the trend line at the upper and lower end of the pullback, we can observe the diagonal parallel nature of that pullback. The breakout of the upper trend line indicates that the trend is ready to resume, and that is the best time to activate an extended position.
Bearish Flag Pattern
The bearish flag pattern is just the opposite of the bullish flag pattern that we discussed above. When the price action hits bottom, it prints the pullback where the lower low and higher high are parallel to each other.
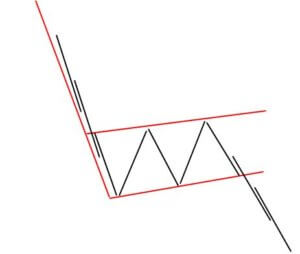
The breakout of the lower trend line indicates that the trend is ready to resume, and it’s the best time to go short in any underlying asset.
Flag Pattern – Trading Strategies
Bull Flag Pattern Strategy
A Bull flag is a trend continuation chart pattern that indicates the likeliness of the market to move higher. (Uptrend Continuation)
Pattern Confirmation Criteria:
- Find out a strong uptrend in any currency pair. In other words, the range of candles should be more bullish.
- After the strong move, wait for the pullback to occur. A pullback is generally in the form of lower low and lower high. Here’s where we can expect to see a bull flag pattern on the price chart.
- Draw the upper and lower trend lines on the price chart. When the price action breaks the upper trend line, it a sign to go long.
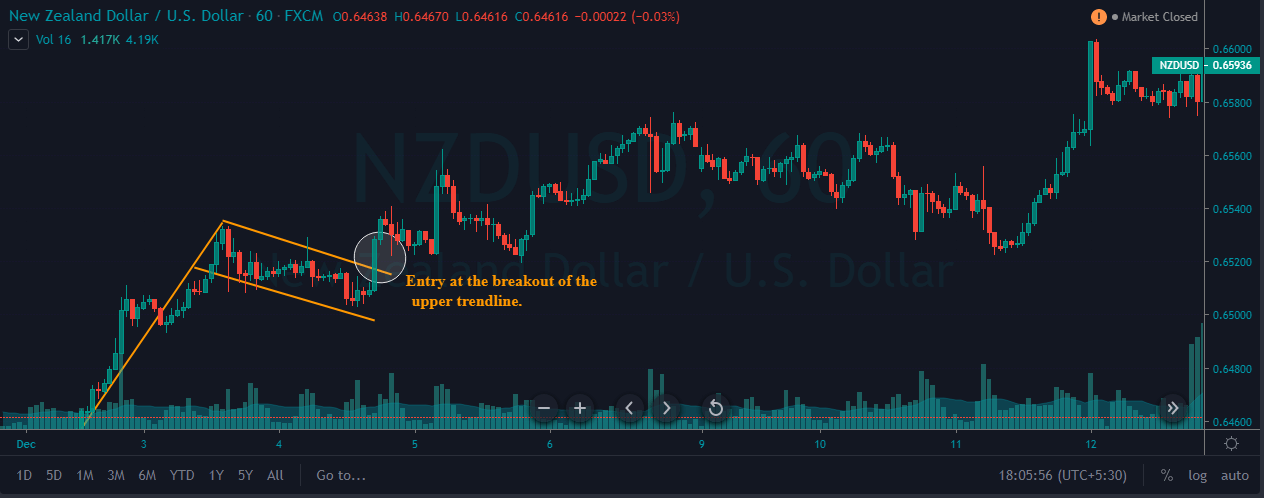
Here’s how the bull flag pattern looks like on price chart.
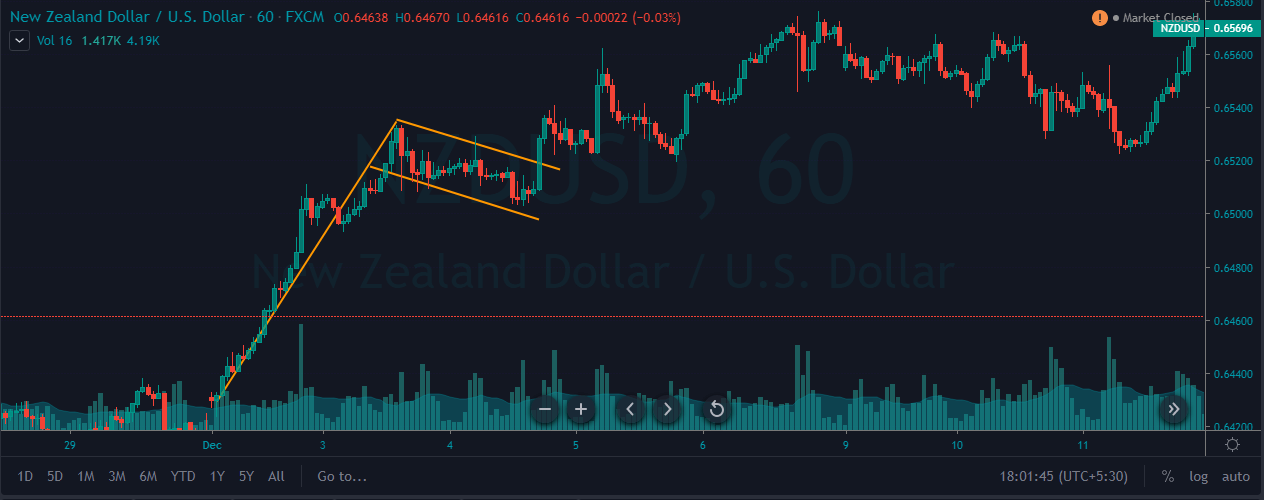
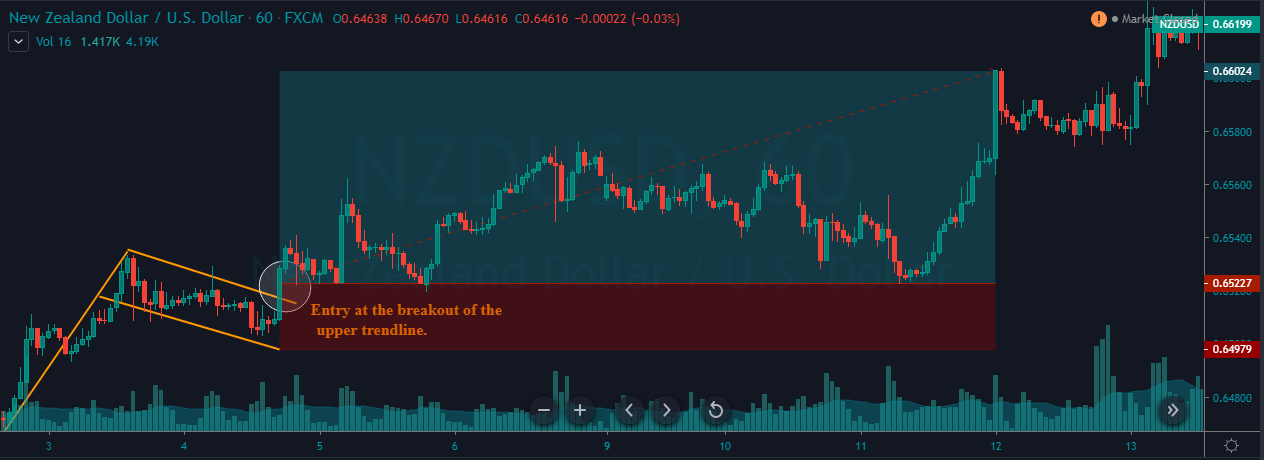
Entry – In the below NZD/USD Forex chart, we can see that the pair was in an overall uptrend. During the pullback phase, price action has printed the bullish flag pattern. The breakout of this pattern indicates a clear buy signal in this currency pair.
Stop-Loss & Take-Profit – When the price action breaks the upper trend line, it’s a sign to go long in this pair. The bull flag is quite a reliable pattern, so we can place our stop-loss just below the second trend line (lower part of the tilted rectangle). Placing the take-profit order is purely based on your trading style. If you are an aggressive trader, go for extended targets; but if you are a conservative trader, use smaller targets. In this particular trade, we closed our full position at one of the significant resistance areas.
Bear Flag Pattern Strategy
A Bearish Flag Pattern is also a continuation chart pattern, but it indicates the downward movement of the market. (Downtrend Continuation)
Pattern Confirmation Criteria:
- Find out a steady downtrend in any currency pair. In other words, the range of candles should be more bearish.
- After a strong move, wait for the pullback to occur. A pullback is typically in the form of a lower higher low and higher high. Here’s where we can expect the formation of a bearish flag pattern on the price chart.
- Draw an upper and lower trend line on the price chart. When price action breaks the lower trend line, it’s a sign to go short.
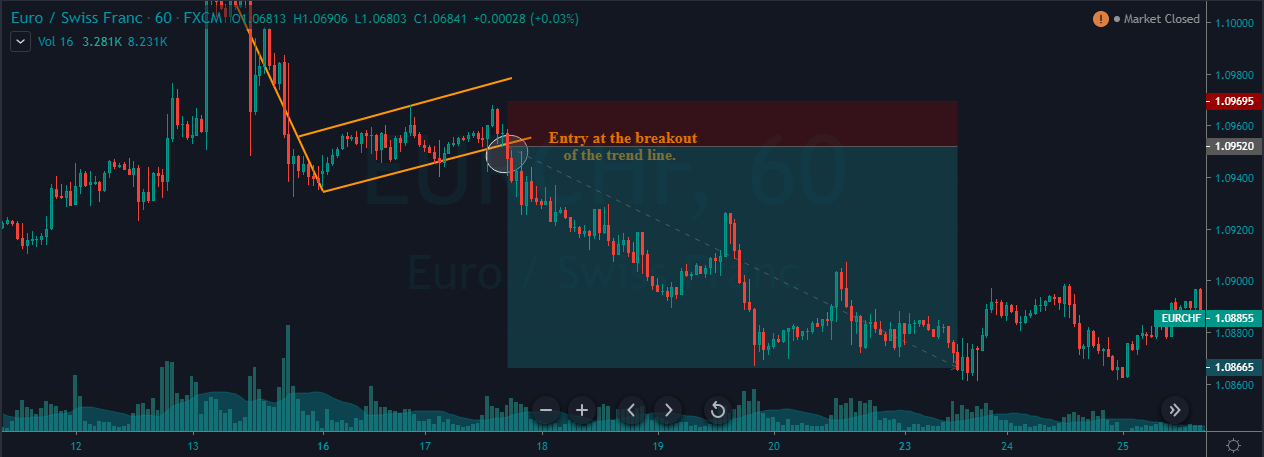
Here’s how the bearish flag pattern looks like on price chart.
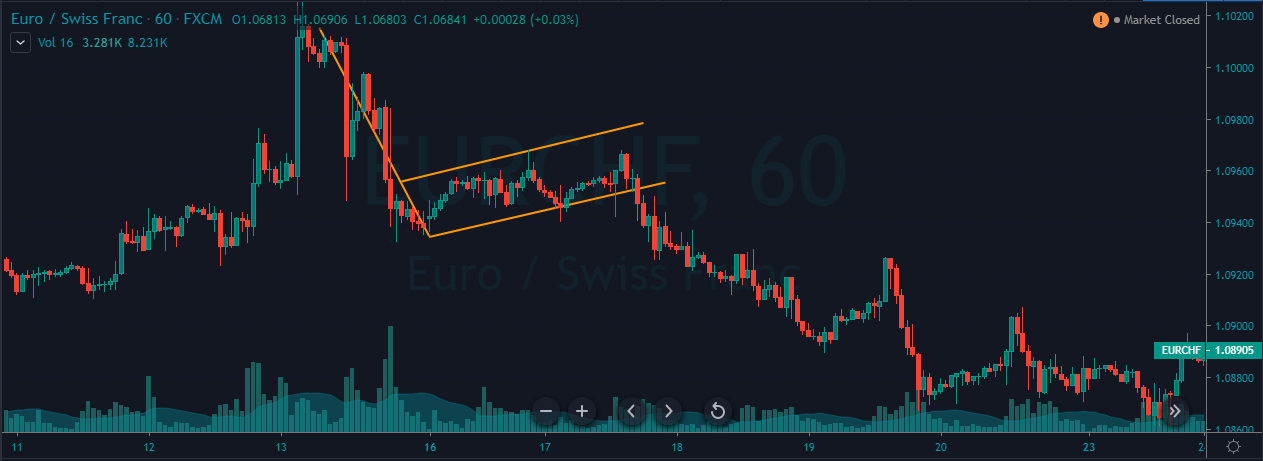
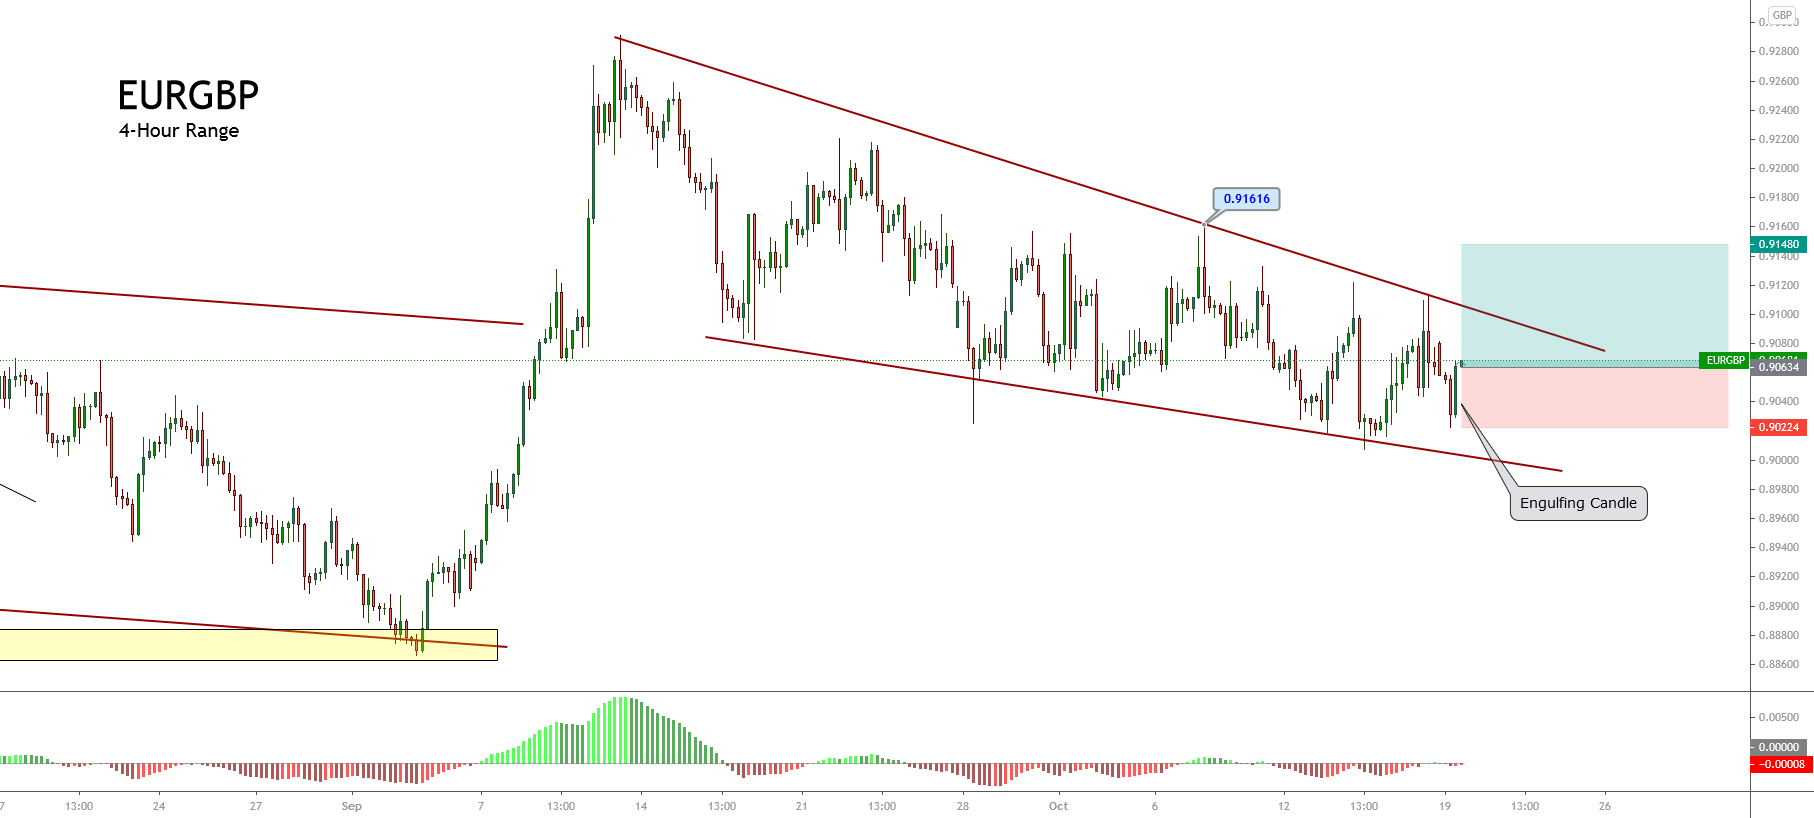
Entry – In the below EUR/CHF 60 Forex chart, the overall market was in an uptrend. Then suddenly, sellers overwhelmed the buyers by printing a couple of strong red candles. If a bearish flag pattern appears on the price chart, we can confirm that the downtrend is going to continue. In the below picture, we can clearly see the formation of a bearish flag pattern. We can activate our sell positions as soon as the lower trend line breaks.
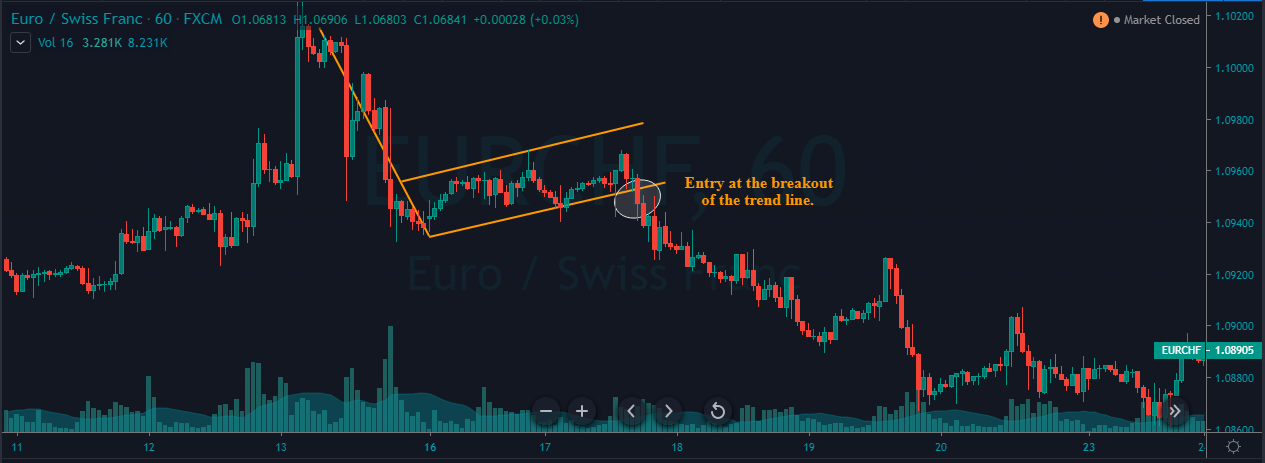
Stop-Loss & Take-Profit – In this trade, we must go for minimal stop-loss because the market is in a consolidation phase and not in a strong downtrend. We had closed our whole position when the price action started struggling to print a new lower low and lower high.
Bottom Line
The Flag pattern is always created by a swift up/down move, followed by the consolidation, which runs between the parallel lines. Always use the breakouts of the Flag pattern to take the positions.
Always remember that the trend is your friend. Take only buy trades in the appearance of a Bullish Flag and sell trades in the presence of a Bearish Flag.
Traditional ways suggest that the stop-loss must be set below the pole of the flag, but we don’t always have to follow this idea. While trading flag breakouts, the stop-loss just below the recent low is good enough.
In the Forex market, the flag pattern performs very well in active trading hours as most of the swift moves (like flagpole formation) occur in busy hours only. If you are a strict confirmation trader, let the price action to retest the trend line to activate your trades. This procedure will help you in picking the higher probability trades, although you’ll miss the higher-momentum moves that don’t pause to continue moving.