Description
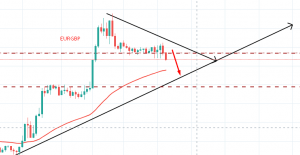
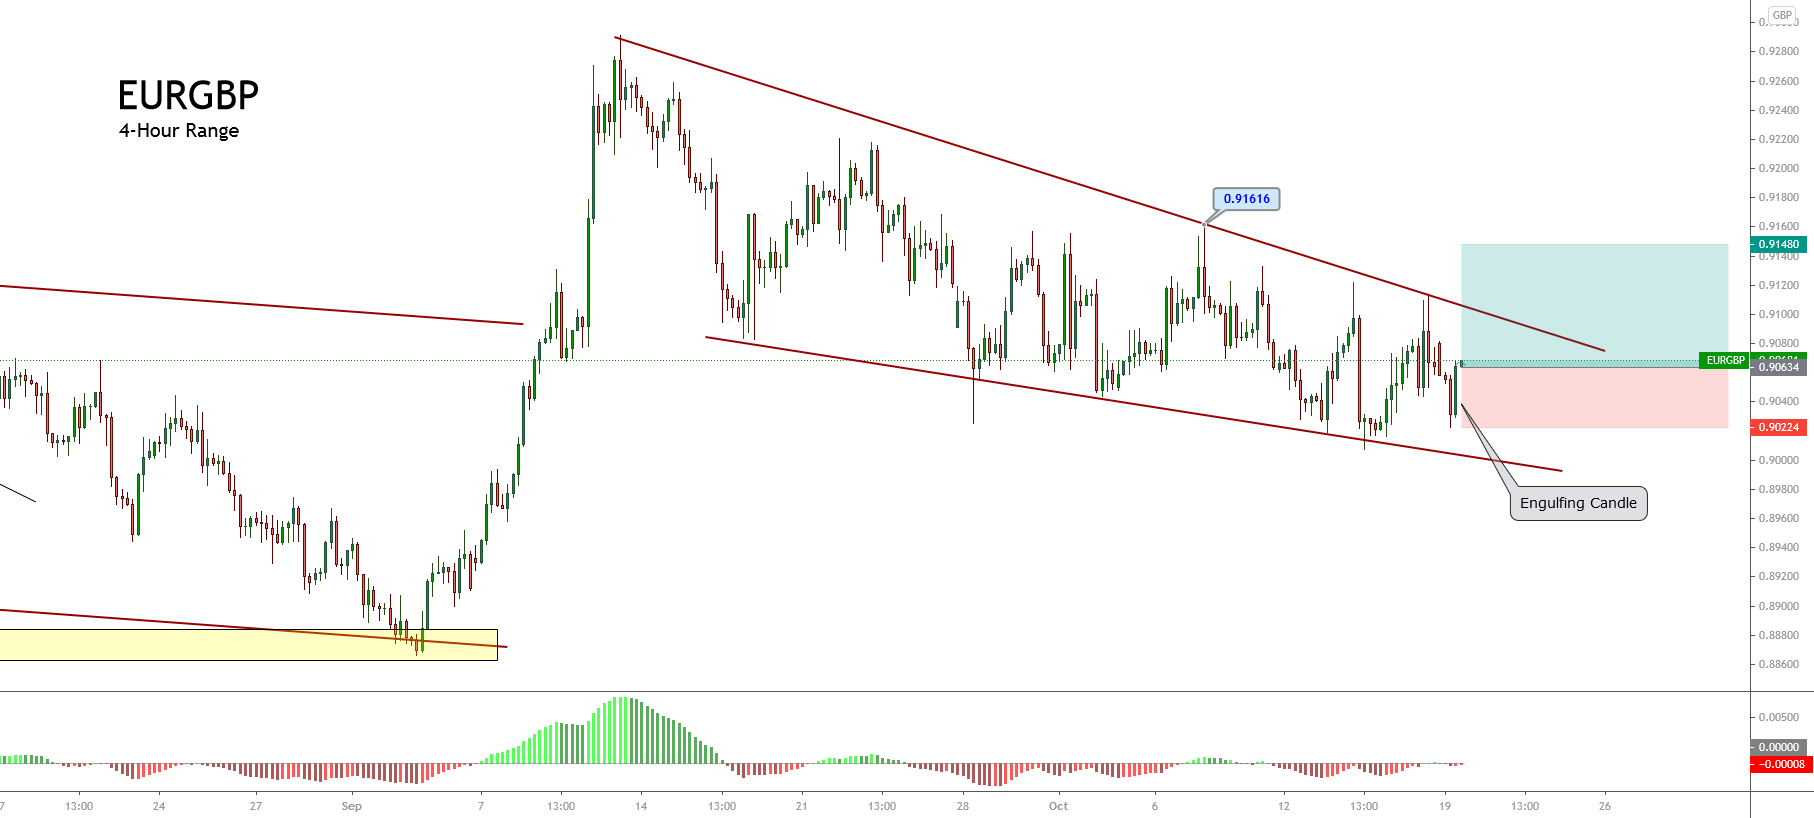
The EURGBP cross, in its 4-hour chart, illustrates a downward corrective sequence that seems to be ending. The engulfing candle pattern in the first trading session of the week unveils the possibility of a new rally.
The big picture reveals an impulsive movement developed since early September at 0.88685; this move ended on September 11th, when the price topped at 0.92212. Once the price found resistance, the cross started to develop a retrace as a descending wedge pattern. This chartist formation calls for the continuation of the previous upward impulsive move.
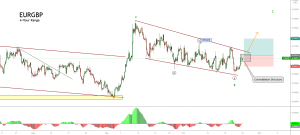
The engulfing candle formation suggests the possibility of a bullish side positioning at 0.90634 (or better) with a potential profit target at 0.9148, which corresponds to the nearest resistance zone from where the price could start to consolidate.
A second option is to maintain the trade looking for the AB=CD pattern completion, with a potential profit target located at 0.94329.
The invalidation level locates below the intraday low at 0.90224.
Chart
Trading Plan Summary
- Entry Level: 0.90681
- Protective Stop: 0.90181
- Profit Target: 0.91531
- Risk/Reward Ratio: 1.70
- Position Size: 0.01 lot per $1,000 in trading account.
Check out the latest trading signals on the Forex Academy App for your mobile phone from the Android and iOS App Store.