The MACD
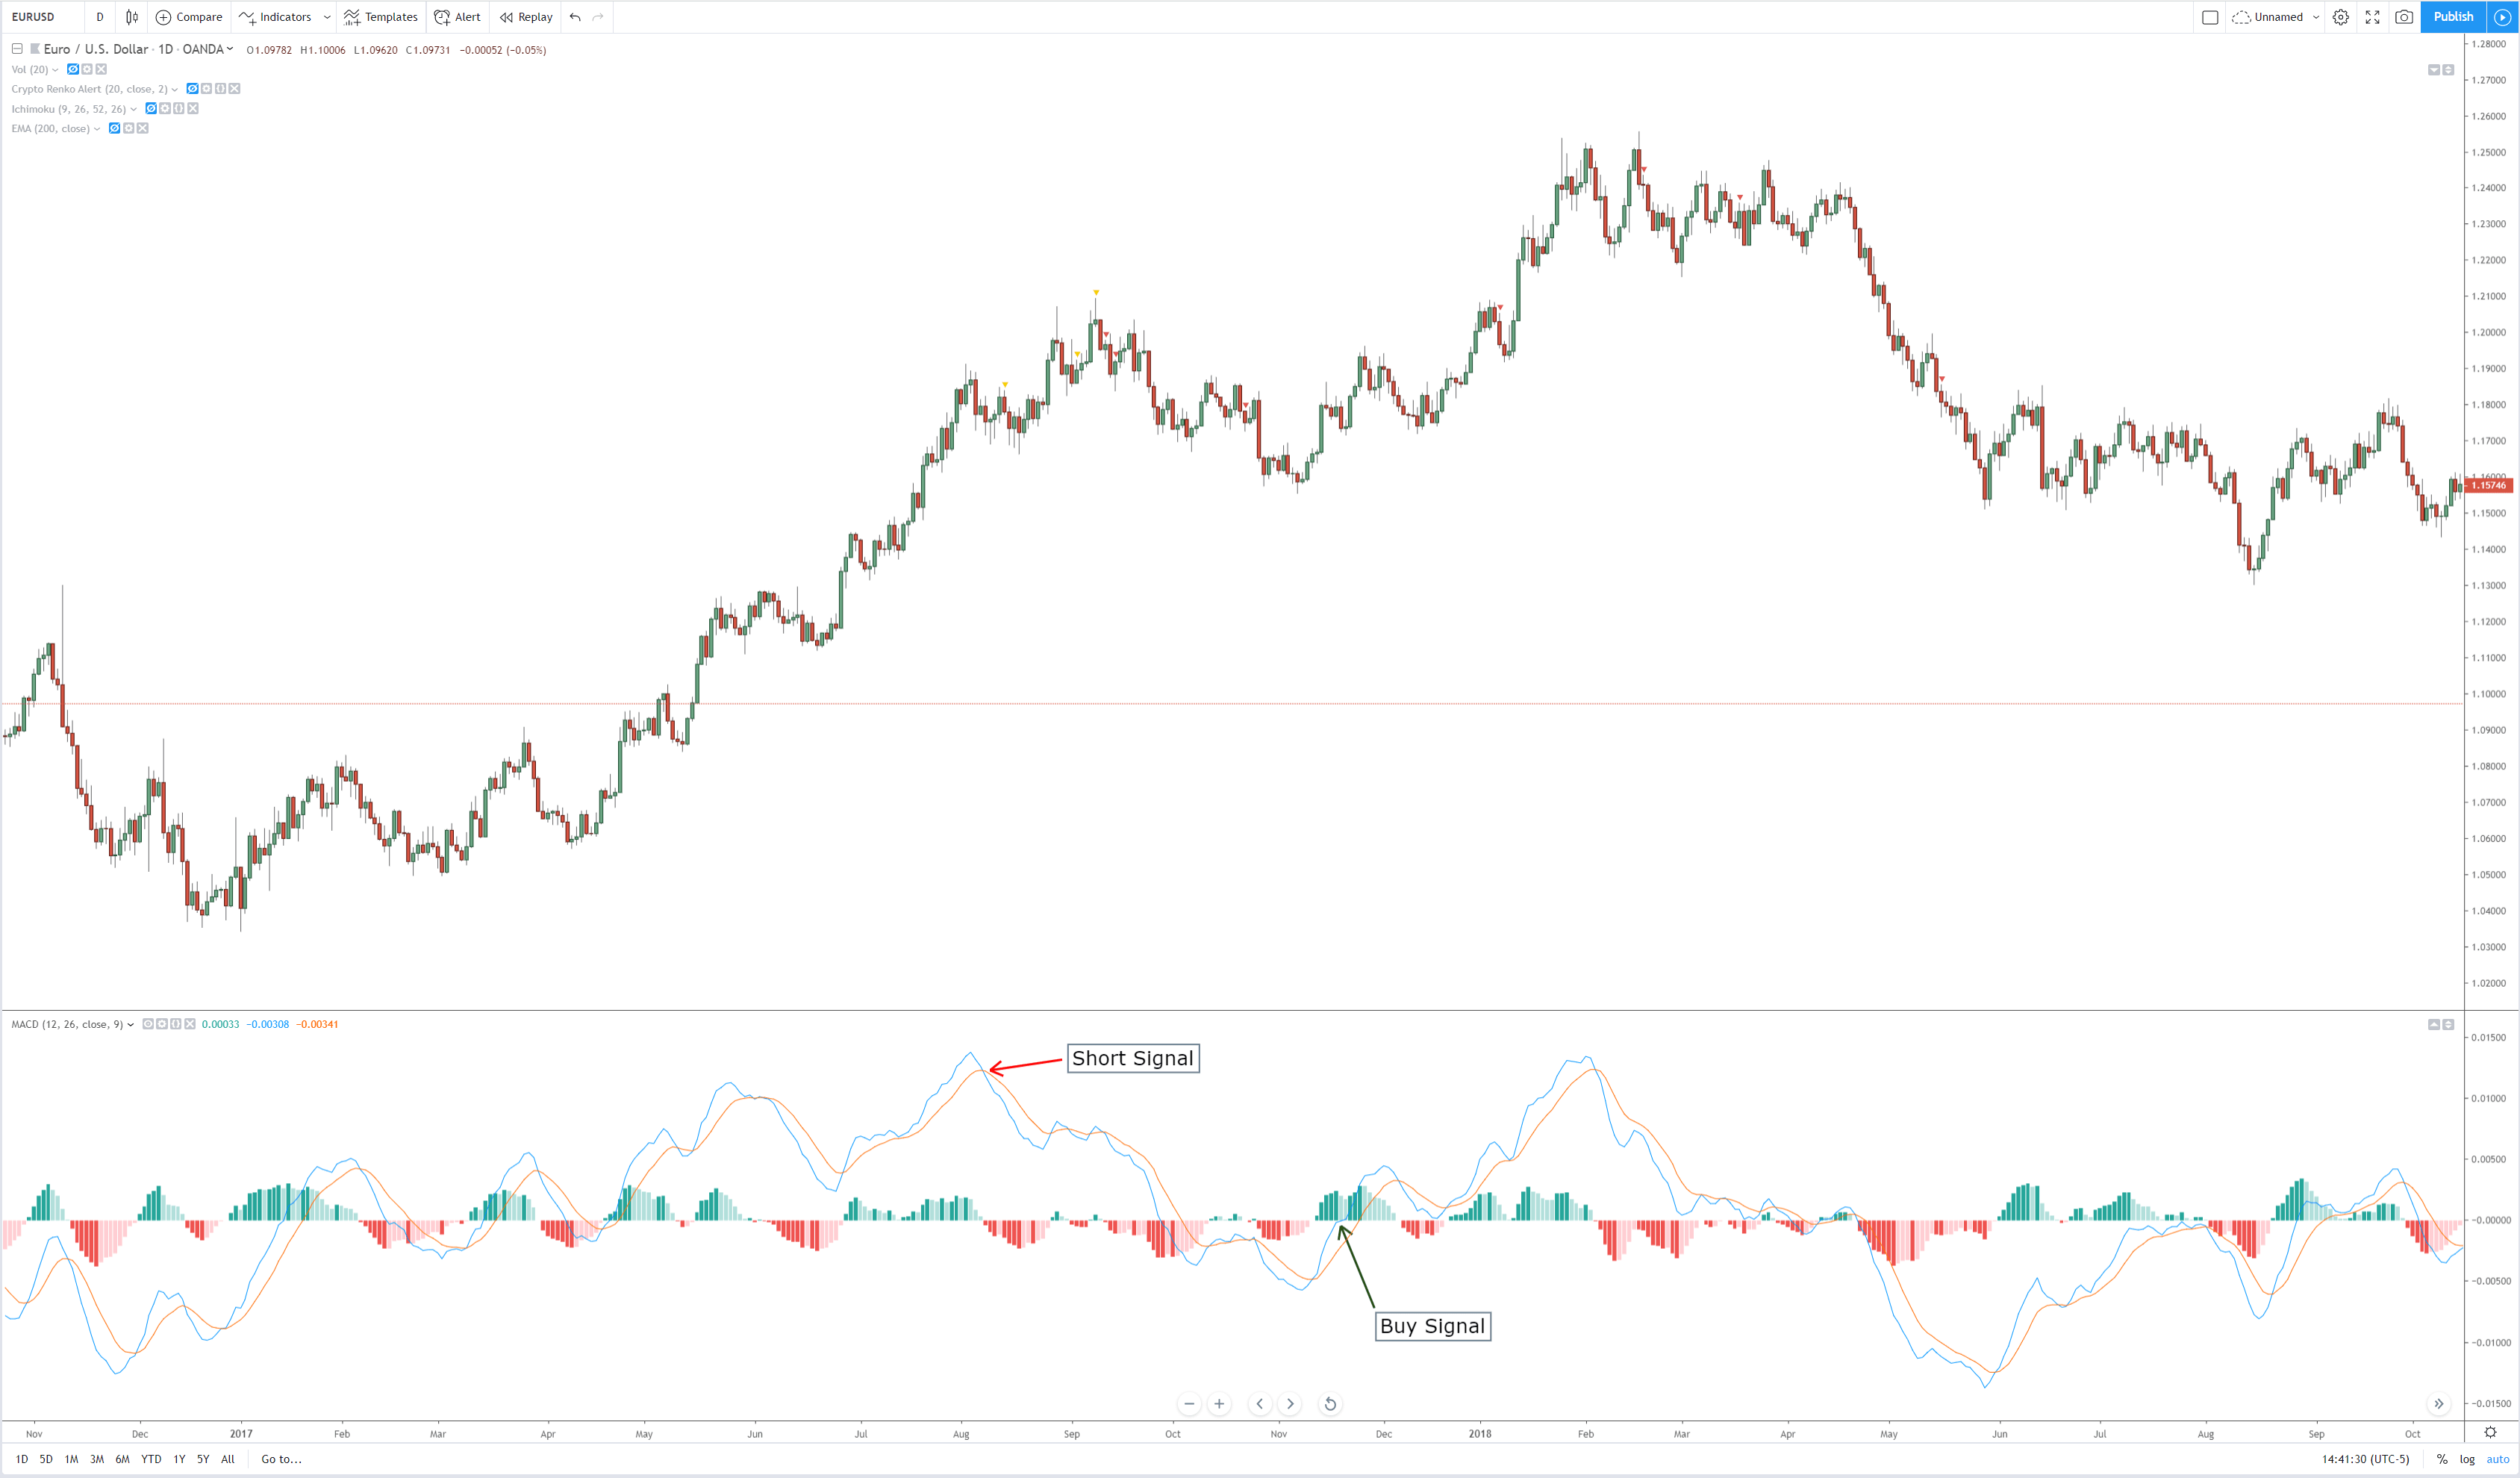
Fig 1- Chart with MACD. Click on it to enlarge
The Moving Average Convergence Divergence (MACD) is probably one of the most popular and well-known oscillator indicators in any market. It is one of our ‘modern’ indicators; created by Gerald Appel in the late 70s. It is essentially a two-part tool that traders can utilize.
- Provides a quick look to see the direction and trend of your market using two lines/moving averages: the MACD line and a signal line.
- It provides a divergence detection tool using a zero line and histogram.
The MACD line and the Signal Line
The first of these parts of the MACD is probably the one used most often, the MACD line and the signal line. General strategies related to the MACD is that you should consider taking a buy when the MACD line crosses above the signal line and sell when the MACD crosses below the signal line. Additionally, some strategies suggest more conservative entries based on when the MACD crosses the middle line (0-line).
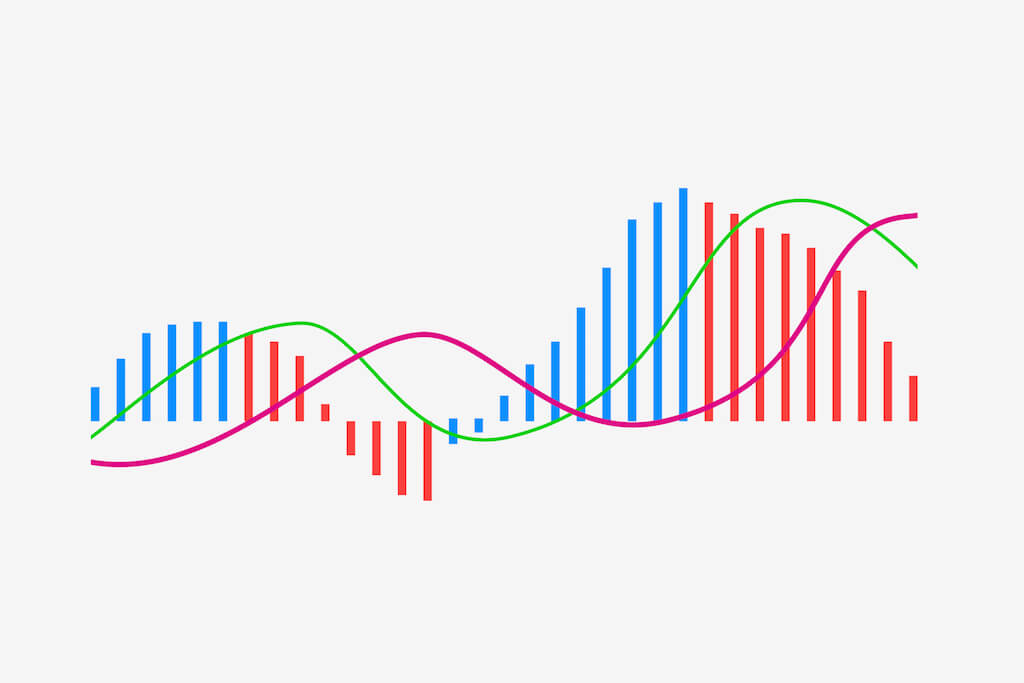
The Histogram
The second part of the MACD, and perhaps the one that confuses many new traders, is the histogram with the 0-line. The histogram shows the difference between the MACD line and the signal line, basically, is showing the ‘gap’ between the two lines, as they grow and diverge away from one another, the histogram expands. However, the real strength of this is the ability to see divergences.
Pros and Cons
The downsides to the MACD indicator is that it is very notorious for causing whipsaws in traders. Whipsaws can be avoided by not using the MACD as your sole indicator of trade signals. The MACD is an excellent tool to help confirm your trades in a trending market, but it is not suitable for a ranging market. If you are a new trader, the MACD is a fantastic tool to help you train and learn about how indicators work. Spend some time watching markets live on smaller time frames and look at how the MACD works and moves with that market. You will notice things you like (i.e., identifying the trend and strength of that trend) and the things you don’t like (i.e., too many signals/crosses on short time frames).
A word of caution
I would caution against using the MACD in your trading. The MACD is an old indicator, and it is most useful as a tool for analysis on daily timeframes or weekly time frames. Because it is so well known and used so much by new traders, it is used against new traders. It is one of those indicators use to entice new traders into using – like bait. Just like moving averages, the MACD has several strategies that involve a crossover. A crossover strategy is simple to understand and easy to learn the strategy and so many new traders try to use this as one of their first strategies – but it doesn’t work. It may seem like it works, but it doesn’t. Again, the MACD is an indicator that is entirely lagging in nature. It is showing what has already happened, not what will happen. It’s most effective use will be a tool for detecting divergences – but even then, there are better indicators and oscillators out there for detecting divergences.


One reply on “MACD – Moving Average Convergence Divergence”
Well explained, thanks. Ill now look to composite index unfortunately i cannot see the tool in Trading view