Categories
Forex Harmonic

The Cypher Pattern

The Cypher Pattern

The Cypher Pattern is another type of Harmonic Pattern – except it isn’t – but it is. This is one of the few patterns not identified by Scott Carney. Darren Oglesbee discovered this particular pattern.

This pattern is very similar to the Butterfly in both it’s construction and where it typically will occur (near the end of trends). However, the Cypher Pattern is a rare pattern and not one that shows up with a high amount of frequency. Don’t confuse rarity with being more powerful or profitable. I do not know enough about this pattern, nor have I had the opportunity to trade it enough to gauge it’s ‘power’ versus its peers. All I do know is that in the times I have traded it, its positive expectancy rate is high, no different than a Bat or Alternative Bat in my experience. The same goes for the Crab and Deep Crab, for that matter. Just like all of the other Harmonic Patterns that you will have learned about, the Cypher has specific rules and conditions that must be met for it to be a specified Cypher pattern.

Cypher Confirmation Conditions

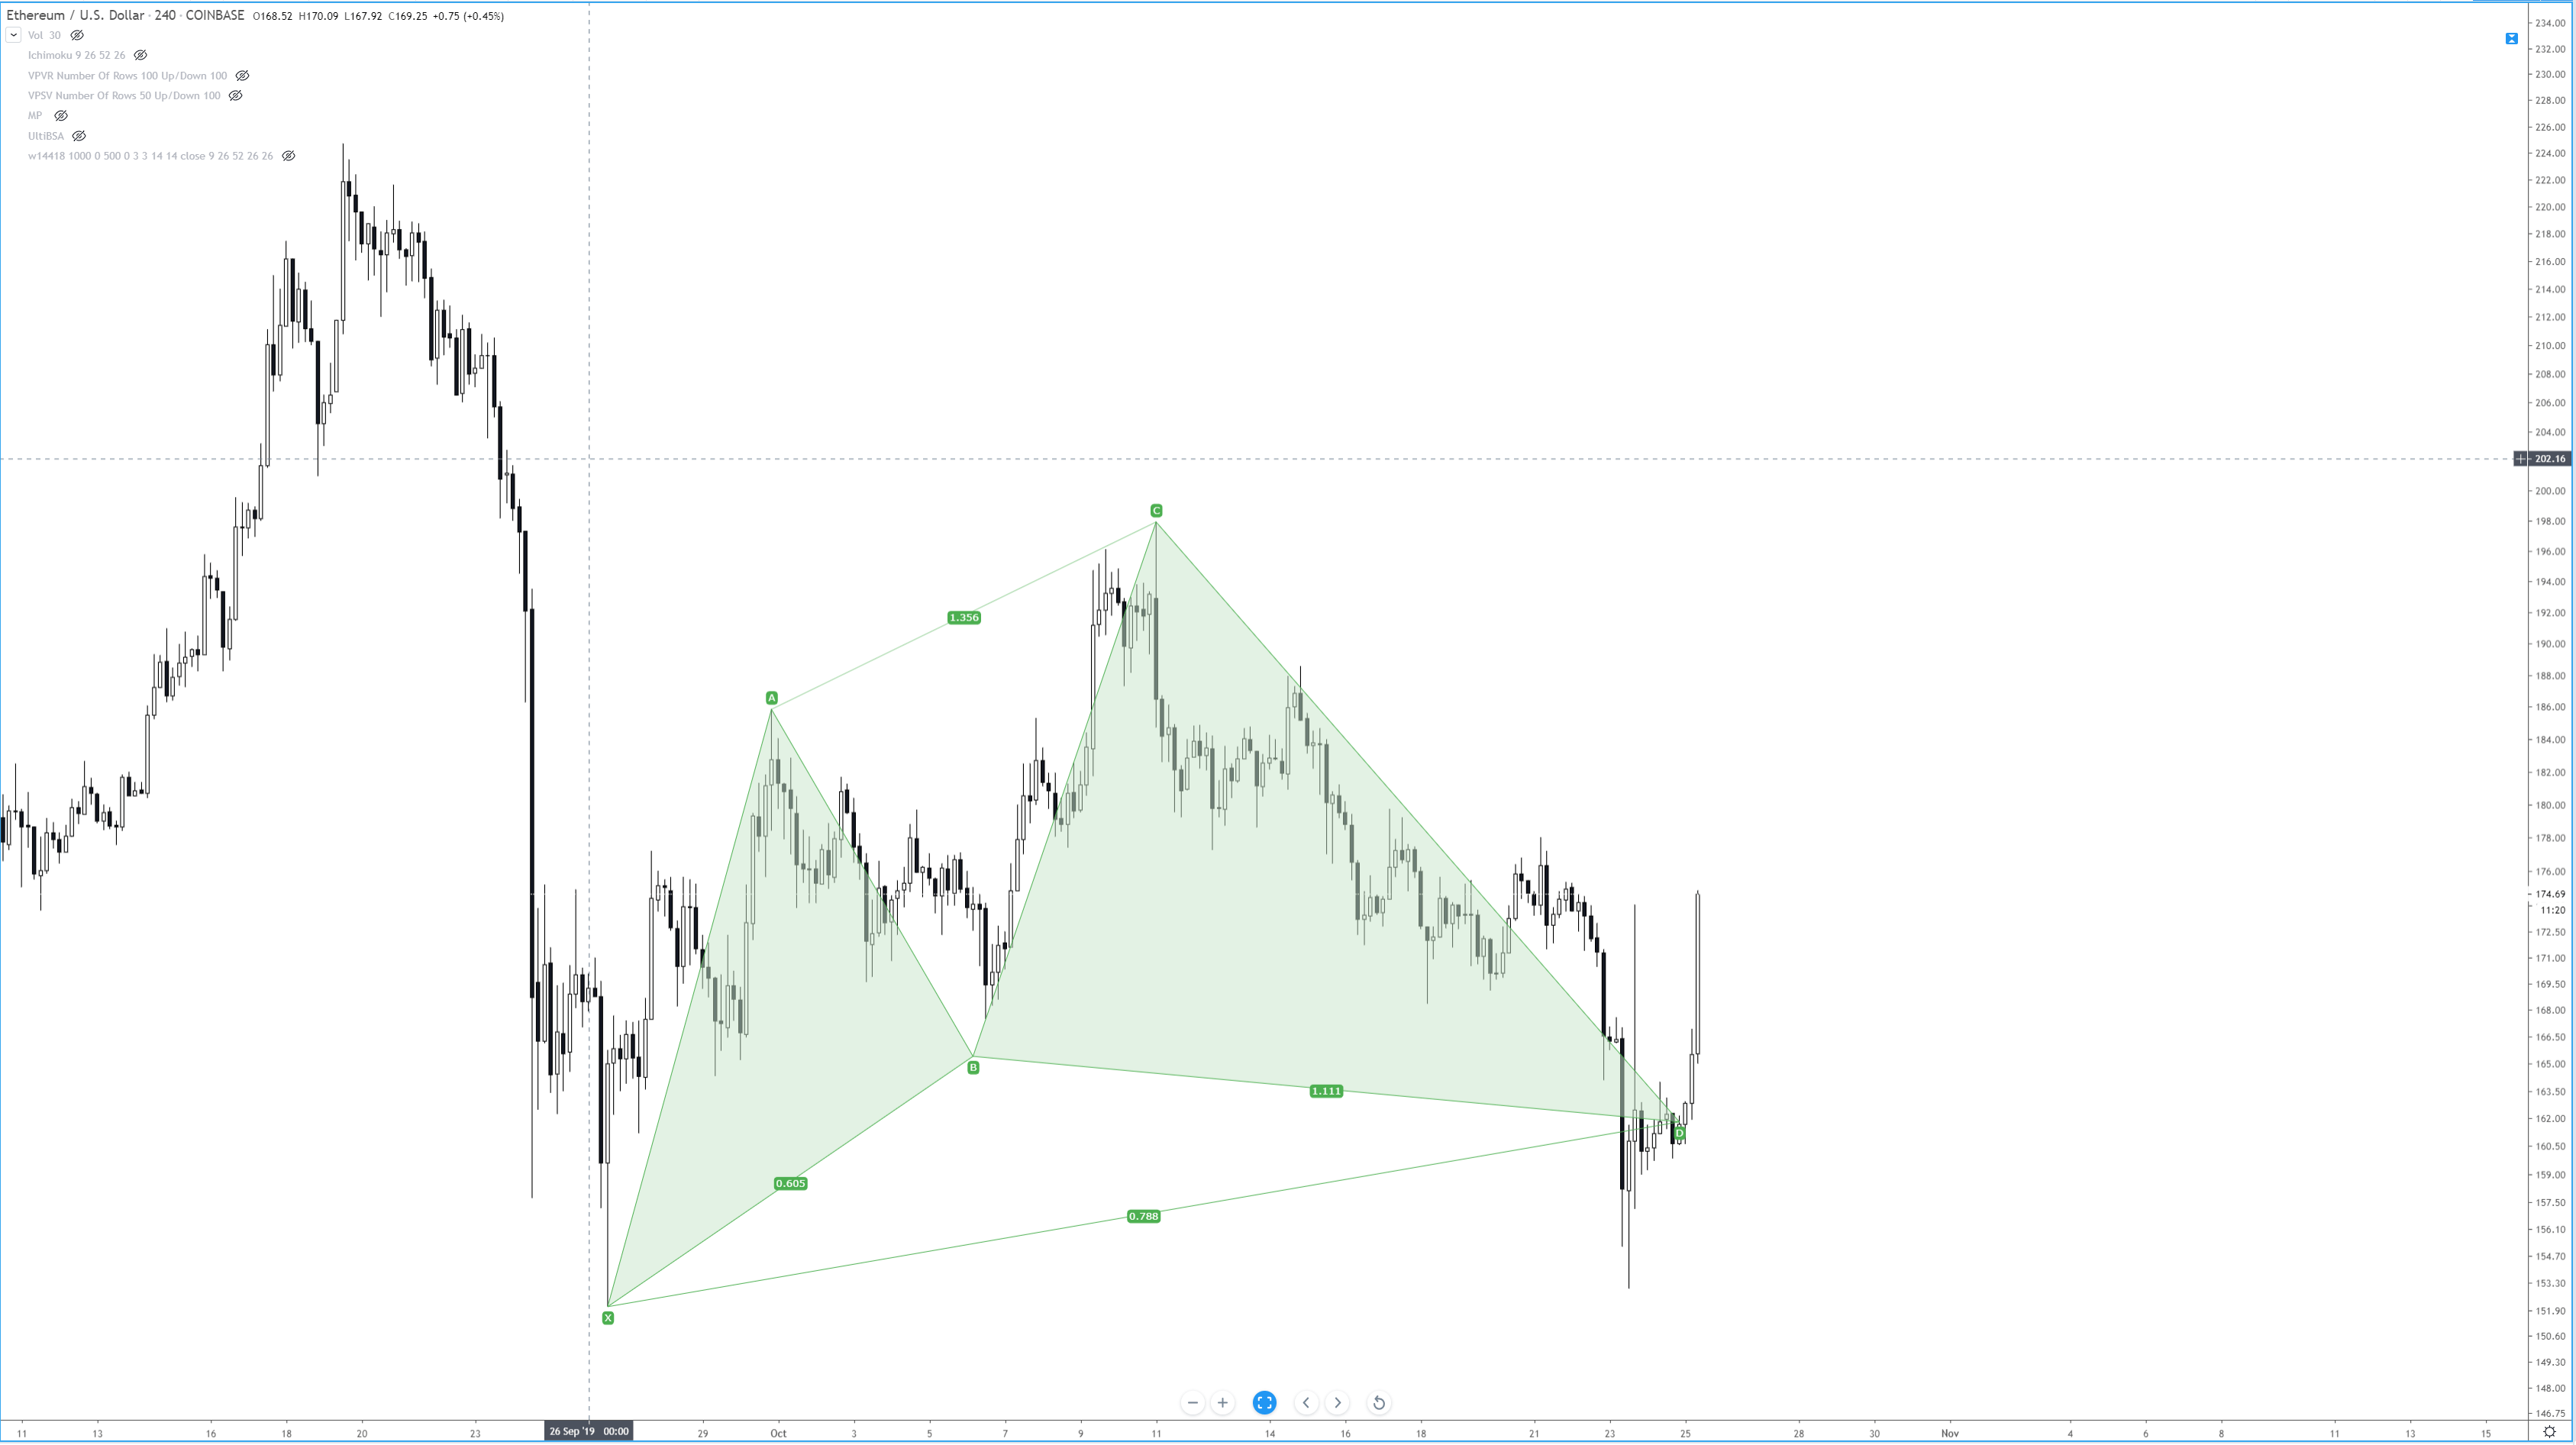
  1. B must retrace to an expansive range between 38.2% and 61.8% of XA. At least 38.2% but not exceeding 61.8%
  2. C is an extension leg and moves beyond A – but must move to at least 127.2%, but it is normal for it to go as far as the 113% – 141.4%. It is considered invalid if it moves beyond the 141.4%
  3. CD leg should break the 78.6% level of XC.
  4. The PRZ (Potential Reversal Zone) of D is a wide range where the price must get to. Price can move anywhere between 38.2% to 61.8%.

I’ve created a simplified approach to how to ‘see’ this pattern.

Simplified Approach (Bullish Cypher)

  1. C must be higher than A.
  2. D must be less than B but greater than X.
  3. We should see a higher high (C > A) and a higher low (D > X).

Simplified Approach (Bearish Cypher)

  1. C must be less than A.
  2. D must be more than B but less than X.
  3. The same approach as above, reverse: lower high (D < X) and a lower low (C < A).

This pattern can be confusing (all harmonic patterns can be complicated), but in a nutshell, what we see happening with the Cypher pattern is the first pullback/throwback of a trend (B). After B, the small pullback/throwback of B occurs with the C leg. From a bullish perspective, when we see prices making lower highs and lower lows, but there is no follow-through shorting pressure, we should be on the lookout for some powerful and influential moves to occur in a very short period of time. It is not uncommon to see a bullish candle engulf several days of consolidation with this pattern.


Sources: Carney, S. M. (2010). Harmonic trading. Upper Saddle River, NJ: Financial Times/Prentice Hall.  Gilmore, B. T. (2000). Geometry of markets. Greenville, SC: Traders Press.  Pesavento, L., & Jouflas, L. (2008). Trade what you see: how to profit from pattern recognition. Hoboken: Wiley.

Categories
Forex Harmonic

The Alternate Bat Pattern

Harmonic Pattern Example: Alternate Bat Bullish

The Alternate Bat Pattern

The Alternate Bat Pattern is another pattern by Scott M. Carney. This pattern comes from his second Volume Two in his Harmonic Trading series of books. He discovered this pattern roughly two years after (2003) his discovery of the Bat Pattern (2001). Carney wrote that ‘the origin of the alternate Bat pattern resulted from many frustrated and failed trades of the standard framework. The standard Bat pattern is defined by the B point that is less than a 0.618 retracement of the XA Leg.’ Essentially, with the Alternate Bat Pattern we observe an extension beyond the 88.6% level at D, where D moves slightly below X (in a bullish Bat) or above X (in a bearish Bat). I view Alternate Bats as classic and powerful bear traps and bull traps. And they are just plain nasty if you find yourself thinking that a new low means further downside movement and a continuation lower – but instead to you get whipsawed by a massive reversal.


Alternate Bat Elements

  • Whereas the 88.6% retracement is nearly singular to the Bat Pattern, the Alternate Bat Pattern utilizes the 113% retracement of XA to determine the endpoint.
  • B must be a 38.2% or less retracement of XA.
  • Minimum projection of 200%
  • The AB=CD pattern must be an extended AB=CD and often is a 161.8% level.
  • The pattern is potent when using a form of divergence detection, such as the Composite Index, to confirm the pattern.


Sources: Carney, S. M. (2010). Harmonic trading. Upper Saddle River, NJ: Financial Times/Prentice Hall.  Gilmore, B. T. (2000). Geometry of markets. Greenville, SC: Traders Press.  Pesavento, L., & Jouflas, L. (2008). Trade what you see: how to profit from pattern recognition. Hoboken: Wiley.

Categories
Forex Educational Library

Understanding The Fibonacci Sequence

Introduction

Fibonacci is probably the most famous tool for traders. In this article, we will explain its origin, how the more common levels are calculated, and how to use retracements and extension tools.

The Fibonacci sequence was discovered and developed by the Italian mathematician Leonardo Pisano “Fibonacci” (son of Bonaci Pisano). The Fibonacci Sequence, published in the year 1202 in his book “Liber Abaci” (Book of Calculus), exposes the problem of growth of a population of rabbits based on specific assumptions. Fibonacci concluded that each month the density of rabbit pairs was increasing from 1 to 2, then from 2 to 3, the next month from 3 to 5 and so on to infinity. In mathematical terms, the Fibonacci Sequence is:

In practical terms, the Fibonacci Sequence is:

 Understanding The Fibonacci Sequence

Now that we have calculated the sequence, we will determine the proportions that are related to this number series. In the first place, we will calculate the “Golden Ratio” or Phi (Φ) = 1.61803 and its inverse phi (1/Φ = φ) = 0.61803. Brown (2008) defines the Golden Ratio as a universal law that explains how everything with a growth and decay cycle evolves. In Table 2, we can see how the Fibonacci sequence converges to ratios 1.618 and 0.618; this can also be seen graphically in Figure 1.

The Fibonacci Sequence

1.618 and 0.618 Convergence

Fig 1: 1.618 and 0.618 Convergence (Source: Personal collection)

Fibonacci Levels Formation

Before calculating the various levels of Fibonacci, it is necessary to expose the concepts of retracement and projection. In figure 2, the US Dollar Index <DOLLAR> began a bearish movement on the 3rd of January 2017, registering a maximum level of 103,785, this move recorded a minimum lower than the previous minimum (99,465), after having reached 99,195 on the 2nd of February 2017, going back to 102,270. Once it reached this level, a new bearish cycle began with a projection that reached 90.985. This example is analogous to the bullish case.

Fibonacci Levels Formation

Fig 2: Retracement and Projection Movements. (source: Personal Collection)

Using the levels Phi Φ (1.618) and phi φ (0.618), we will calculate the different Fibonacci levels, as follows in Table 3:

Fibonacci retracement and projections calculation

Some traders prefer to use the level 0.764 and not 78.6, and vice-versa; this is not a critical factor for analysis and trading, the relevant factor is the decision that could take place when the price reaches this zone. Additionally, it is usual to add some levels in projections, for example, 227.2, 238.2, 3, 327.2, and so on.

Considering the example of the US Dollar Index, in figure 3 the DOLLAR finds resistance at 61.8 level (102.032), where the new bearish cycle takes place in continuation. We do not consider the F(61.8) as a per se rule strictly, sometimes the price finds resistance (or support) on another Fibonacci level, it is essential to follow what the price action is doing.

Fibonacci RETRACEMENT

Fig 2: Fibonacci Retracement (source: Personal Collection)


Once we have continuation signals, using the Fibonacci extension tool, we can define a forecast of the price movement target. In figure 4, DOLLAR follows in the bearish direction, the first objective expected is FE(100), FE(161.8) as the second target and third target FE(200). In our example, the Dollar targets are FE(100) 97.672, FE(161.8) 94.83 and finally FE(200) 93.074.

Fibonacci Extension

Fig 4: Fibonacci Extension. (source: Personal Collection)

Notes:

  • F(61.8) means 61.8 Fibonacci Retracement Level.
  • FE(161.8) means 161.8 Fibonacci Extension Level.


SUGGESTED READINGS:

  • Brown, C., (2008). Fibonacci Analysis. New York: Bloomberg Press.
  • Carney, S., (2010). Harmonic Trading Volume 1. New Jersey: Pearson Education Ltd.


KEYWORDS:


Fibonacci, Theory, Retracement, Extension.

©Forex.Academy