Something that I stress repeatedly throughout our series on chart patterns is the difference between traditional markets like the stock market and the forex market. I’m sure a good number of readers have spent time reading books on technical analysis and have recorded and have seen various statistics regarding the performance of the various chart patterns that exist. There’s a big problem that exists in the realm of technical analysis and its use in forex markets, and that is related to nearly 100% of all technical analysis trading material focused on the stock market. Why is this a problem? Several reasons.
Statistical performance values for chart patterns based on the pattern’s performance in the stock market is overwhelmingly long-biased: the stock market has been in a bull market for over a decade.
Forex markets do not ‘trend’ in the traditional sense of financial analysis, they range.
In a nutshell, just because a particular pattern in the stock market may not perform that well in the forex market, it does not mean that its performance isn’t positive in forex. I’ve learned that most underperforming chart patterns in the stock market perform very well in forex markets. As always, make sure you do your own due diligence and research – investigate each pattern for yourself and see how they play out in your own trading.
To begin learning about Chart Patterns, follow this series of education articles.
Kirkpatrick, C. D., & Dahlquist, J. R. (2016). Technical analysis: the complete resource for financial market technicians. Upper Saddle River: Financial Times/Prentice Hall.
Bulkowski, T. N. (2013). Visual guide to chart patterns. New York, NY: Bloomberg Press.
Bulkowski, T. N. (2008). Encyclopedia of candlestick charts. Hoboken, NJ: J. Wiley & Sons.
Bulkowski, T. N. (2002). Trading classic chart patterns. New York: Wiley.
Flags and Pennants If you’ve ever traded a chart and you’ve seen what looks like a reversal in the trend, but as soon as you enter the trend seems to continue, odds are you were trading against a continuation pattern. Flags and pennants are titles given to patterns that show up as small countertrend moves […]
Flags and Pennants
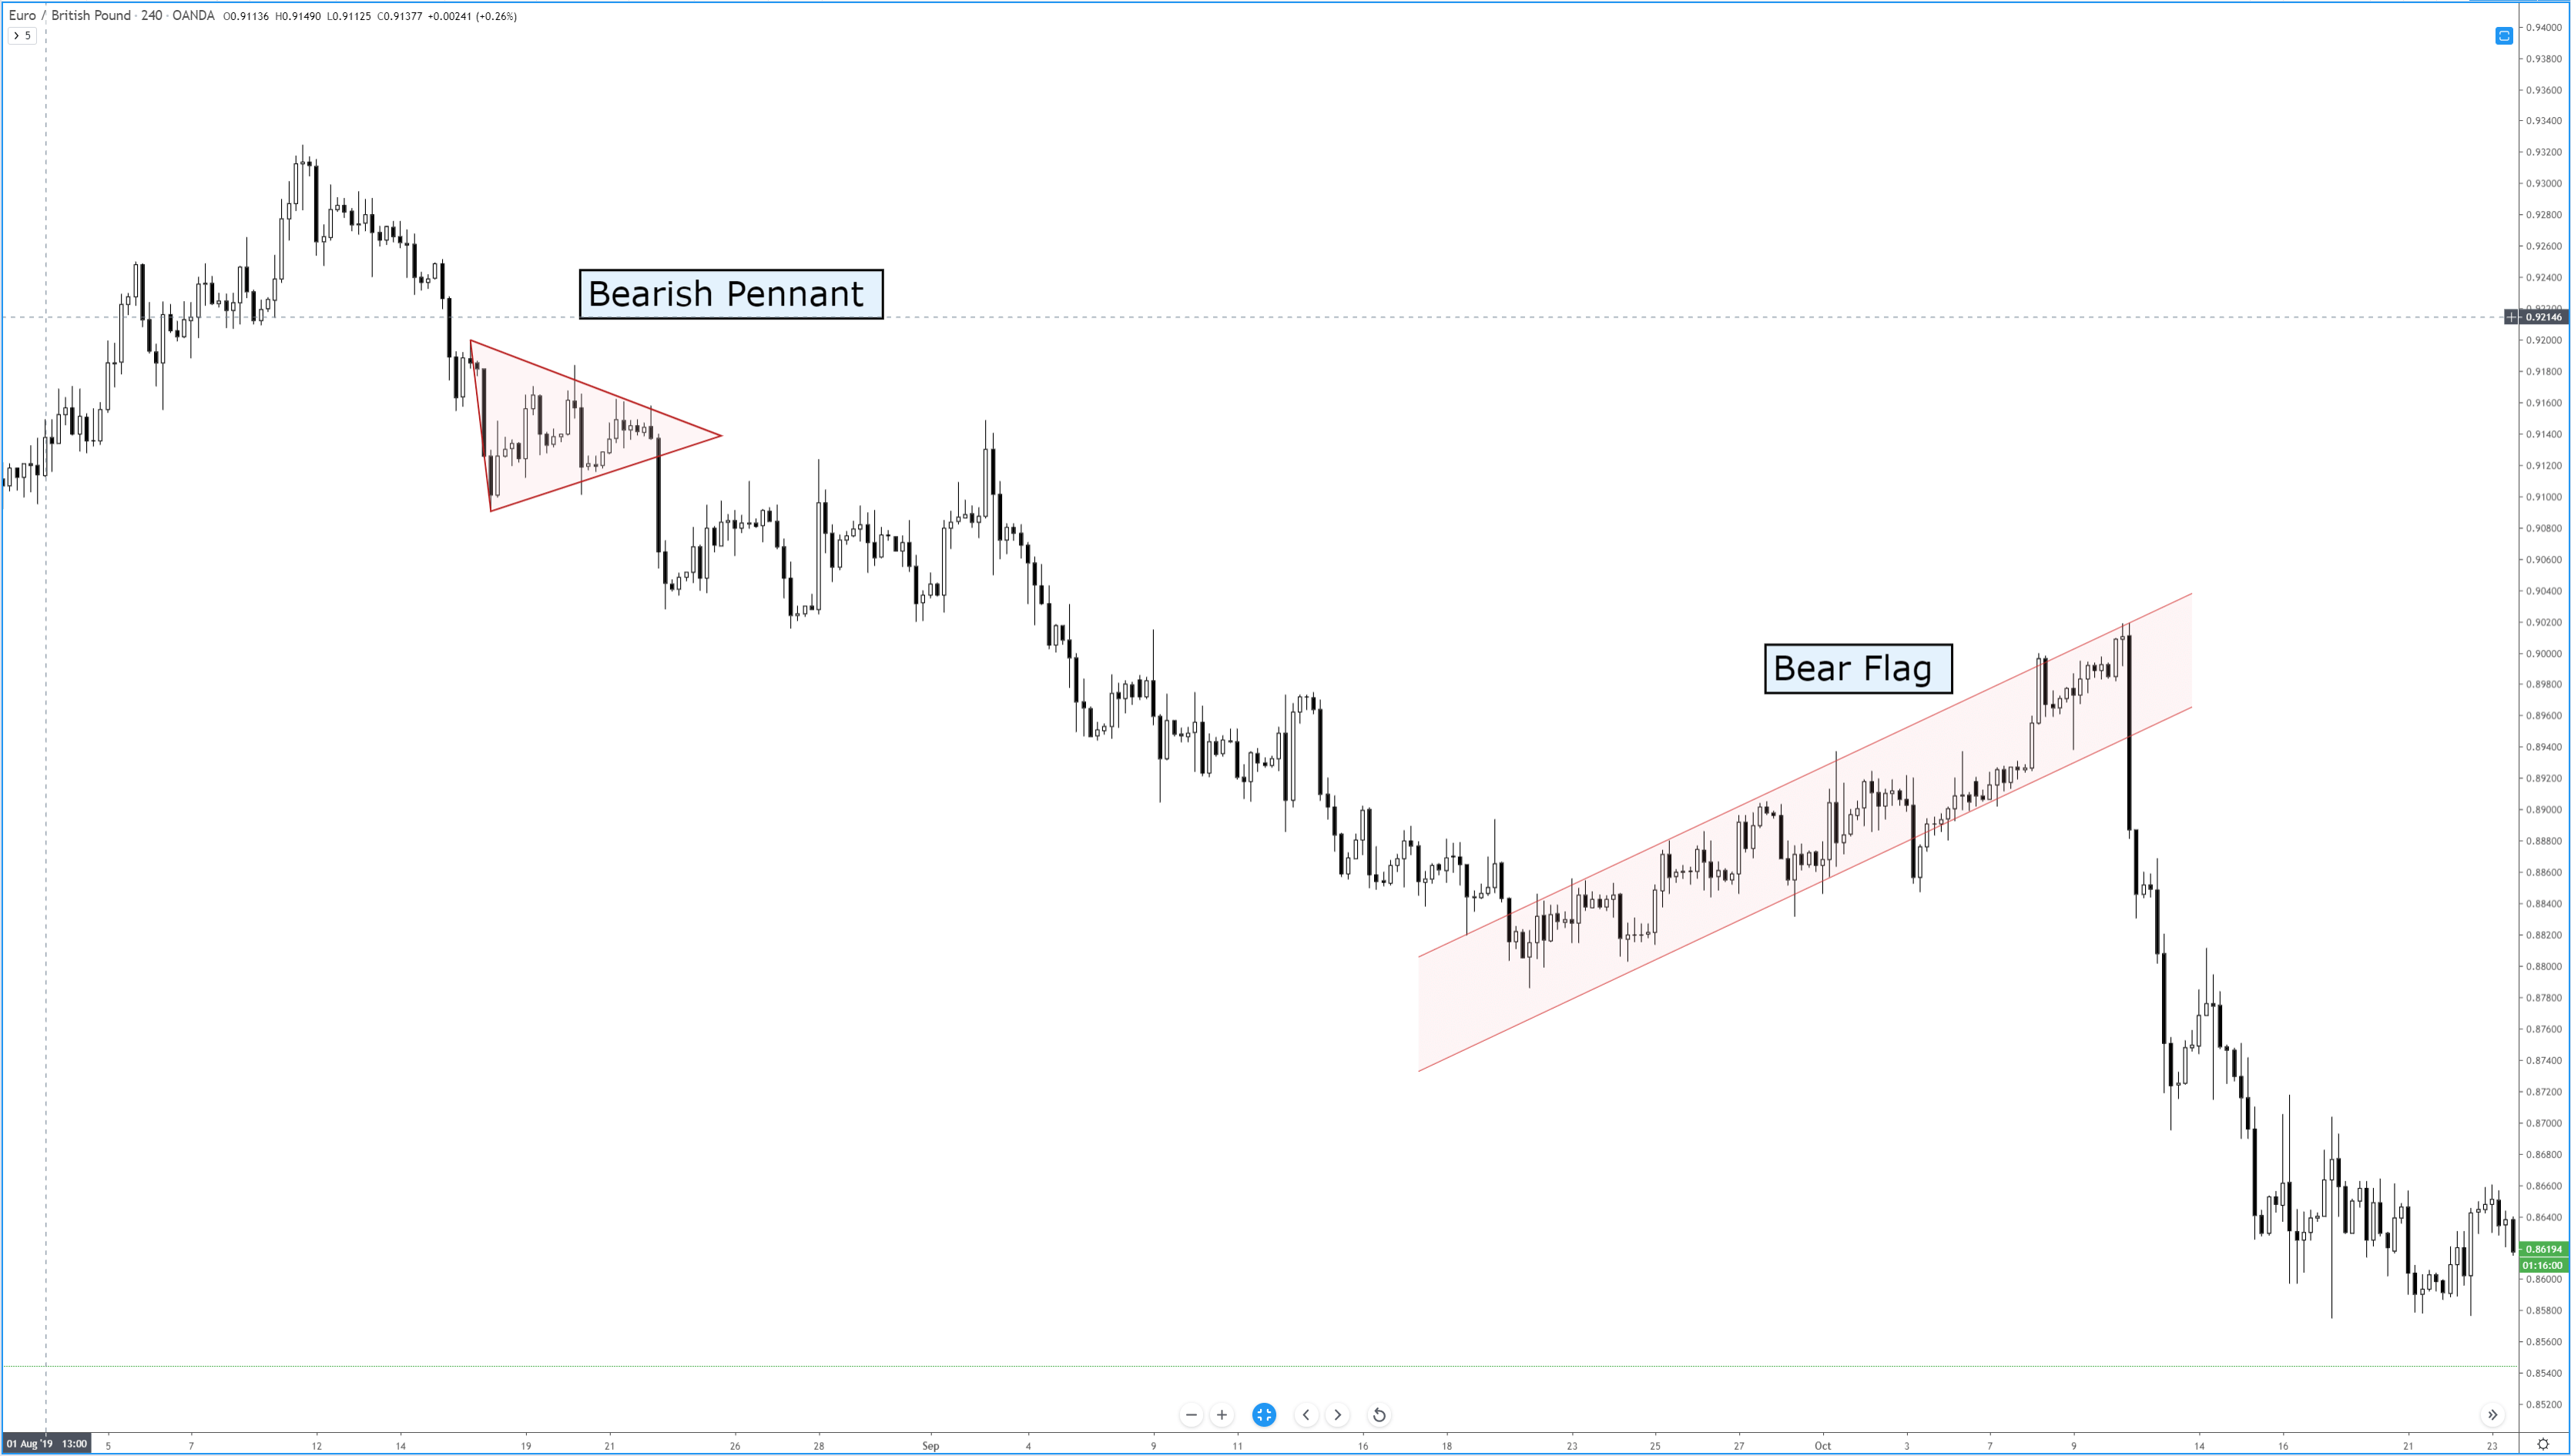
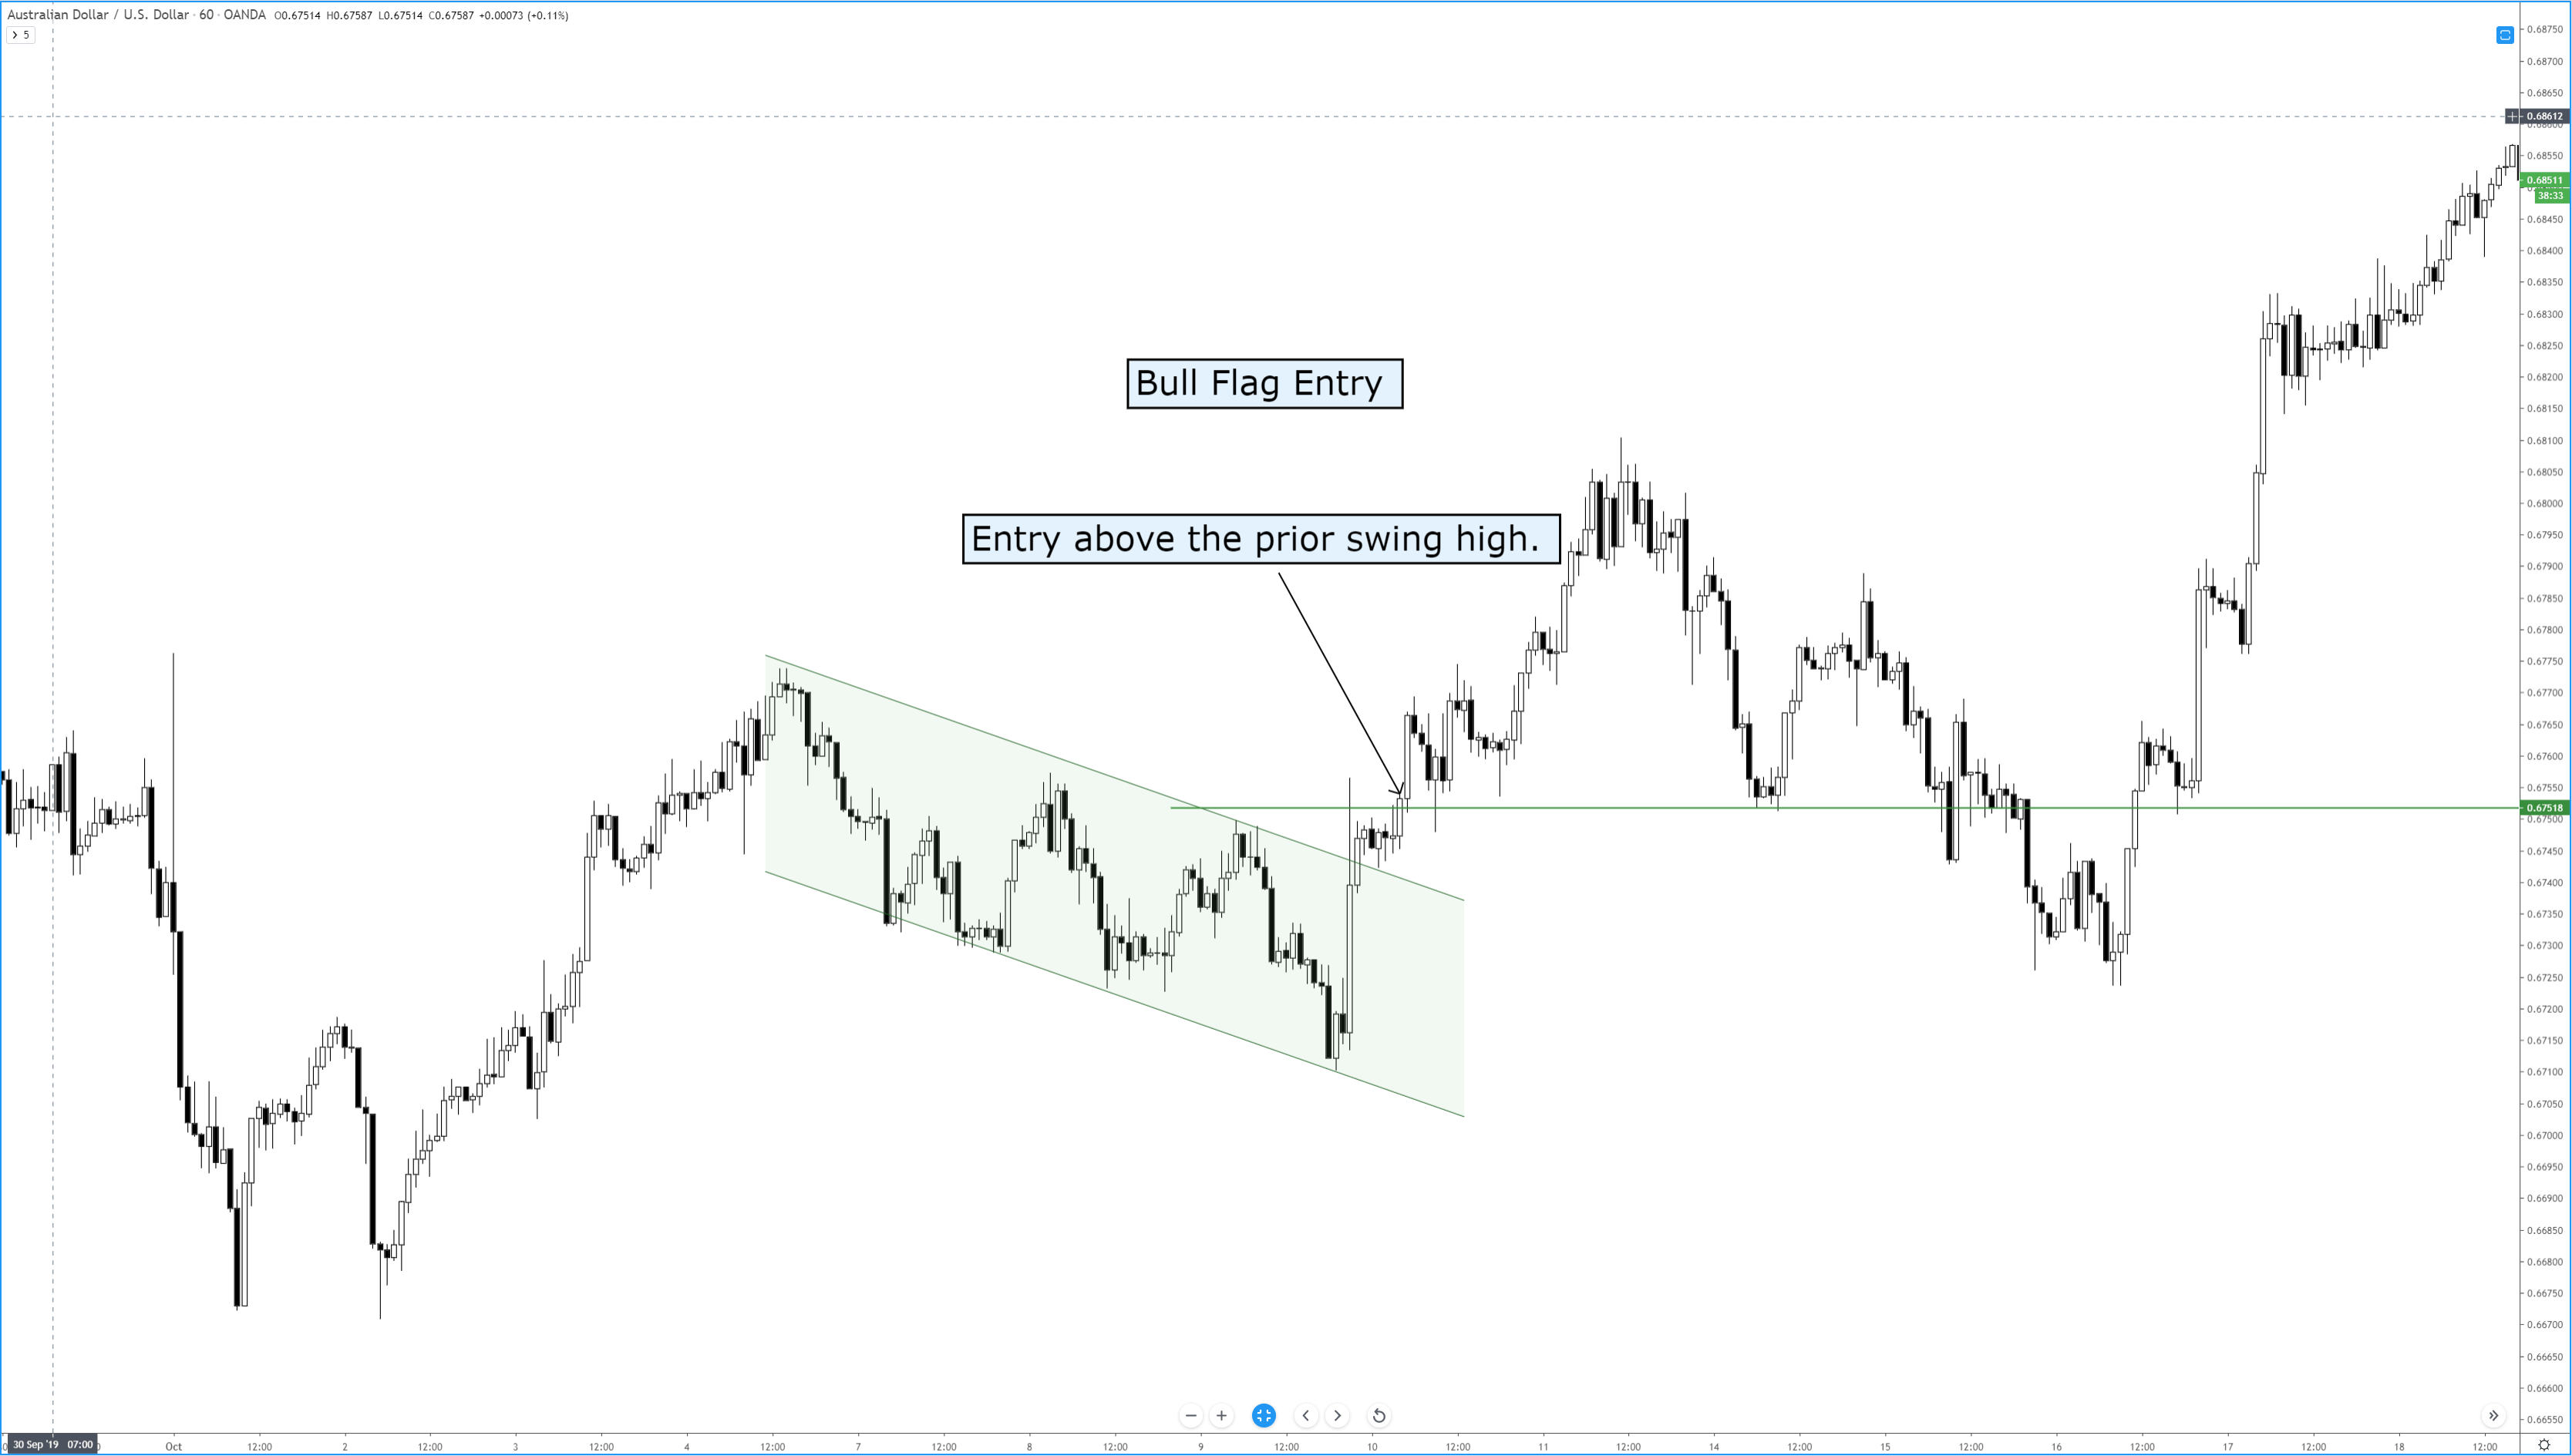
If you’ve ever traded a chart and you’ve seen what looks like a reversal in the trend, but as soon as you enter the trend seems to continue, odds are you were trading against a continuation pattern. Flags and pennants are titles given to patterns that show up as small countertrend moves that ultimately trap participants and then use their momentum to keep the price moving in the direction of the trend. Flags are represented as rectangular channels, and pennants are represented as triangles.
Before a flag or pennant can be identified, we first need a flag pole. A flag pole is any clear trending price action that, well, looks like a pole. See below:
Flags and Pennants
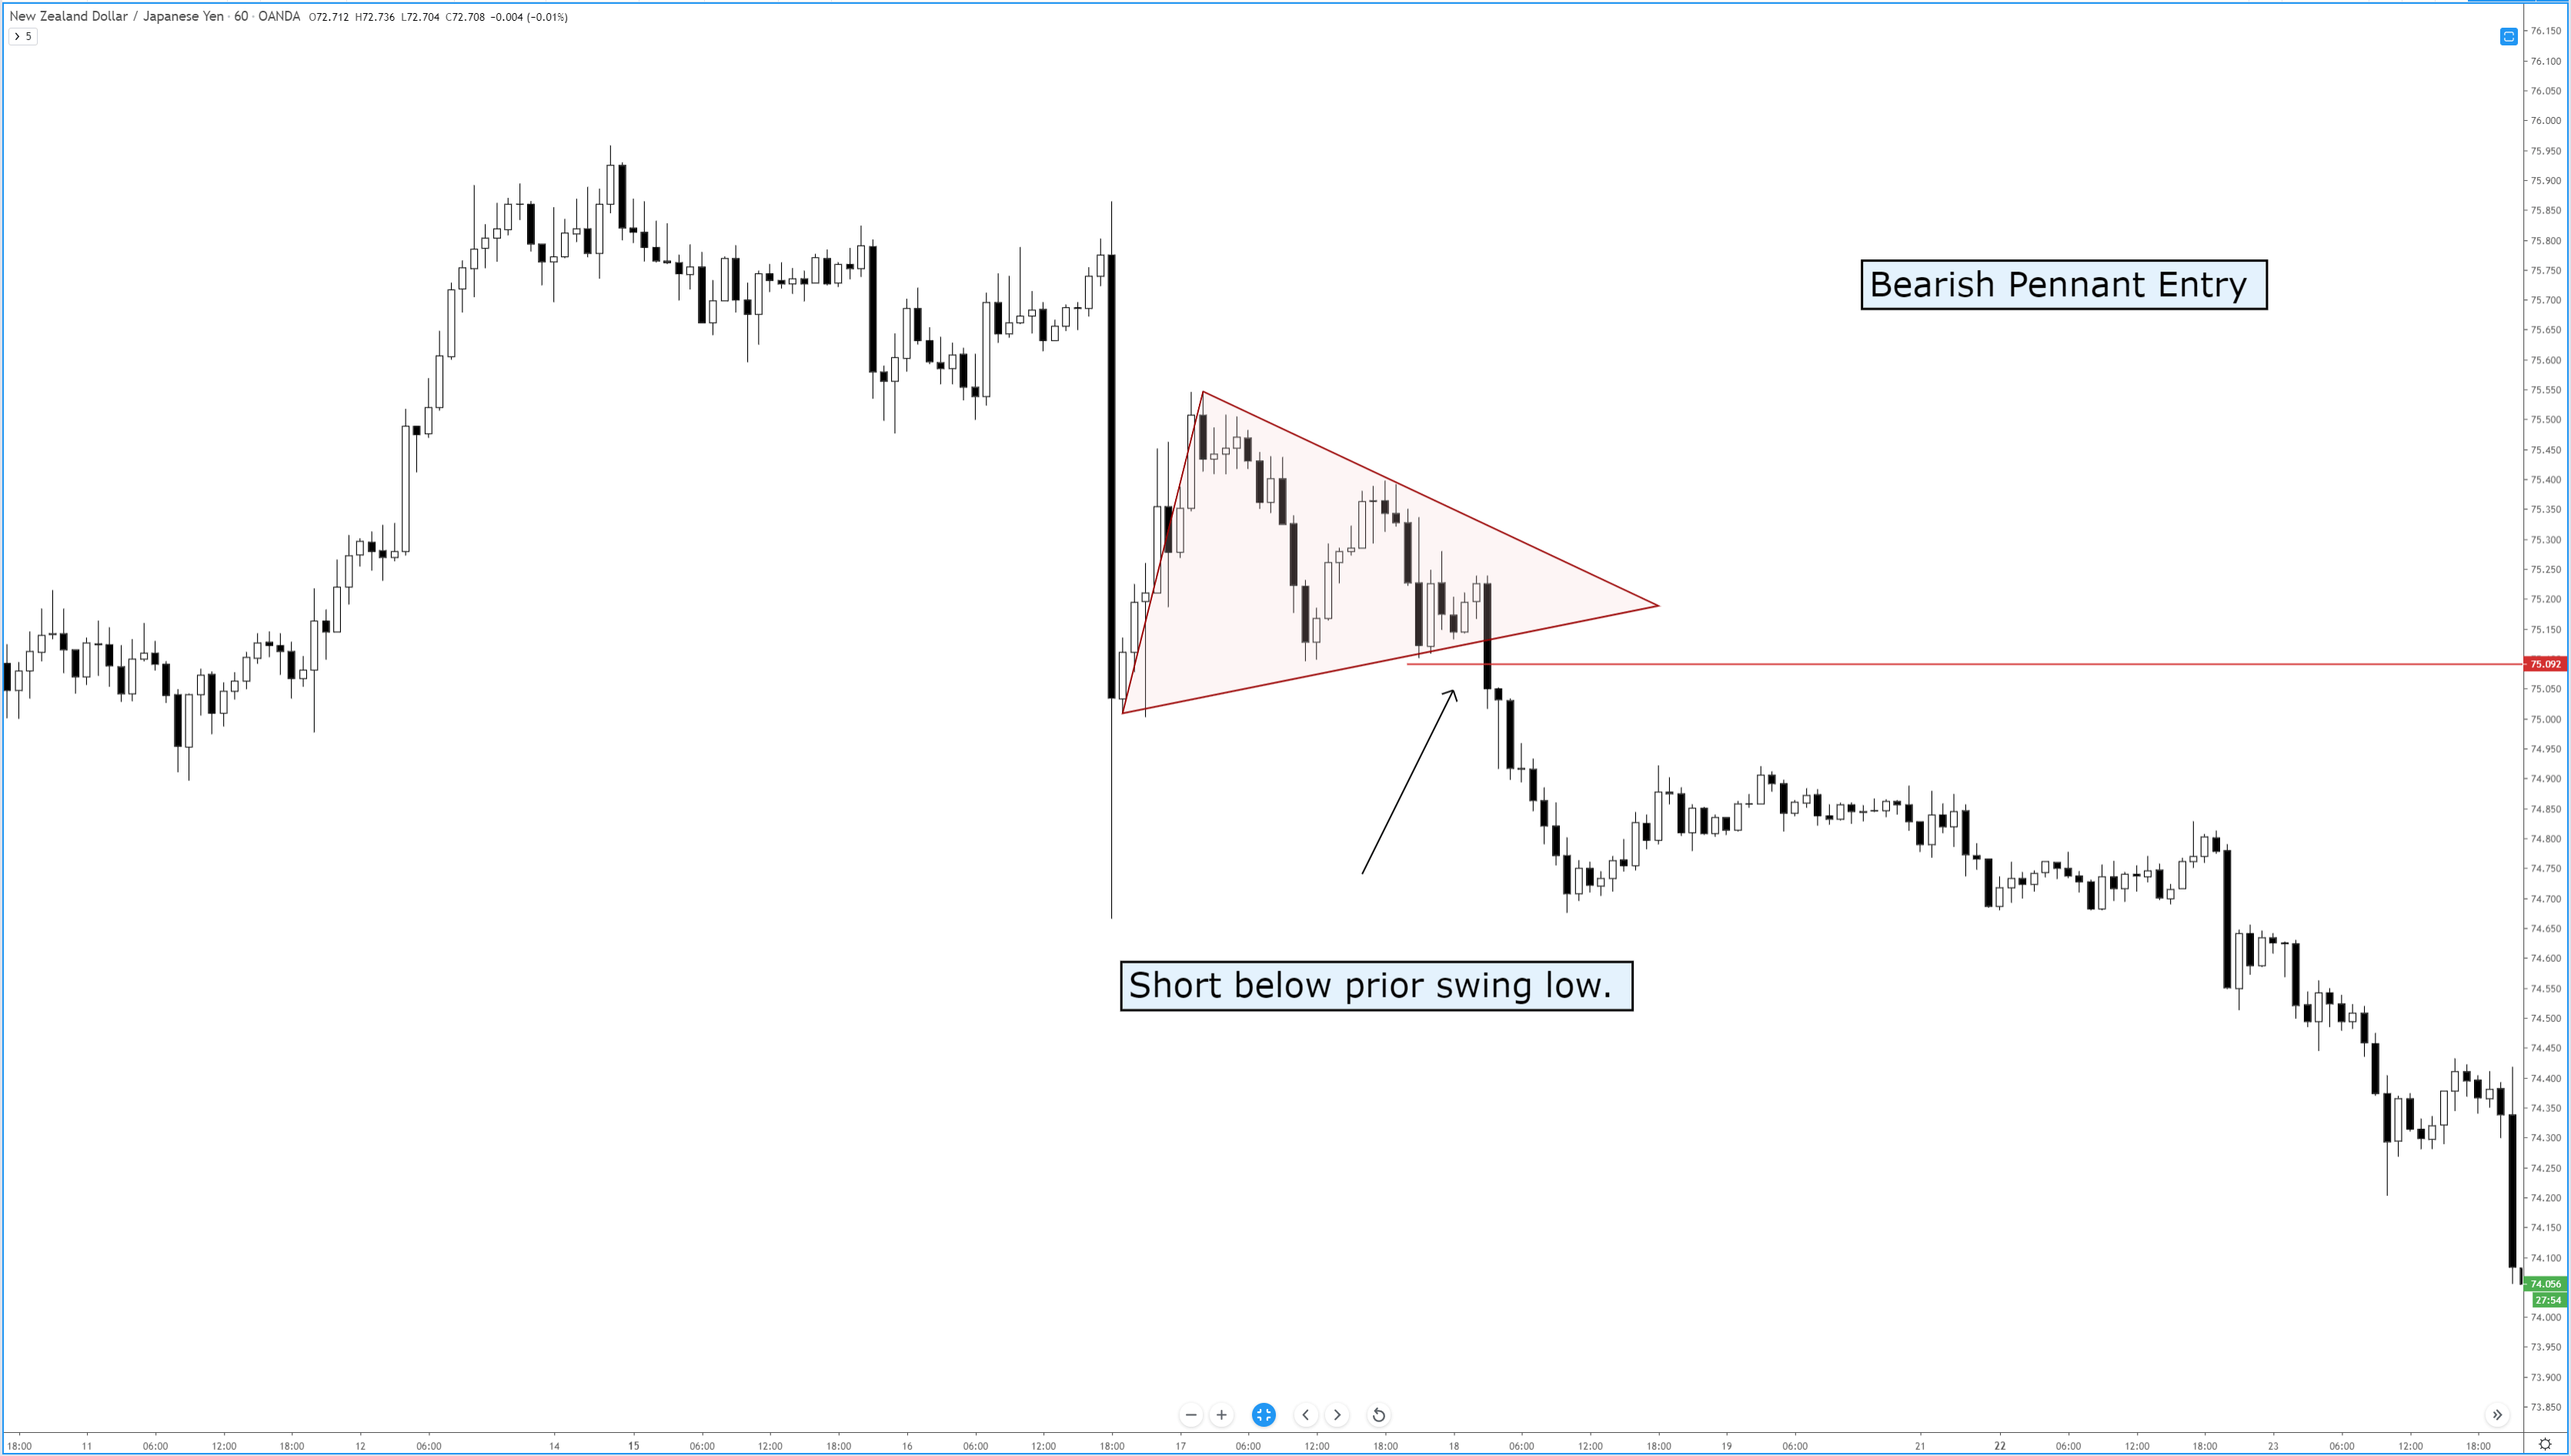
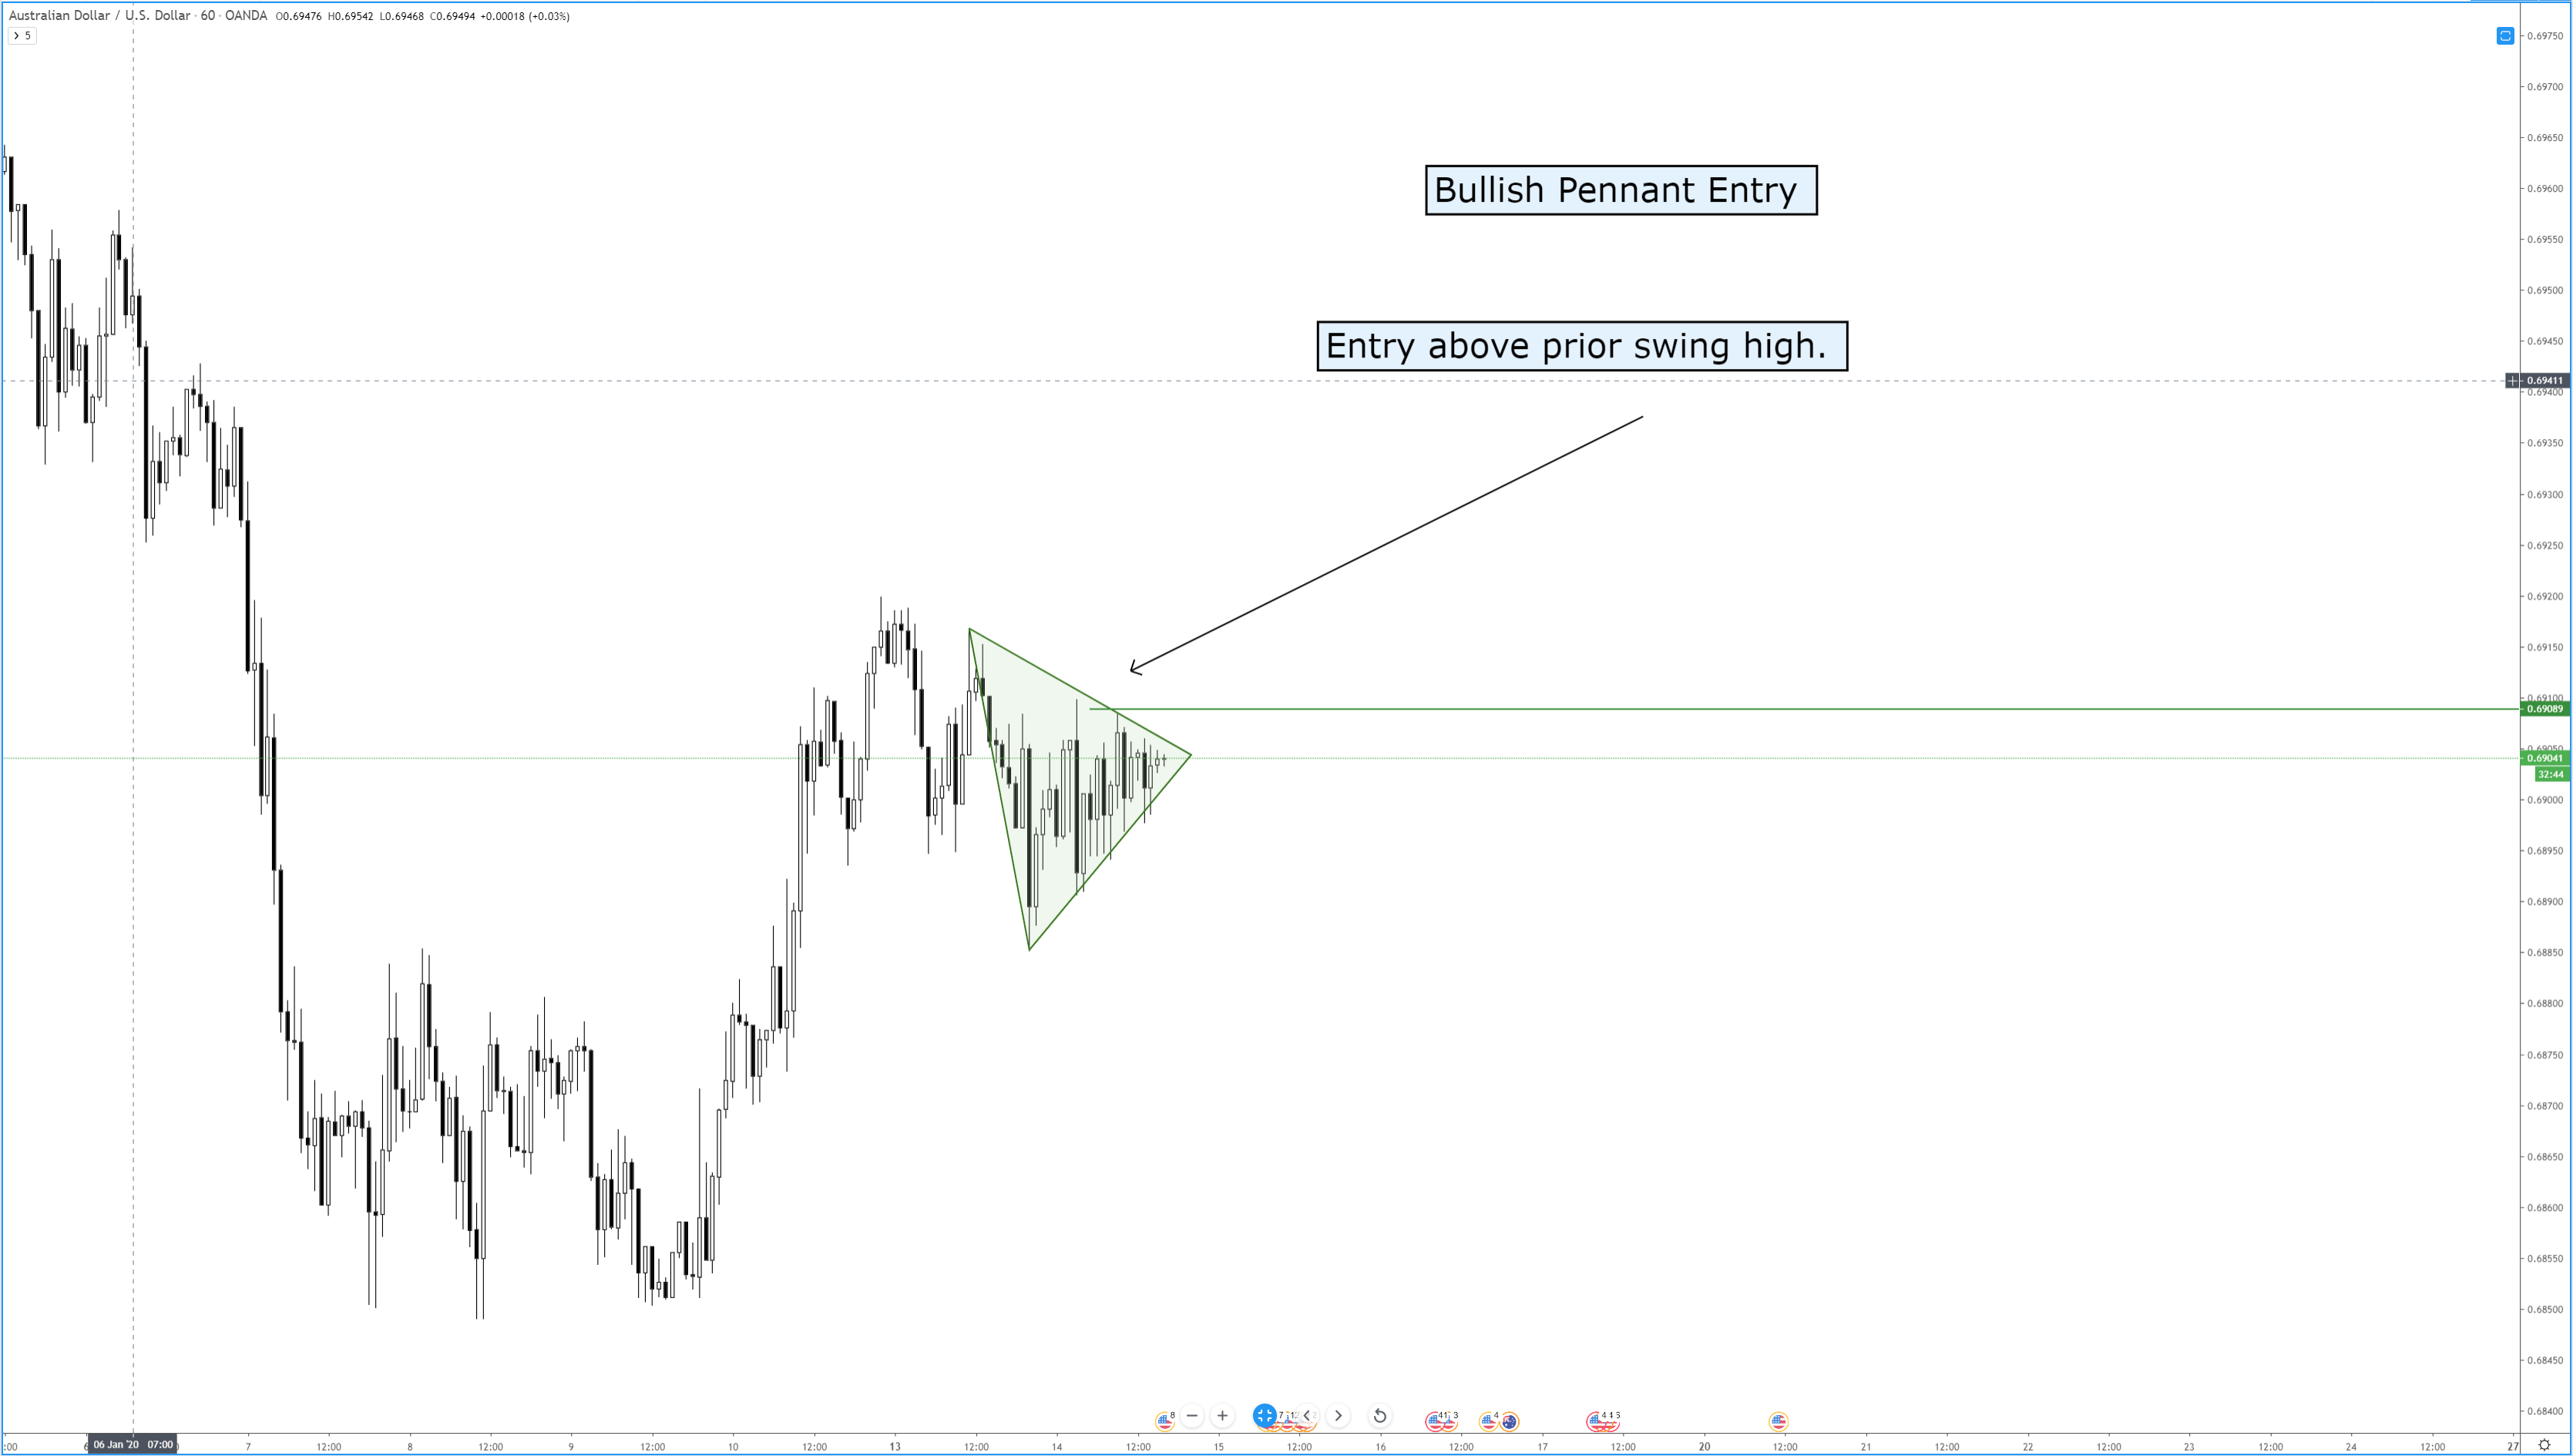
The images above show examples of bearish flags and bearish pennants, as well as bullish flags and bullish pennants. If you are unfamiliar with how to trade triangles or rectangles, refer to the articles that discuss the various triangle patterns. But we can review the basics of entering these great continuation patterns.
Bearish PennantBear FlagBullish PennantBull Flag
Learning how to trade flags and pennants is one of the most useful and enjoyable things that you can learn – especially as a new trader. Flags and pennants help train your brain to get used to buying dips during bull runs and shorting rallies during bear moves. If you get to a point where you can profitably trade flags and pennants, then you have transitioned into a trader who is very near outperforming the vast majority of your peers. It may seem like an easy thing to do – but it is an entirely different thing to execute. Analyzing and identifying a flag or pennant is easy; trading it is difficult.
I can not stress enough how profitable these patterns can be – and how easily you can miss them even in plain sight. The problem resides with your brain – that ‘lizard’ part that kicks in when you are are fearful of your account. When you begin to feel the fear of your account losing money, that triggers a powerful part of your brain known as the limbic system. The limbic system controls fear and pleasure. And when your fear sense is triggered, it hyper focuses the synapsis across your brain. Things that you would passively identify like flags and pennants are tertiary in their importance when the limbic system is acting in your defense. You need to find ways to ‘pause’ the process with things like alerts. On the images above, you saw horizontal lines above prior swing highs and below prior swing lows. Placing alerts at those points may be enough to interrupt your primary fear response and allow you to make money on your emotions.
Because if you are feeling it, so is everyone else.
Sources:
Kirkpatrick, C. D., & Dahlquist, J. R. (2016). Technical analysis: the complete resource for financial market technicians. Upper Saddle River: Financial Times/Prentice Hall.
Bulkowski, T. N. (2013). Visual guide to chart patterns. New York, NY: Bloomberg Press.
Bulkowski, T. N. (2008). Encyclopedia of candlestick charts. Hoboken, NJ: J. Wiley & Sons.
Bulkowski, T. N. (2002). Trading classic chart patterns. New York: Wiley.
Ichimoku Kinko Hyo Guide – A walk through a trade.
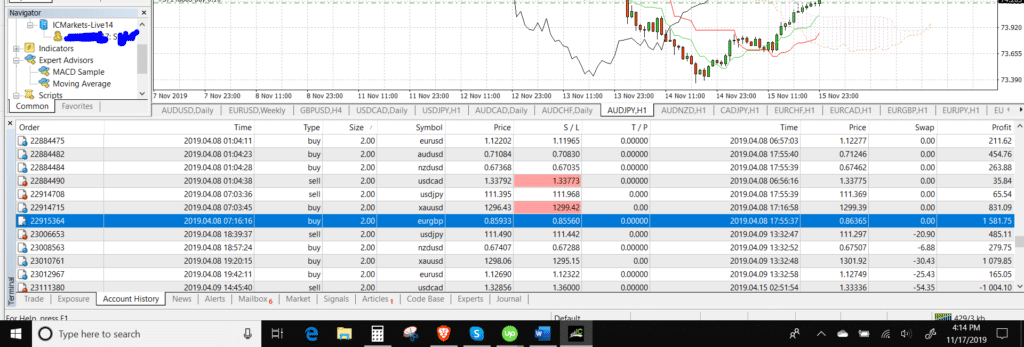
I want to preface this guide with a screenshot of my account.
Trade History
The screenshot is a series of some of the trades I’ve made in early April 2019. I do this because this guide on trading with Ichimoku will target the trade that is highlighted. Additionally, I think it is important that if I am showing you an example of a trade for a guide, I should show that I had skin in the game. There are a great many guides and strategies that authors, analysts, and traders suggest, but few will share if they took the trade. The highlighted trade for the EURGBP is the trade I will be using for this guide. It is a great example of the trading methodology I use with the Ichimoku System.
Multiple Timeframe Analysis – Daily, 4-Hour, and 1-Hour
The Ichimoku Kinko Hyo system is most effective when utilizing multiple timeframes. It is the only way that I use the Ichimoku system. In my trading, I use the Daily, 4-hour, and 1-hour time frames. Multiple timeframes are extremely useful in filtering your trade entries and ensuring higher probability trade setups. The process below will go through the process I used to take the trade.
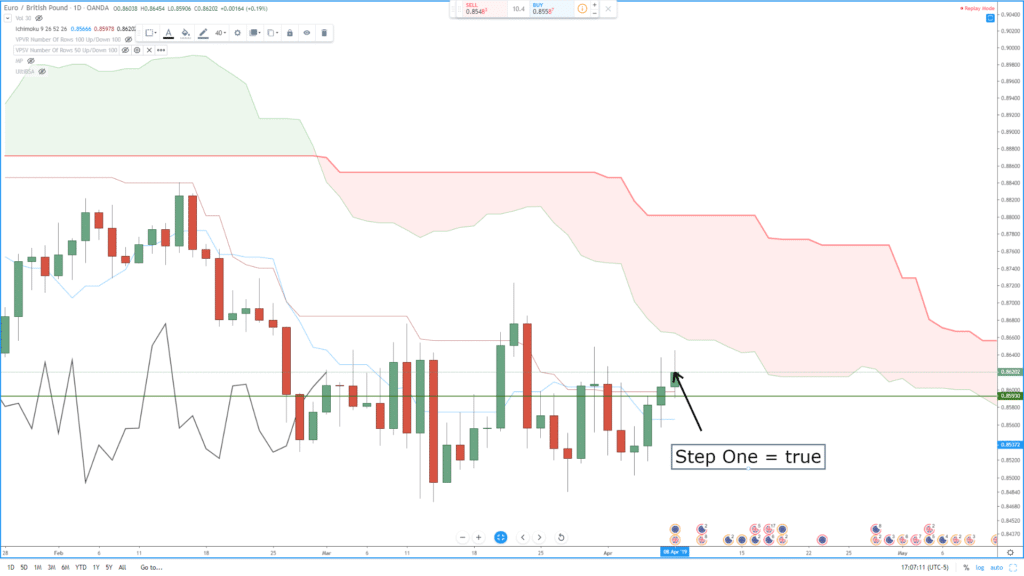
Step One – Daily Chart Check: Price greater than Kijun-Sen, NOT inside the Cloud.
Step One – Check Daily Cloud
The very first thing I check is the daily chart. If the price is inside the Cloud on the daily chart, I skip the chart. It’s dead to me. If the price is not inside the Cloud, I then look for where the price is in relation to the Kijun-Sen. The daily chart determines my trading direction. If the price is above the Kijun-Sen, I only take long trades. If the price is below the Kijun-Sen, I only take short trades.
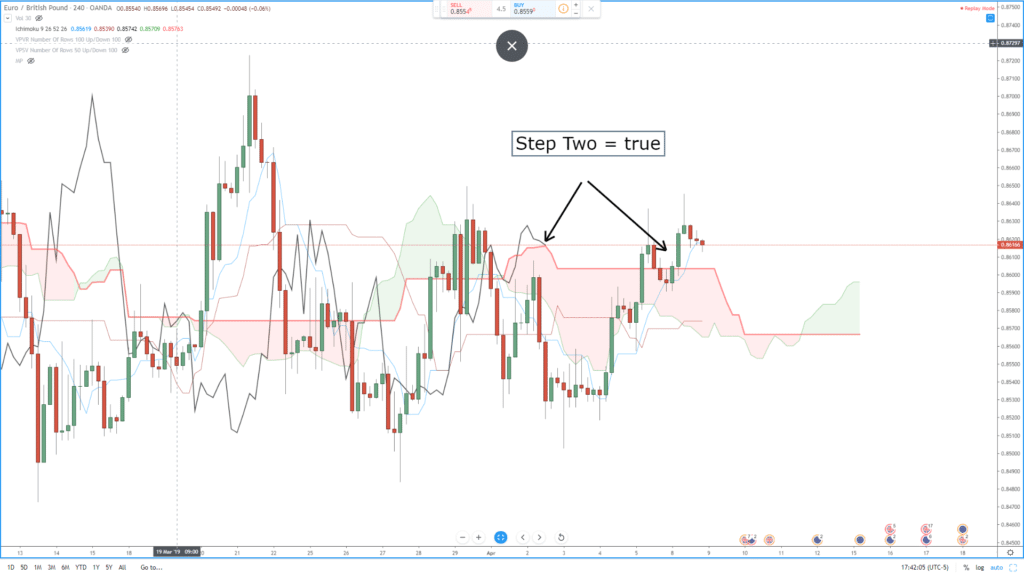
Step Two – 4-Hour Chart Check: Price above the Cloud, Chikou Span above candlesticks.
Step Two – Check the 4-hour chart.
If the daily chart determines the direction of my trading, the 4-hour provides the filter for the entry chart (the 1-hour chart). The only things I am concerned about with the 4-hour chart is that the Chikou Span is above the candlesticks, and that price is above the Cloud. Preferably, the Chikou Span would also be in ‘open space’ – but I don’t use it as a hard rule. I have not found the open space to be as important during the change of a trend or corrective move.
(a note about ‘Open Space’ – Open Space is a condition where the Chikou Span won’t intercept any candlesticks over the next five to ten trading periods. When the Chikou Span is in open space, this represents ease of movement in the direction of the trend with little in the form of resistance (or support) ahead.)
The EURGBP trade we are analyzing is a good example of why, at the current position, I don’t consider the open space as strict as I would on the hourly. I want to refer you back to the daily chart. If, on the daily chart, both price and the Kijun-Sen are below the daily cloud, but price moves above the Kijun-Sen – I don’t consider the open space variable as important on the 4-hour chart.
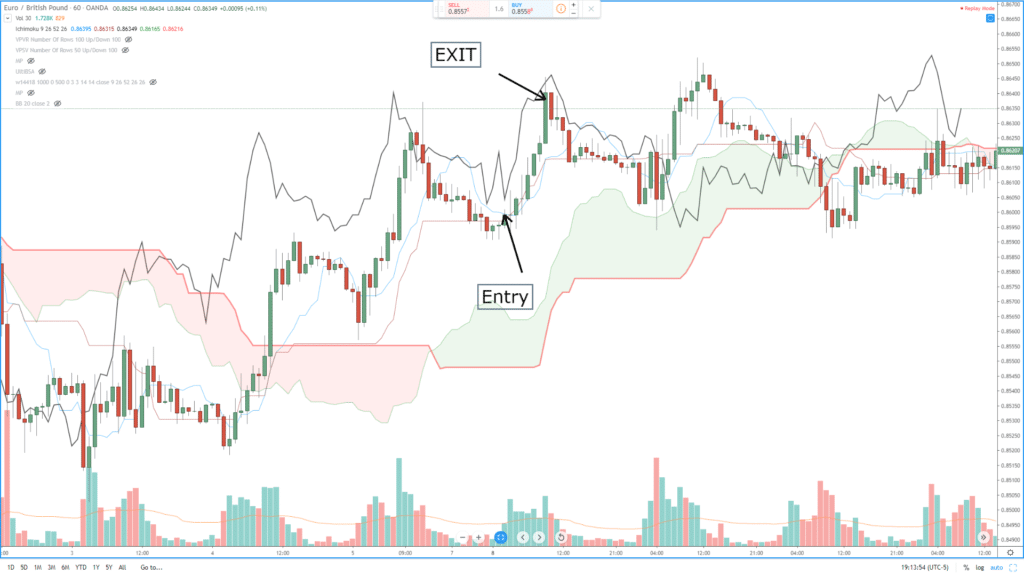
Step Three – 1-Hour Chart Check
Step Three – 1-hour Entry
The 1-Hour chart is my entry chart. As long as Step One and Step Two are true, the 1-hour chart is where the bread and butter of the trading occurs. My entry rules are this:
Future Span A is greater than Future Span B.
Chikou Span above the candlesticks and in ‘open space’ – for five periods.
Price is greater than the Tenkan-Sen and Kijun-Sen.
I generally look for a profit target of 20-40 pips, depending on the FX pair. For example, on the NZDUSD, I would look for 20 pips, and on the GBPNZD, I would look for 40 pips. But there are some hard technical reasons to leave a trade before that profit target is hit. The list below represents my exit rules on the 1-hour Chart – I exit the trade if any of these conditions occur.
Exit if Chikou Span below candlesticks for more than three consecutive candlesticks.
Exit if price enters the 1-hour Cloud.
Exit if Tenkan-Sen below the Kijun-Sen for more than five candlesticks.
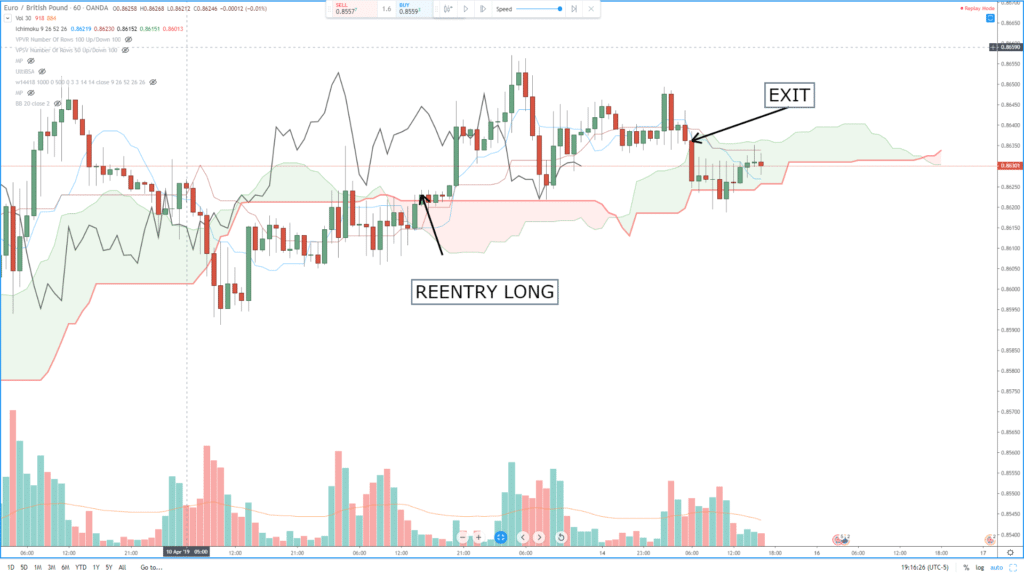
Step Four – Reentry Rules
Step Four – Reentry
Entry rules are fine, but the problem isn’t always finding the entry. One of the hardest problems is creating rules for re-entering a trade. Mine are as follows:
Tenkan-Sen and Kijun-Sen must be above the Cloud.
Chikou Span above the candlesticks.
Price greater than Kijun-Sen and Tenkan-Sen.
A quick summary of steps taken
Checked the daily chart, the price was above the daily Kijun-Sen. The trade direction is long/buy.
Check the 4-hour chart, the price was above the Cloud, and the Chikou Span was above the candlesticks.
All 1-hour rules confirmed an entry; profit taken at 40 pips.
Re-entered trade on 1-hour chart, exited when price entered the 1-hour Cloud.
Sources: Péloille, Karen. (2017). Trading with Ichimoku: a practical guide to low-risk Ichimoku strategies. Petersfield, Hampshire: Harriman House Ltd.
Patel, M. (2010). Trading with Ichimoku clouds: the essential guide to Ichimoku Kinko Hyo technical analysis. Hoboken, NJ: John Wiley & Sons.
Linton, D. (2010). Cloud charts: trading success with the Ichimoku Technique. London: Updata.
Elliot, N. (2012). Ichimoku charts: an introduction to Ichimoku Kinko Clouds. Petersfield, Hampshire: Harriman House Ltd.