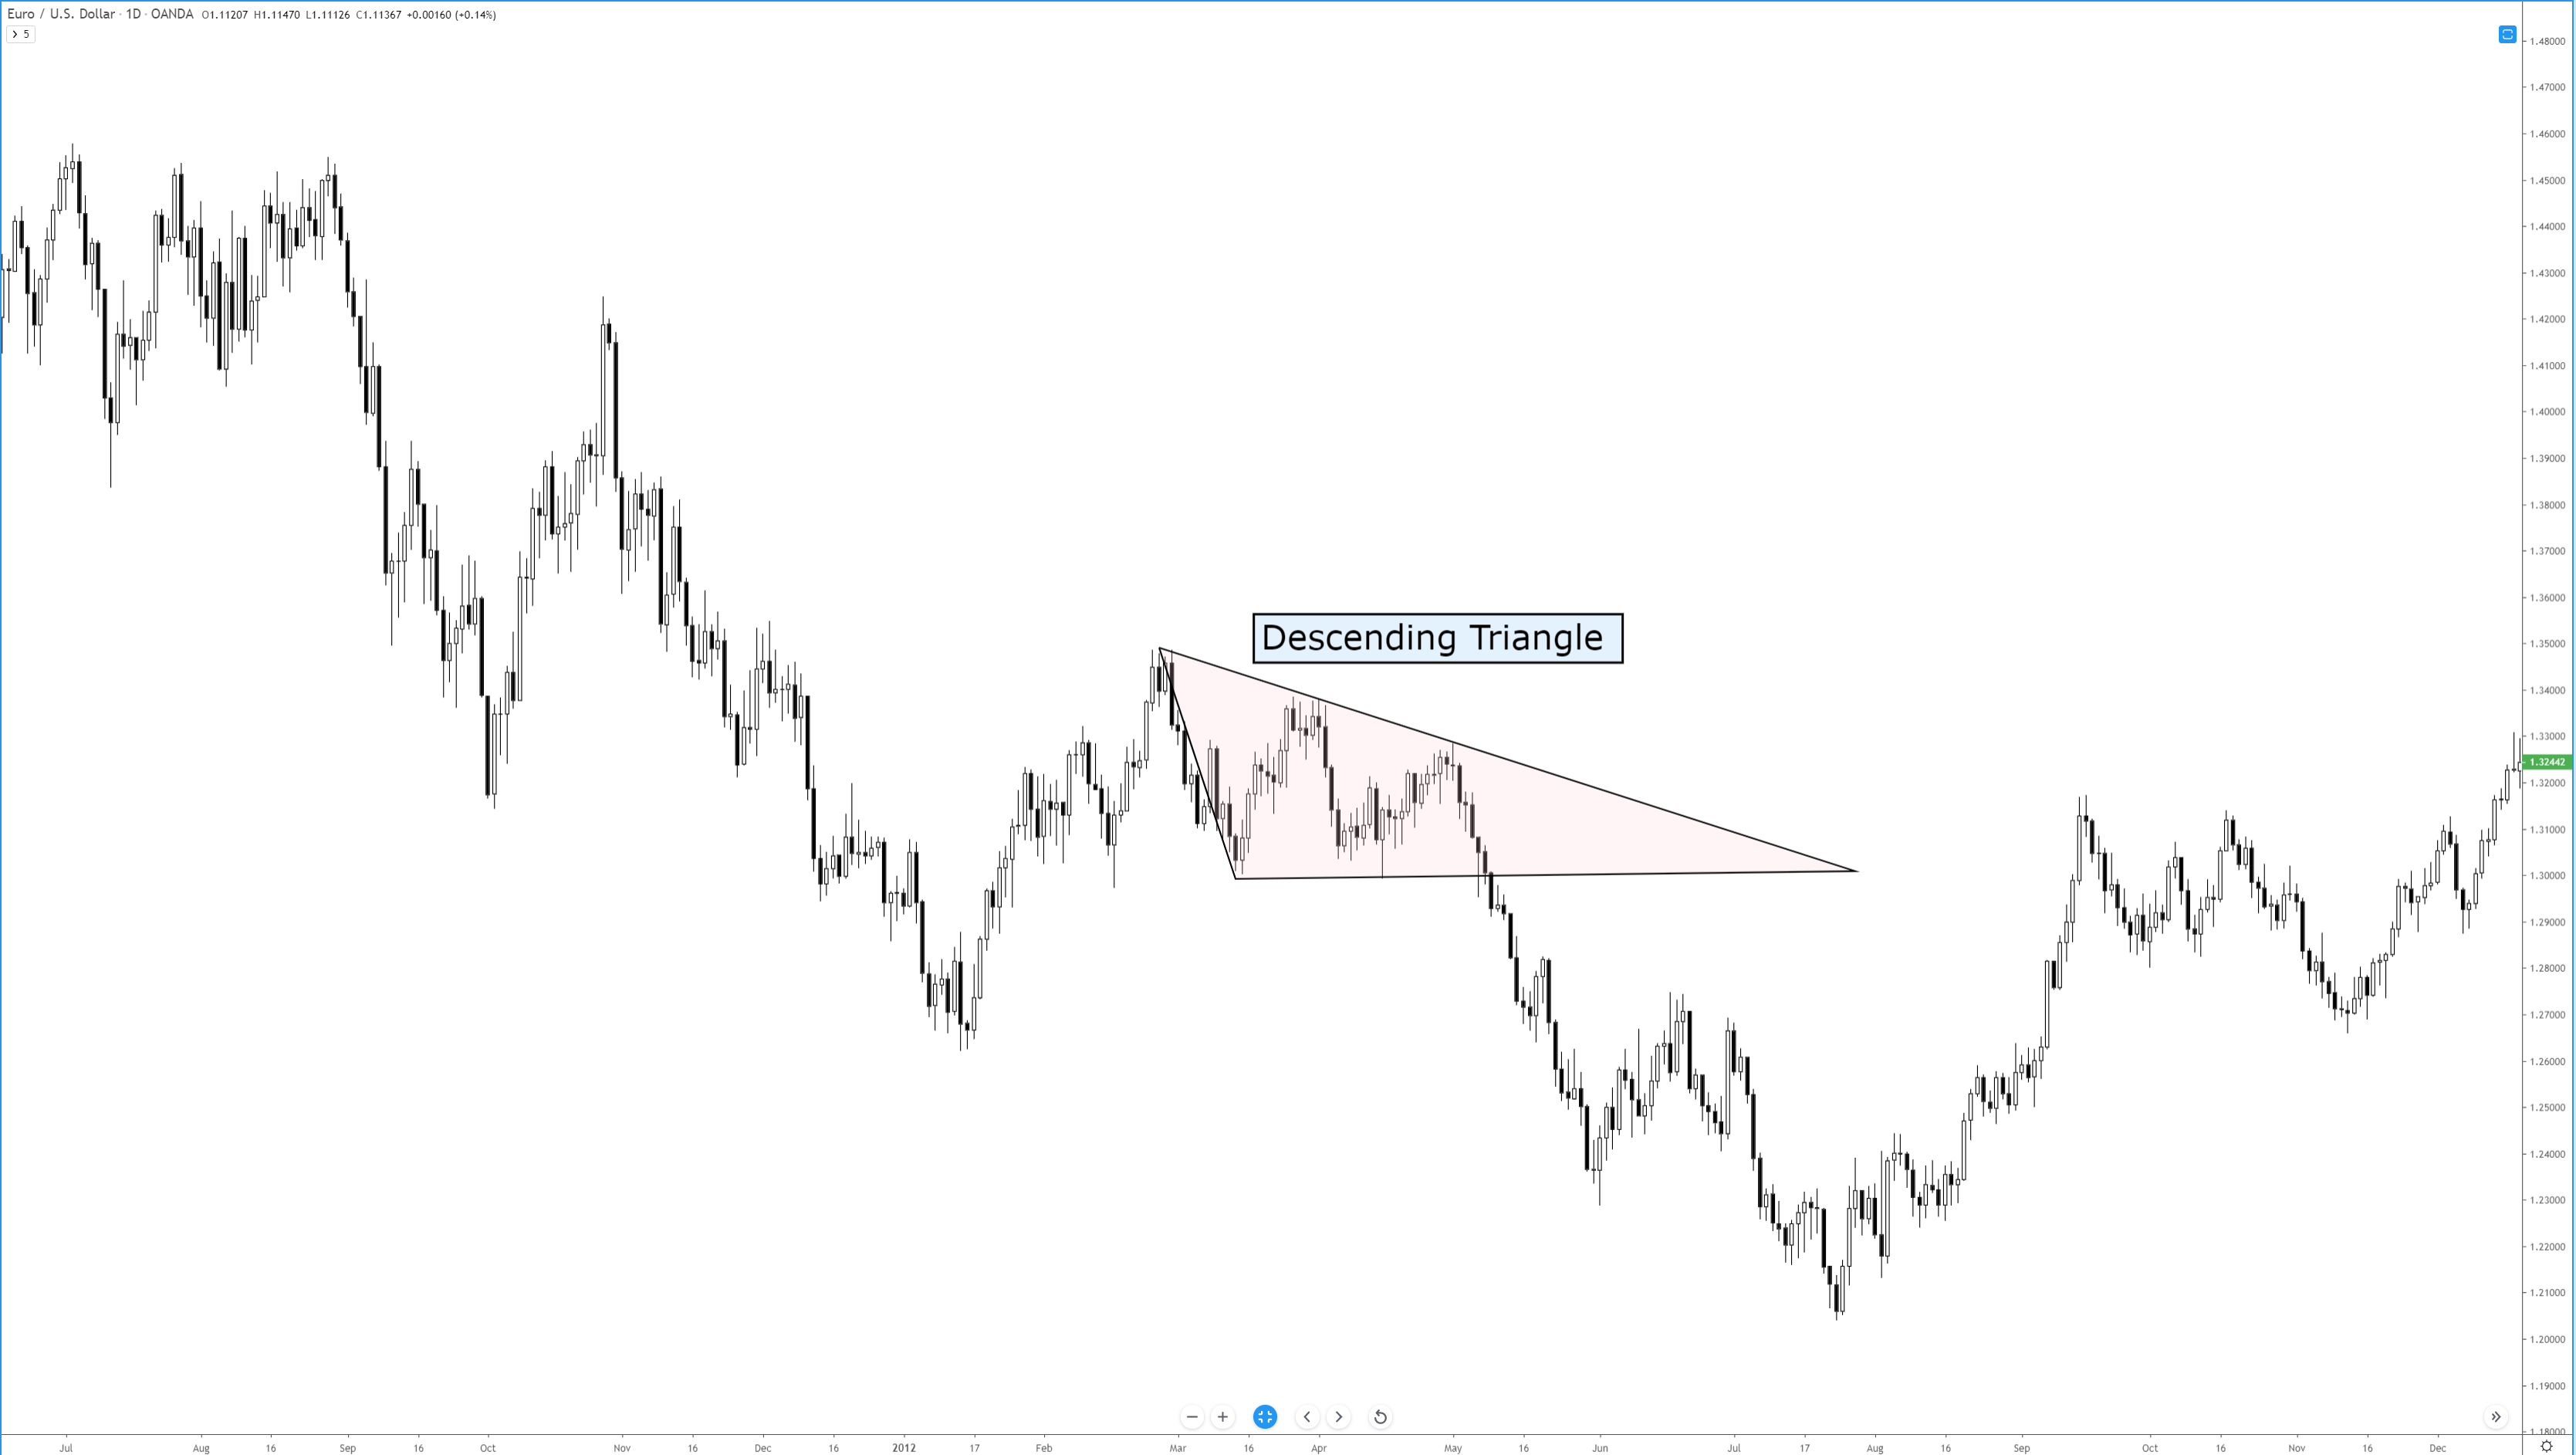
The descending triangle is another version of the many triangle patterns in technical analysis. It is the opposite of the ascending triangle. This pattern is overwhelmingly bearish and is one of the more common bearish continuation patterns. If you’ve read Dahlquist and Kirkpatrick’s Technical Analysis, you will find that this pattern is treated with some considerable positivity. It was one of the best-performing patterns. But there is a caveat to why this is.

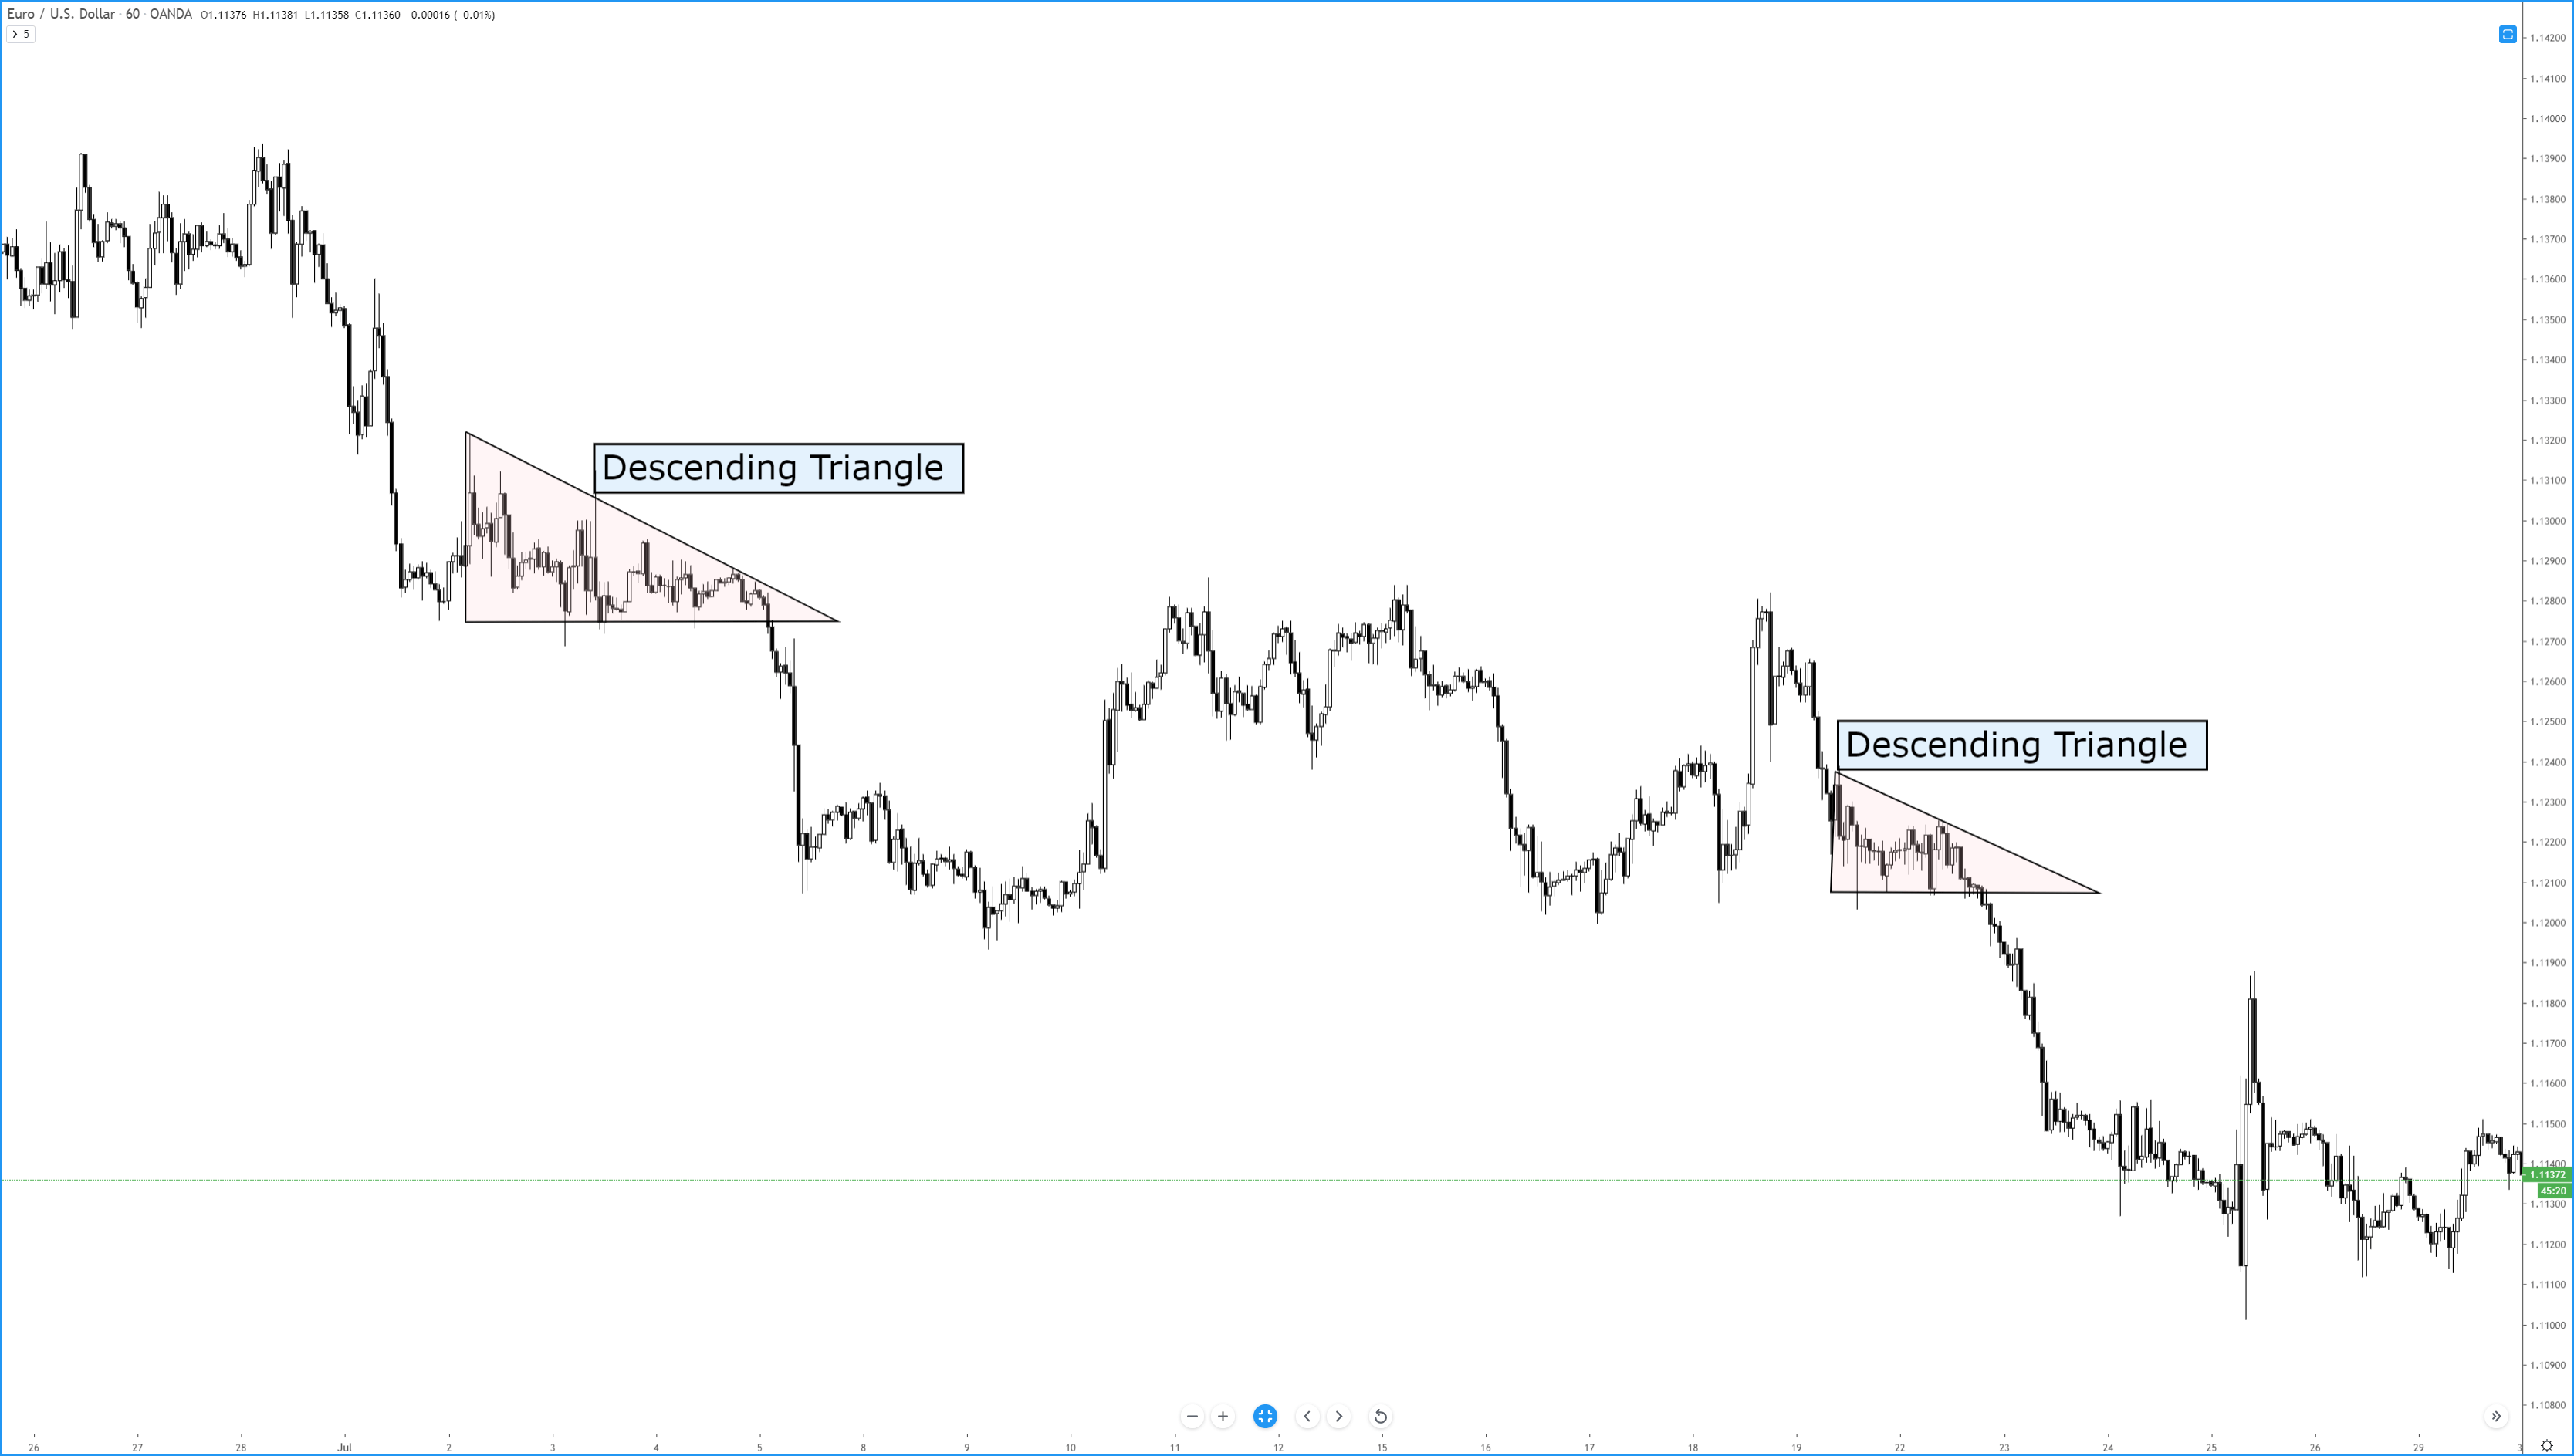
The two trendlines required for the formation of a descending triangle are a flat, horizontal trendline that acts as support with a downward sloping trendline that acts as resistance. Ideally, price should touch both the upper and lower trendlines twice. Volume typically decreases as price gets closer to the apex. Breakouts occur within the final 1/3rd of the pattern. Dahlquist and Kirkpatrick report that increasing volume is actually more favorable for this pattern. The most common breakout is lower at 64% of the time.
I’ve written in prior articles about the dangers of putting to much stock into technical analysis books where the initial testing of patterns and results have been in traditional equity markets (stock markets). I believe that one of the reasons that Dahlquist and Kirkpatrick have reported such powerful and swift moves with a downward breakout is due to the nature of bear moves in equity markets. Because markets like the stock market are exceedingly long-biased, any dramatic drop below crucial support will have an exceedingly more dramatic move when compared to the forex markets – which are primarily range bound. Another factor that may attribute to the overperformance of this pattern in stock markets vs. forex markets is the ease of shorting in forex vs. the stock market.
Sources:
Kirkpatrick, C. D., & Dahlquist, J. R. (2016). Technical analysis: the complete resource for financial market technicians. Upper Saddle River: Financial Times/Prentice Hall.
Bulkowski, T. N. (2013). Visual guide to chart patterns. New York, NY: Bloomberg Press.
Bulkowski, T. N. (2008). Encyclopedia of candlestick charts. Hoboken, NJ: J. Wiley & Sons.
Bulkowski, T. N. (2002). Trading classic chart patterns. New York: Wiley.