Description
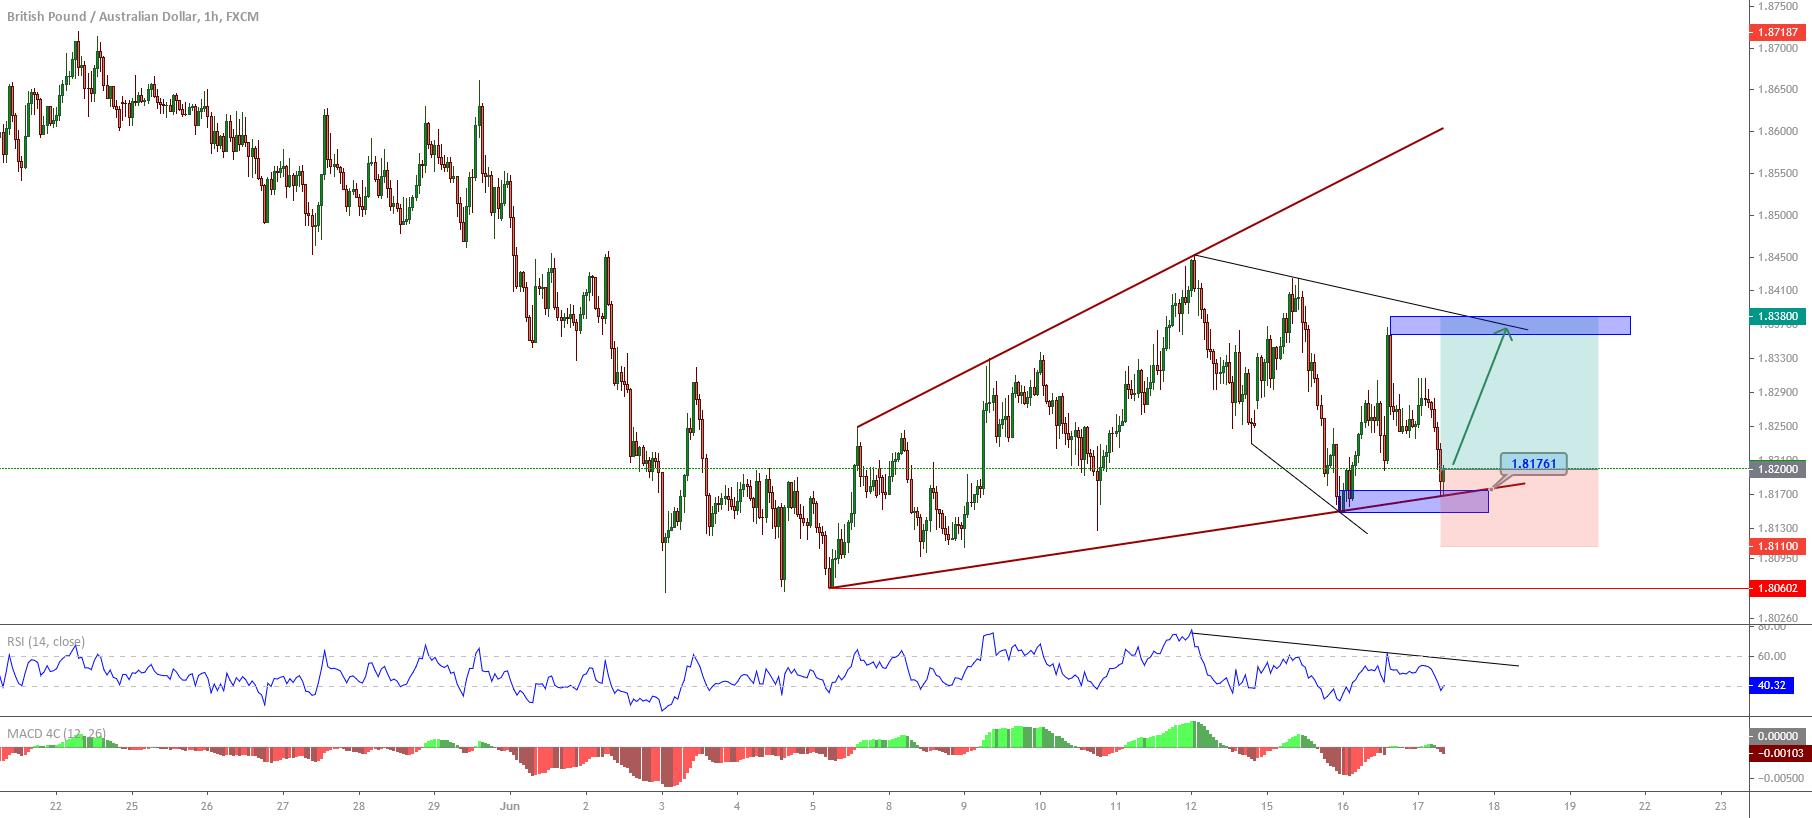
The GBPAUD price in its hourly chart exposes the progress in an ascending expanding triangle, which began on the low of June 05th at 1.8060 when the cross found fresh buyers.

The overlapped upward sequence boosted until 1.8452 reached on June 12th when the cross found resistance at the zone of previous June 02nd high reacting mostly bearish starting a corrective movement in a three-wave sequence.
The end of the three-wave corrective sequence found support on June 16th at 1.8148 from where the price action revealed the bullish incorporation of institutional participants, which on Wednesday trading session dragged the price to the zone of 1.8176 in where the price started to show bullish incorporations.
Considering the Elliott wave theory’s alternation principle, we expect a rally that should boost the price to fresh higher highs in the following trading sessions.
A buy-side position will activate at 1.8200 as psychological support; our short-term target locates at 1.8380, this level coincides with the previous high of June 16th, representing an intraday resistance. If the bullish momentum surpasses this resistance, we will expect further raises. The invalidation level of the scenario locates at 1.8110.
Chart
Trading Plan Summary
- Entry Level: 1.8200
- Protective Stop: 1.8110
- Profit Target: 1.8380
- Risk/Reward Ratio: 2
- Position Size: 0.01 lot per $1,000 in trading account.