Description
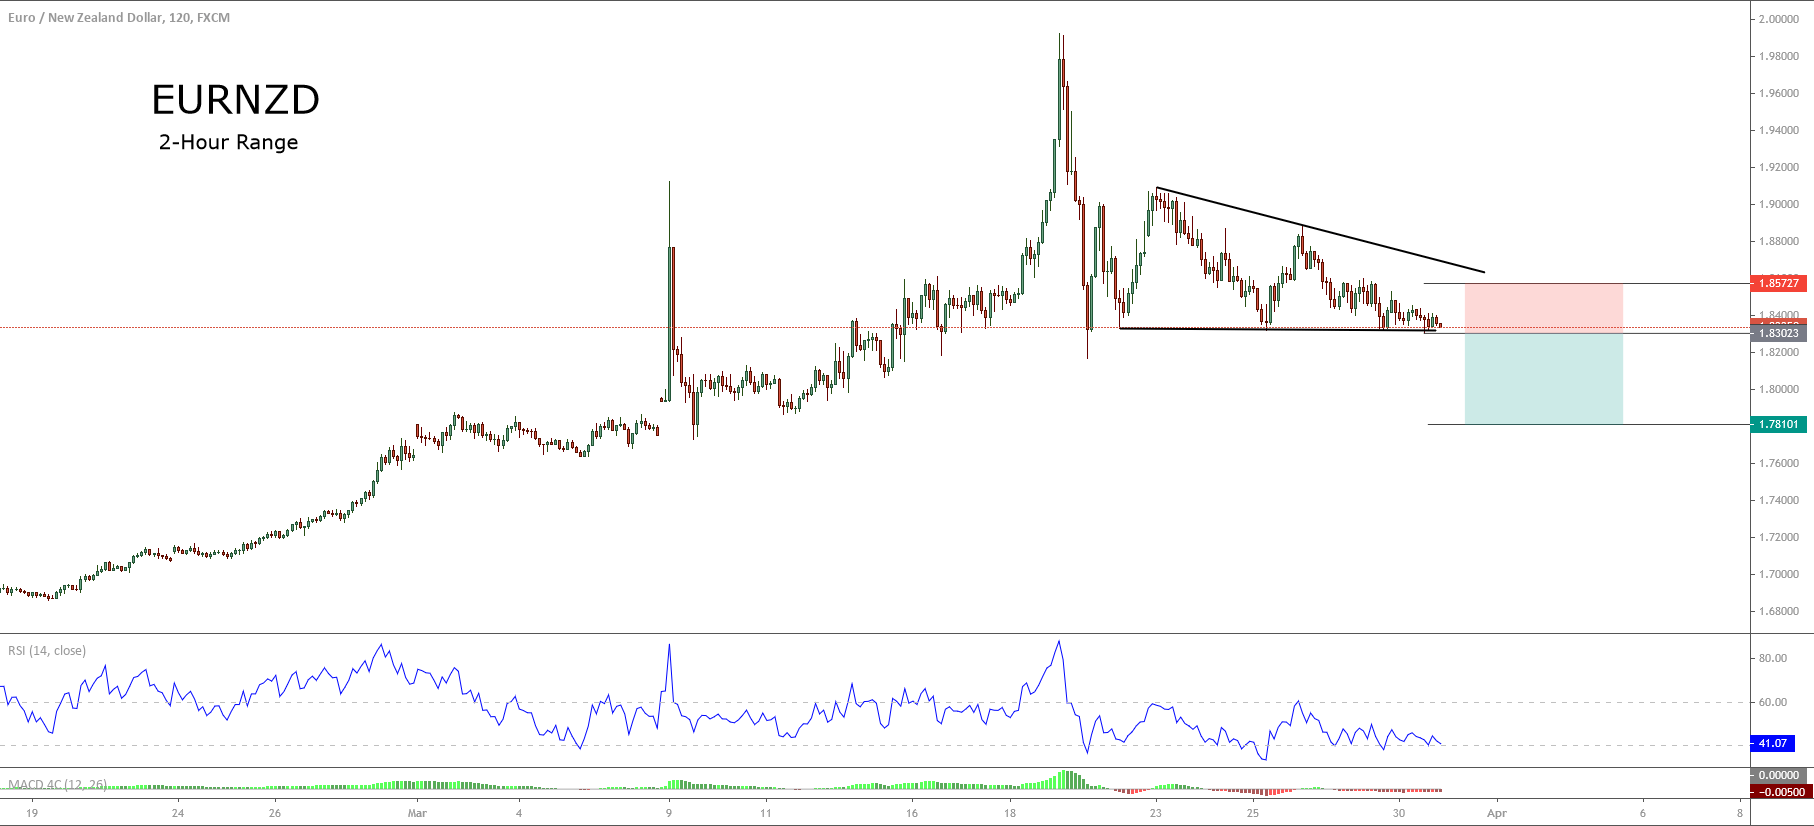
The EURNZD cross in its 2-hour chart shows the progress as a triangle pattern. The corrective structure suggests the possibility of bearish continuation.

On the other hand, the RSI oscillator that moves near to level 40 makes us foresee that the bias remains in the bearish side. In consequence, a breakdown and close under the previous lows would confirm the sell setup.
A sell position will activate if the price breaks and closes below level 1.83023. In our conservative scenario, we expect a potential decline target at 1.78101. The level that invalidates our downward scenario locates at 1.85727.
Chart
Trading Plan Summary
- Entry Level: 1.83023
- Protective Stop: 1.85727
- Profit Target: 1.78101
- Risk/Reward Ratio: 1.82 to 1
- Position Size: 0.01 lot per $1,000 in account.


One reply on “EURNZD – Watch this Breakdown”
Was nice