Categories
Forex Elliott Wave Forex Market Analysis

EURNZD Consolidates after Bouncing from its Recent Lows

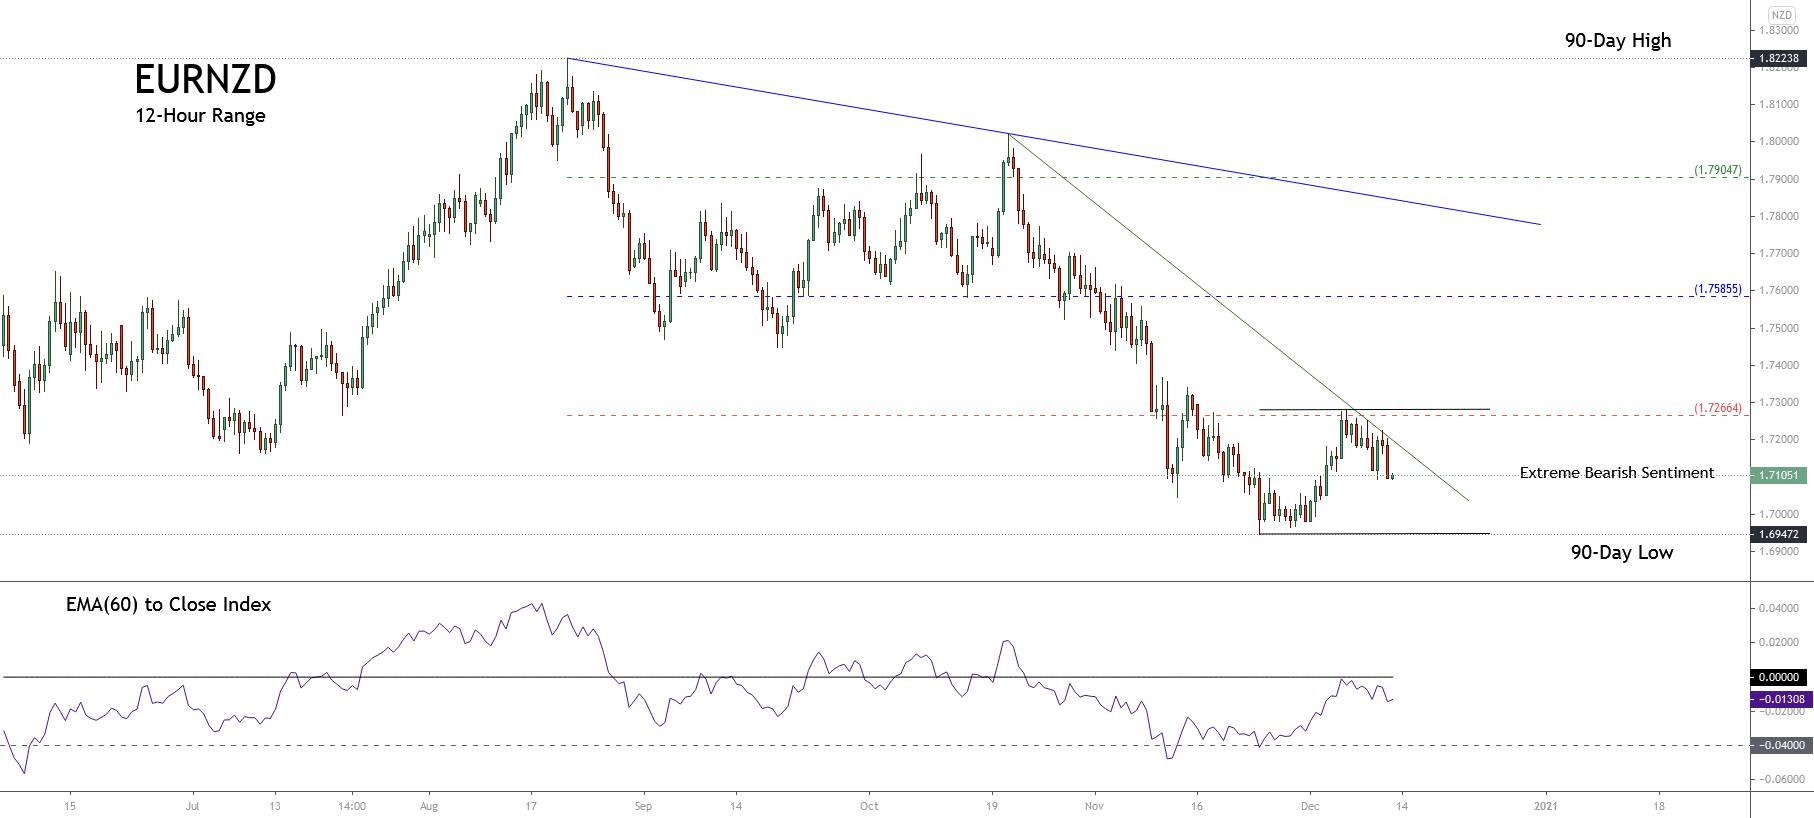
The EURNZD cross is seen consolidating near the extreme bearish sentiment zone backed by the strength of the New Zealand dollar. This consolidation suggests a pause of the downward sequence that began on August 20th and ended heavily oversold after its latest decline that drove it to 1.69472.

Technical Overview

The following 12-hour chart illustrates the short-term markets participants’ sentiment bounded by the 90 high and low range, which shows the price consolidating in the extreme bearish sentiment zone after the cross found support on 1.69472 on November 24th.

Furthermore, the previous chart shows the primary trend outlined a blue trend-line that tells the bias remains mostly bearish. Likewise, the secondary trend represented with the green trend-line exposes the downward acceleration, and, shows also its consolidation range between the levels of 1.69472 and 1.72664.

Finally, as long as the EURNZD cross keeps moving below level 1.72664, the bias will remain bearish, so we could expect further drops, likely below 1.69472. Whereas, the breakout of the extreme bearish zone of 1.72664 to the upside could indicate the start of a recovery.

Short-term Technical Outlook

The short-term outlook for the EURNZD cross under the Elliott Wave perspective is shown in the next 2-hour chart and seen moving in an incomplete downward sequence. The current leg in which is moving corresponds to the wave ((c)) of Minute degree labeled in black.  Within that wave ((c)), the price is advancing in its fourth wave of Minuette degree identified in blue.


We see all that the wave ((c)) of Minute degree labeled in black came after the completion of the wave ((b)), which ends on 1.80212 where the cross found fresh sellers dragging it in an accelerated bearish movement. In this context, the current wave ((c)) should develop an internal structure of five waves.

Right now, the chart shows the action is happening in its fourth wave, in blue, which could be advancing in its internal wave b of Subminuette degree identified in green. This leg could possibly test November’s lows. Likewise, considering that the third wave, in blue, looks like an extended wave, the fourth wave should be complex in price, time, or both. Therefore, the current corrective wave could continue evlving likely until early 2021.

Concerning the fifth wave, in blue, and considering that the third one of the same degree was the extended movement, there are two potential scenarios for the cross:

  • First scenario: the cross fails in its downward sequence finding fresh buyers above the end of the third wave, in blue, at 1.69472.
  • Second scenario: the cross penetrates below 1.69472, creating a new lower low. In this case, this new leg down could continue until the psychological barrier of 1.68.

In summary, the EURNZD cross currently moves in a corrective formation in the extreme bearish sentiment zone. In this context, our principal bias remains neutral until the completion of the fourth wave in blue. Once the cross ends the current consolidation, we could seek short positions following the direction of the fifth wave. Finally, the invalidation level of the bearish scenario locates at 1.73606.


Categories
Forex Elliott Wave Forex Market Analysis

Is NZDJPY ready for a New Upward Move?

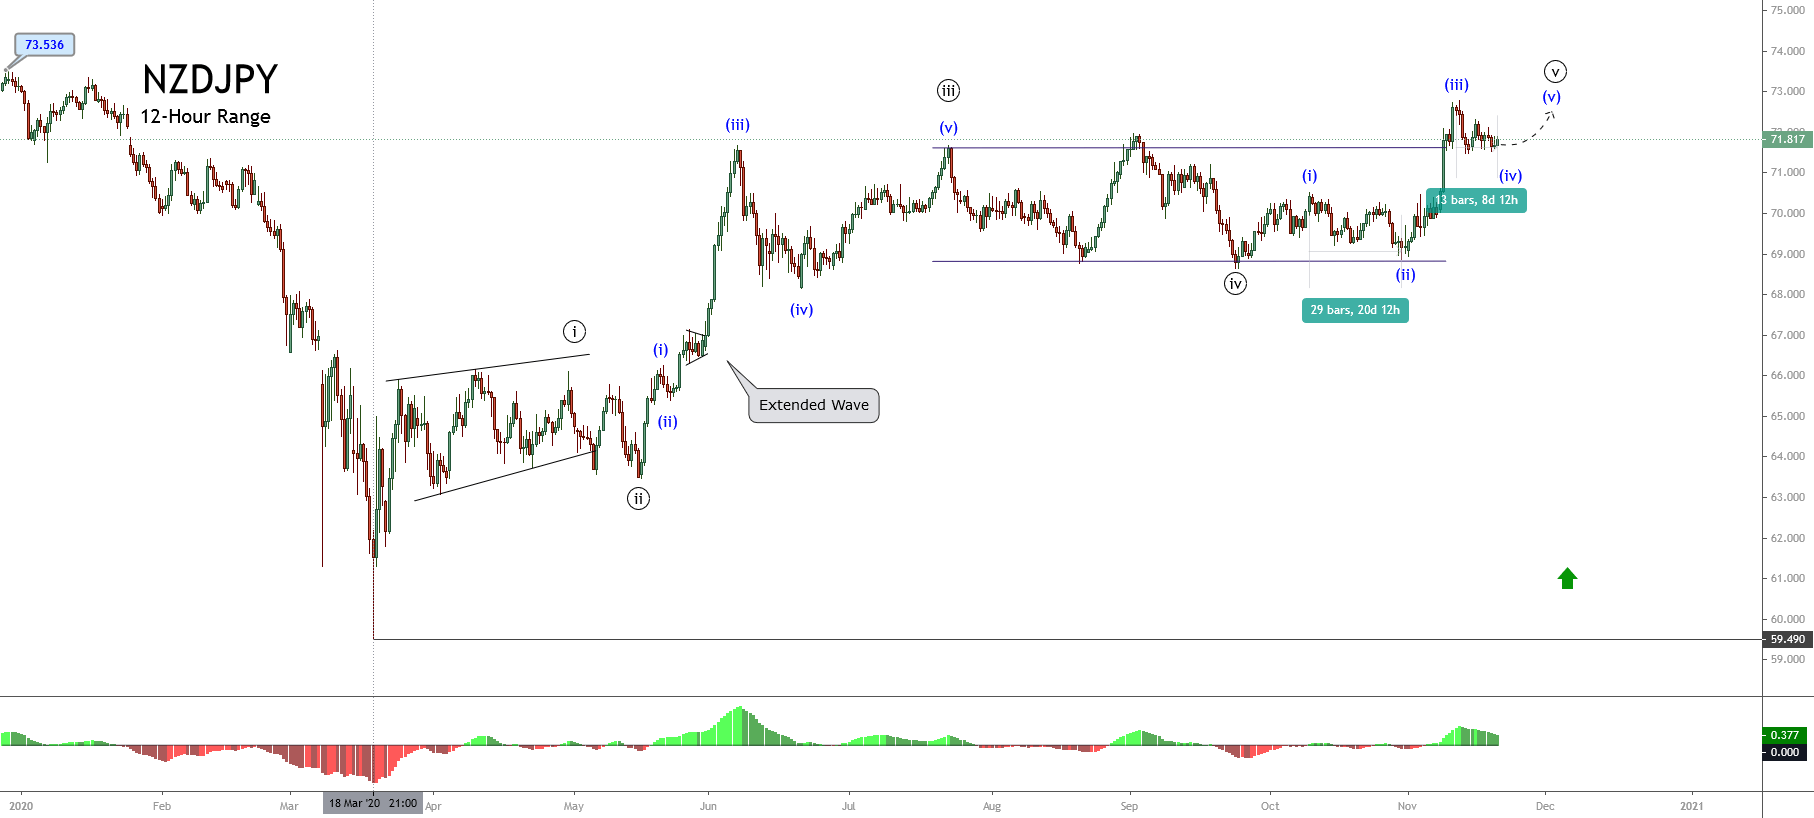
The Elliott Wave perspective of the NZDJPY pair reveals it is moving in an incomplete impulsive sequence that began on March 18th when the price found fresh buyers at 59.49.

Elliott Wave Landscape

In its 12-hour chart, NZDJPY is seen progressing in its fifth wave of Minute degree labeled in black. Its internal structure reveals a sideways action corresponding to the fourth wave of Minuette degree identified in blue. Looking at this context, the cross would likely develop a new upward movement, which should correspond to the fifth wave of Minuette degree of the fifth wave of Minute degree,  following the Elliott Wave theory.

In this regard, the next movement corresponding to the fifth wave in blue of the fifth wave in black should be a terminal move. However, this potential sequence will not necessarily be an ending diagonal pattern.

On the other hand, as exposed in the previous chart, the third wave of Minute degree corresponds to the extended movement of the complete impulsive sequence of Minute degree. Therefore, under the EW rules, the fifth wave cannot be an extended move.

Finally, considering that the fifth wave doesn’t reveal a reversal formation, the current uptrend is likely to continue mostly bullish.

Short-term Technical Outlook

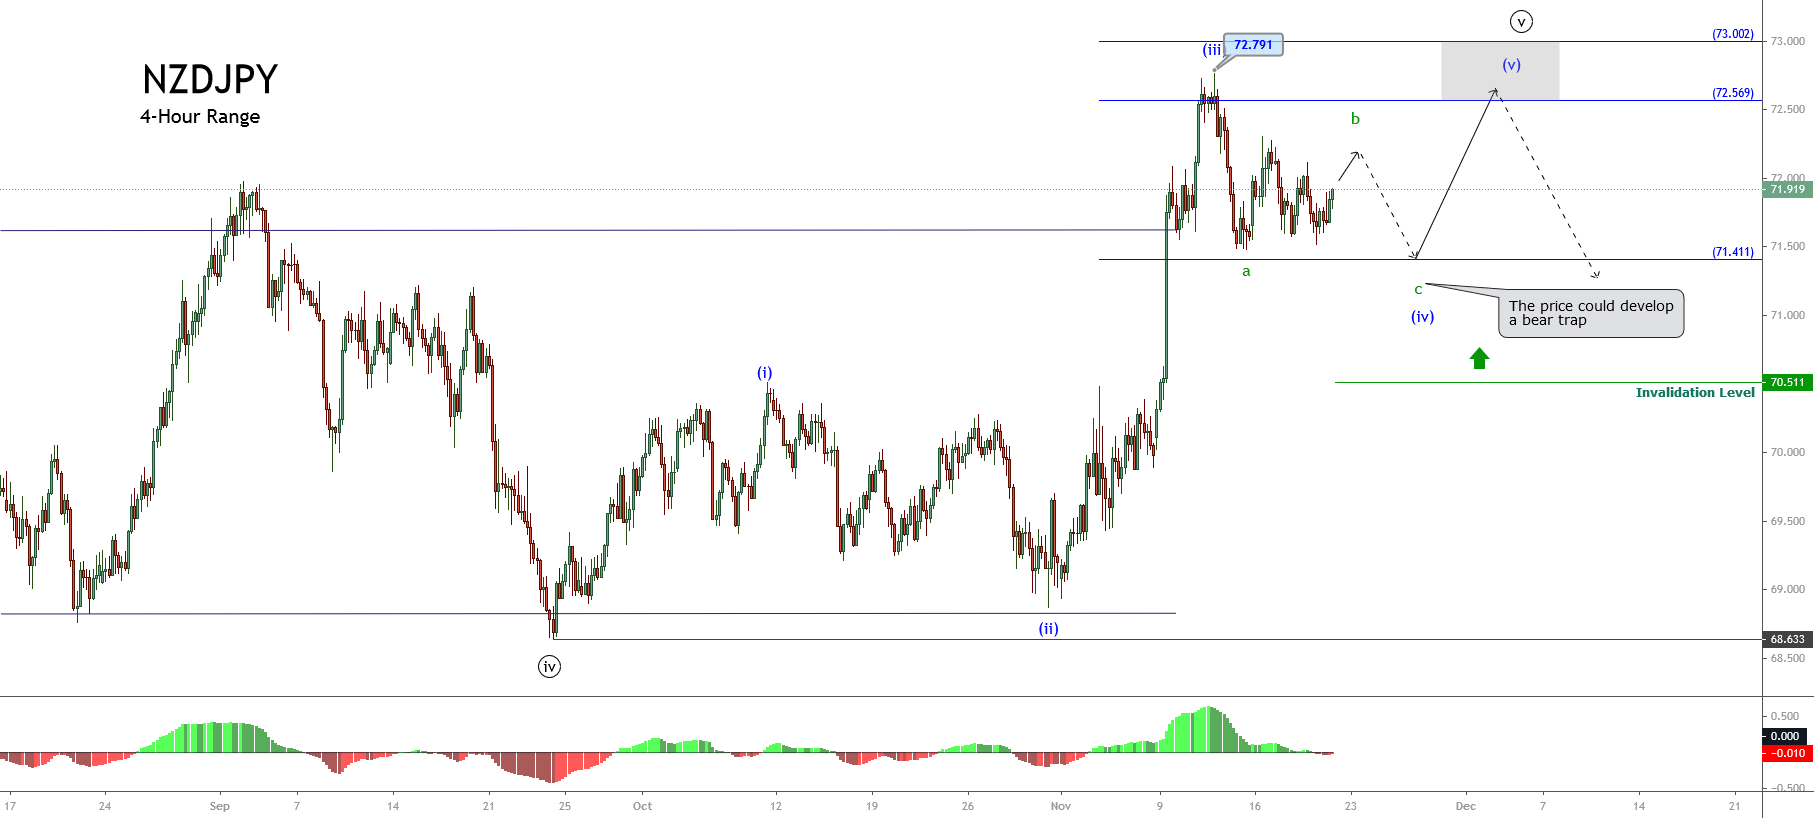
The short-term Elliott wave outlook for the NZDJPY cross displayed in the following 4-hour chart reveals the incomplete internal sequence that currently appears advancing in its fourth wave of Minuette degree identified in blue. At the same time, the corrective wave in progress is running in wave b of Subminuette degree labeled in green.

Once NZDUSD completes its wave b (labeled in green), it could develop a new decline corresponding to wave c. This intraday downward movement, subdivided into five internal segments, could fail below the latest lows, with its potential support on 71.411, where the NZDJPY cross could find fresh buyers expecting to boost its price toward the potential target zone located between 72.569, even till the psychological barrier at 73.002. This likely decline could be a “bear trap,” the big market participant could use to incorporate their long positions.

On the other hand, looking back in our first 12H chart, considering that the third wave is the extended wave,we can perceive two potential scenarios for the wave (v), in blue.

  • Scenario 1: Wave (v) doesn’t surpass the end of wave (iii) located at 72.791 and starts to decline, unveiling the bearish pressure for the cross. In this case, the price likely would pierce and close below level 71.411.
  • Scenario 2:  Wave (v) exceeds the end of wave (iii). In this case, the bullish pressure continues; therefore, the cross retracement could find support above the recent low located at 71.51.

Finally, the invalidation level corresponding to the intraday bullish scenario is 70.511, corresponding to the end of wave (i) identified in blue.

Categories
Forex Market Analysis

NZDUSD Bullish ahead of the RBNZ Meeting

Overview

The NZDUSD cross advances in the extreme bullish sentiment zone before the RBNZ monetary policy decision, to be held during the overnight trading session. The intraday Elliott Wave view reveals its progress in an incomplete five-wave sequence, which could boost the price toward a new high.

Market Sentiment

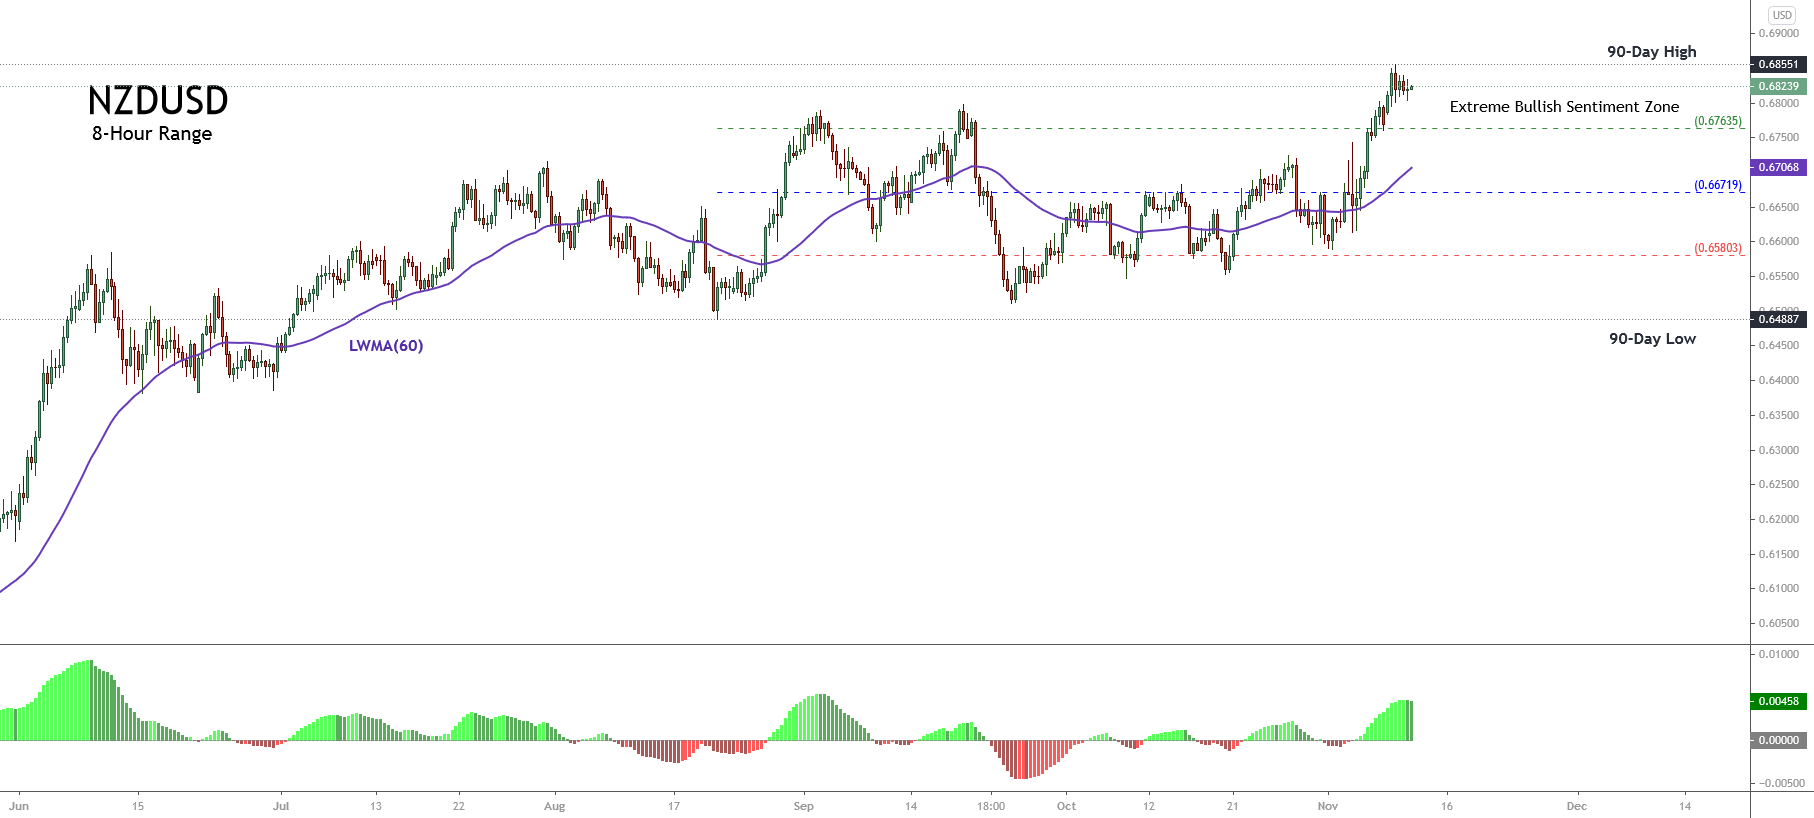
The NZDUSD cross waits for the Reserve Bank of New Zealand (RBNZ) interest rate decision, as it moves on the extreme bullish sentiment zone. Although the kiwi’s high volatility during this year made it drop over 18.7% in the first quarter of the year, the NZDUSD is still up by 1.44% (YTD).

The next chart illustrates the NZDUSD in its 8-hour timeframe. The figure unveils the price action developing a short-term rally that pushed it from the extreme bearish till the extreme bullish sentiment zone.

Moreover, the consecutive intraday higher high could make the market participants expect further upsides during the interest rate decision, which will take place in the overnight trading session.

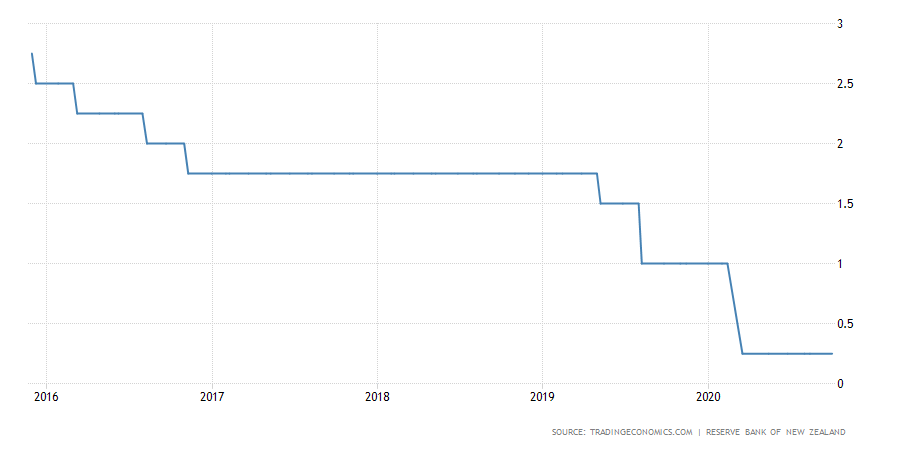
In this context, the analysts’ consensus foresees that the RBNZ official cash rate (OCR) will remain unchanged at 0.25%. However, considering that during the latest Reserve Bank of Australia (RBA) broad meeting, the policymakers decided to cut the interest rate to 0.10%, it is possible that the RBNZ would follow the same direction.

In consequence, although the NZDUSD moves in the extreme bullish zone, a drop below 0.67635 could be a signal the pair might start developing a downward corrective movement during the following trading sessions.

Technical Overview

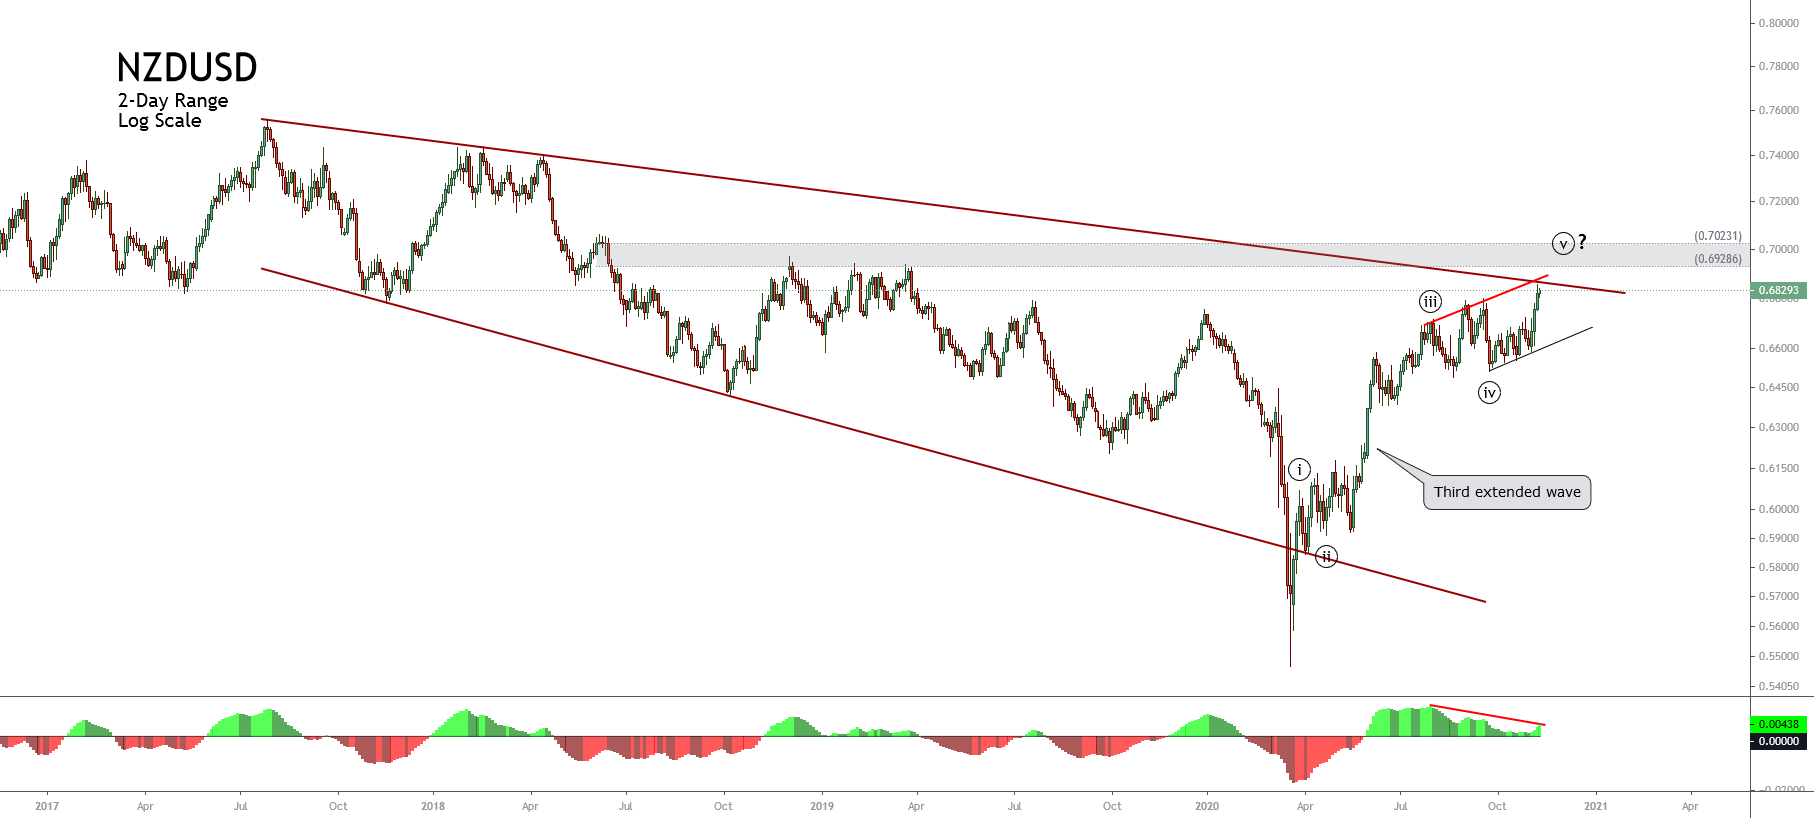
The big picture of the NZDUSD cross exposed in the 2-day log-scale chart reveals its advancement in an incomplete impulsive sequence, which looks moving on its fifth wave of Minute degree labeled in black. 

According to the Elliott Wave theory, considering that the price action developed a third extended wave, the fifth wave should have a limited upside. Thus, the extension of the current upward movement could end soon.

On the other hand, the bearish divergence observed in the MACD oscillator confirms that the cross’s current 5th-wave upward sequence is in an exhaustion stage. 

Likewise, the long-term descending trendline suggests that the price action currently tests a dynamic resistance, which could be surpassed backed by increasing volatility. Nevertheless, this potential breakout could end being a fake-out

Short-term technical Outlook

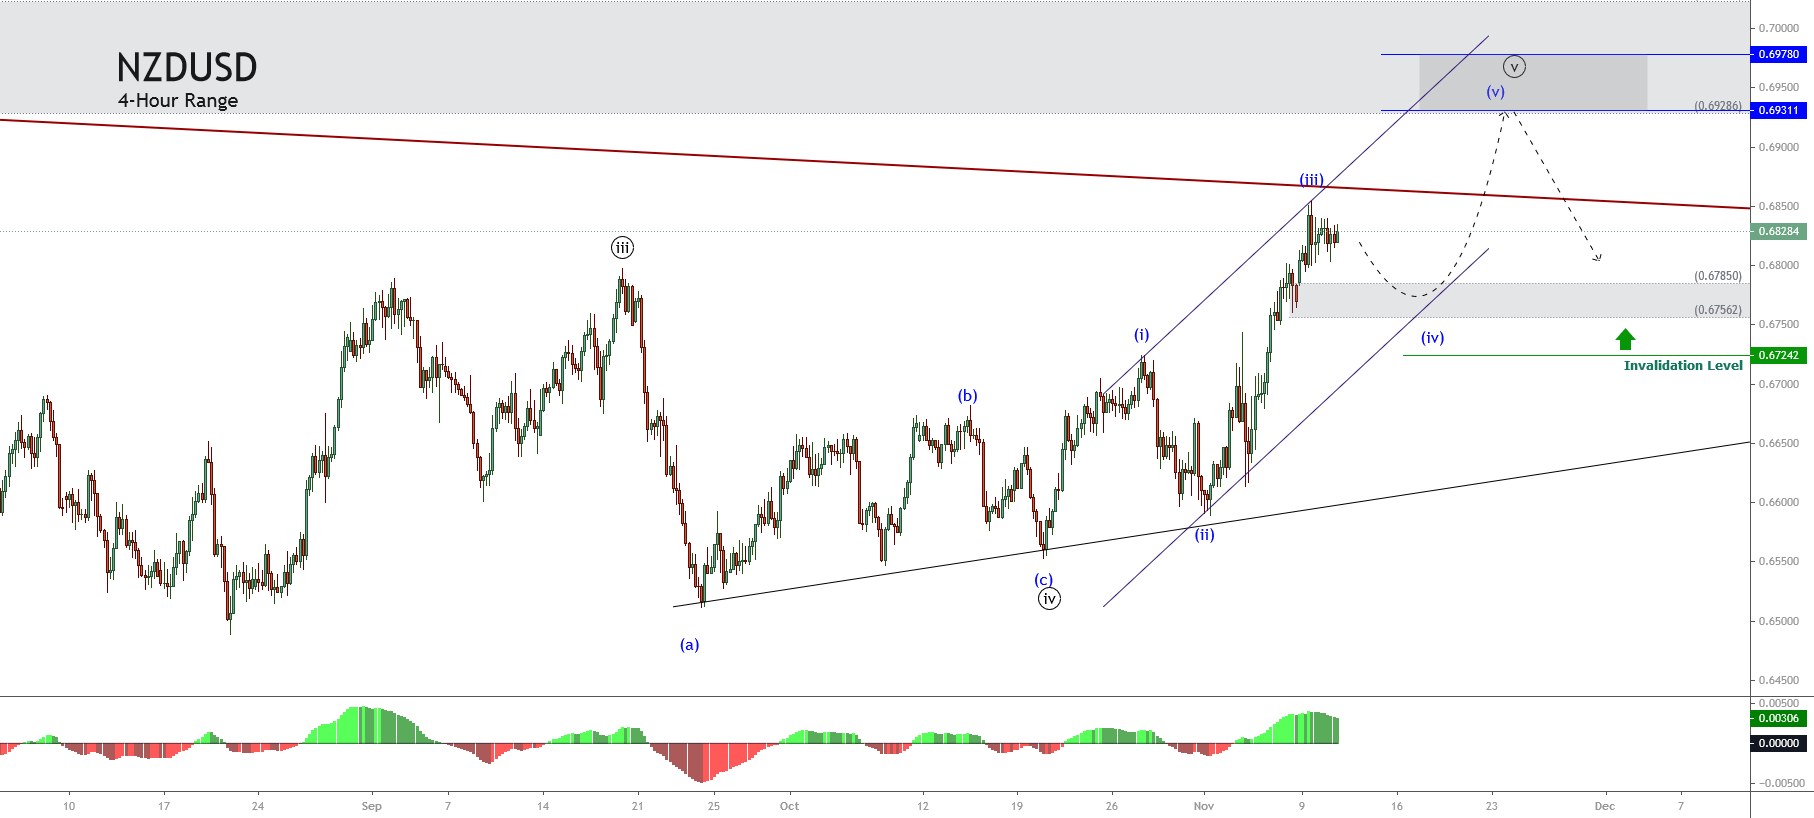
The intraday outlook for NZDUSD under the Elliott wave view and illustrated in its 4-hour chart exposes its progress in the third wave of Minuette degree labeled in blue, which could retrace to the area between 0.6785 and 0.67562.

If the price confirms the bounce from the demand zone between 0.67562 and 0.67850, the kiwi could advance toward the long-term supply zone, which corresponds to a potential target area between 0.69311 and 0.69780.

Once the fifth wave of Minuette degree, which belongs to the fifth wave of Minute degree, completes, the cross could start developing a corrective sequence with length and time proportional to the structural series of Minute degree.

Lastly, the invalidation of this intraday upward scenario is a drop below 0.67242.

Categories
Forex Elliott Wave Forex Market Analysis

Can EURUSD Re-Test the Level 1.20?

The EURUSD pair advances in an unfinished impulsive formation that raised the common currency from 1.06359 till 1.20114. The price action started to develop a corrective sequence, still progressing, corresponding to its fourth wave of Minor degree. Explore with us what should be the target of the fifth impulsive wave.

Market Sentiment

The long-term market sentiment of the EURUSD pair based on the 52-week high and low range unveils the price moving in the extreme bullish zone. 

The following daily chart illustrates the common currency moving above the 60-day linear weighted moving average, confirming the extreme short-term upward bias prevalent in the current price action.

Likewise, the consolidation formation bounded between 1.16121 and 1.18566, appearing after the rally from mid-May to early September, leads us to anticipate the take-profit activity of big market participants. In other words, the price could begin a new movement toward the 52-week high zone, creating a euphoric sentiment for the euro before developing a corrective move.

Elliott Wave Overview

 EURUSD pair’s long-term outlook under the Elliott Wave perspective reveals the upward advancement of the common currency in an unfinished impulsive wave, which currently progresses in its fourth wave of Minor degree, suggesting further highs.

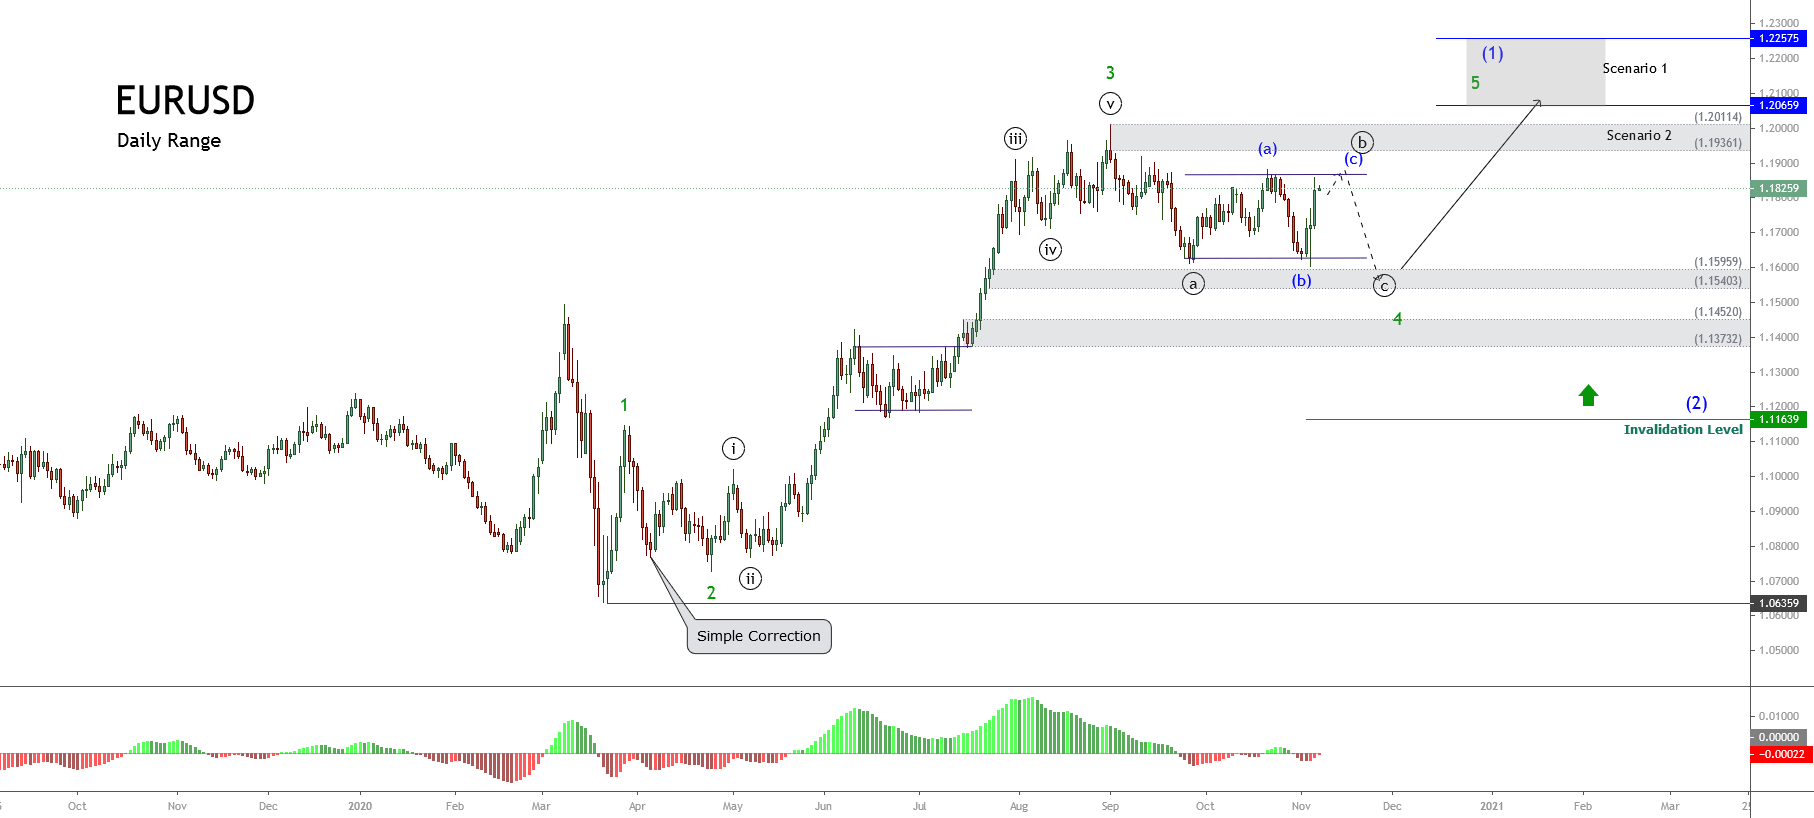
The following daily chart exposes de uptrend developed by the EURUSD since the March 23rd low located at 1.06359, where the price found fresh buyers, who remain in control of the long-term uptrend.

The Elliott Wave point of view illustrates the EURUSD pair developed and completed a third extended wave of Minor degree labeled in green when the price reached 1.20114 on past September 01st. Once the common currency found resistance at 1.20114, the EURUSD started to develop its fourth wave of Minor degree identified in green.

Considering that the second corrective wave was simple in terms of price and time, by the alternation principle of the Elliott Wave theory, the fourth wave should be a complex correction. In this regard, the complexity could be in terms of price, time, or both.

If the correction were complex in price, the formation could be a flat pattern like an irregular flat. If the complexity were in terms of time, the corrective pattern could be a triangle formation. Finally, if the correction develops a combination of price and time complexity, the structural series could be a double three or a triple three pattern.

Short-term Elliott Wave Outlook

Once the fourth wave ends, the common currency should advance in its fifth wave, shown in green in the following chart. Considering that the third wave is the extended wave, two potential scenarios exist for the fifth wave target.

The first scenario considers the advance slightly higher than the top of the third wave, which could reach the area between 1.2065 and 1.2257.

The second scenario may arise if the fifth wave’s bullish pressure fails and finds resistance in the supply zone, which is located between 1.19361 and 1.20114.

To conclude, the invalidation level corresponding to this bullish scenario is a close below 1.11639.