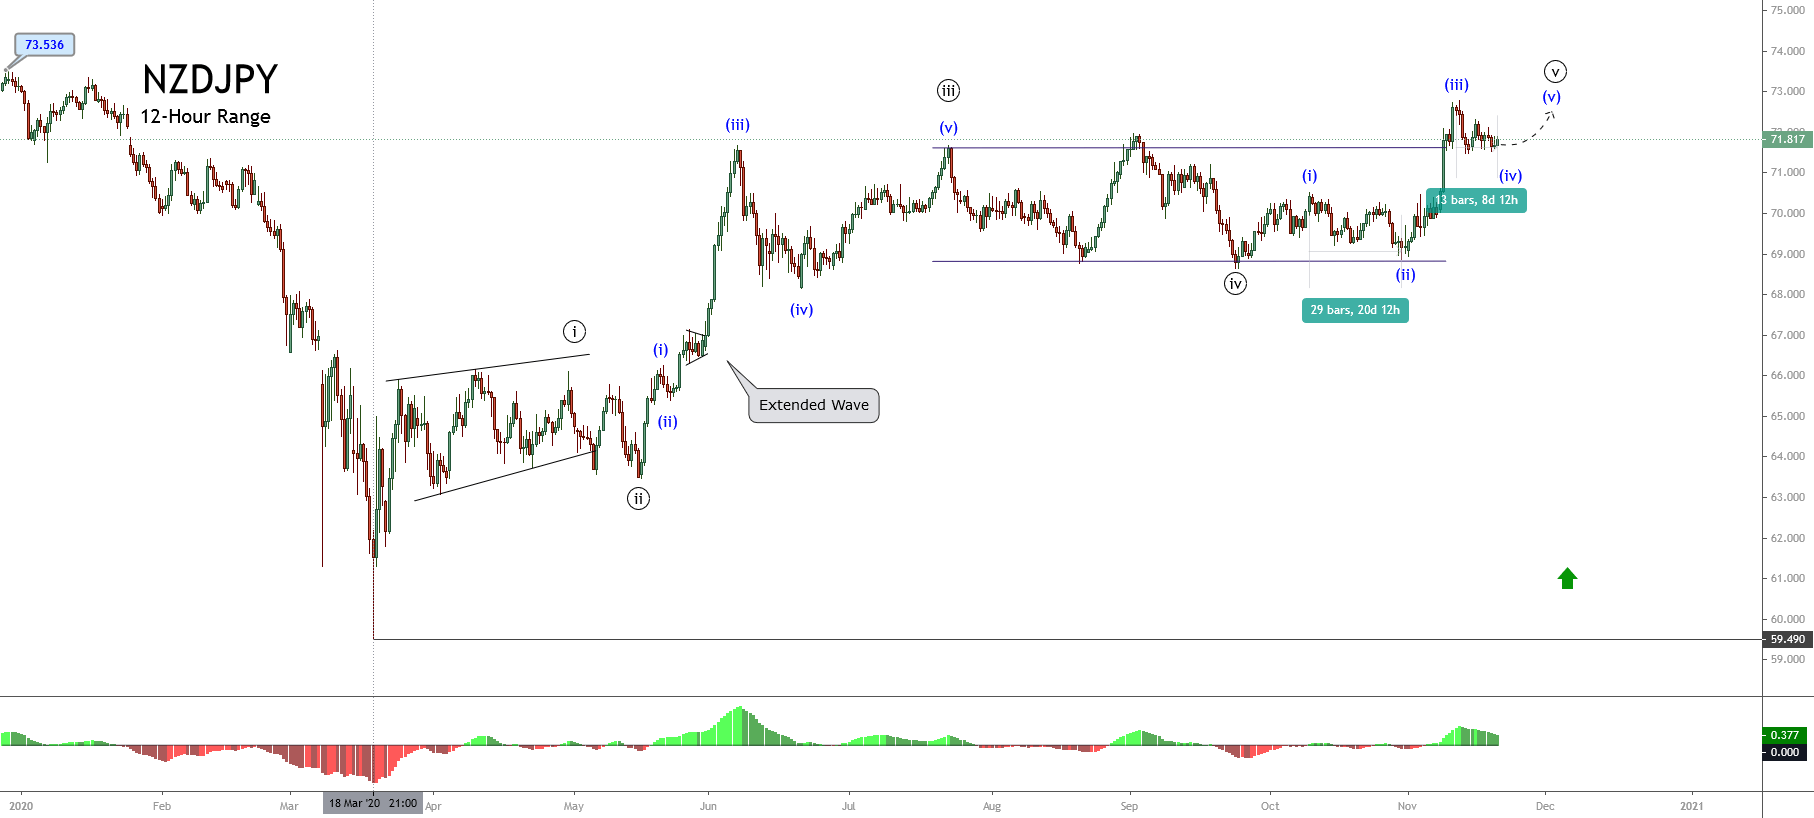
The Elliott Wave perspective of the NZDJPY pair reveals it is moving in an incomplete impulsive sequence that began on March 18th when the price found fresh buyers at 59.49.
Elliott Wave Landscape
In its 12-hour chart, NZDJPY is seen progressing in its fifth wave of Minute degree labeled in black. Its internal structure reveals a sideways action corresponding to the fourth wave of Minuette degree identified in blue. Looking at this context, the cross would likely develop a new upward movement, which should correspond to the fifth wave of Minuette degree of the fifth wave of Minute degree, following the Elliott Wave theory.
In this regard, the next movement corresponding to the fifth wave in blue of the fifth wave in black should be a terminal move. However, this potential sequence will not necessarily be an ending diagonal pattern.
On the other hand, as exposed in the previous chart, the third wave of Minute degree corresponds to the extended movement of the complete impulsive sequence of Minute degree. Therefore, under the EW rules, the fifth wave cannot be an extended move.
Finally, considering that the fifth wave doesn’t reveal a reversal formation, the current uptrend is likely to continue mostly bullish.
Short-term Technical Outlook
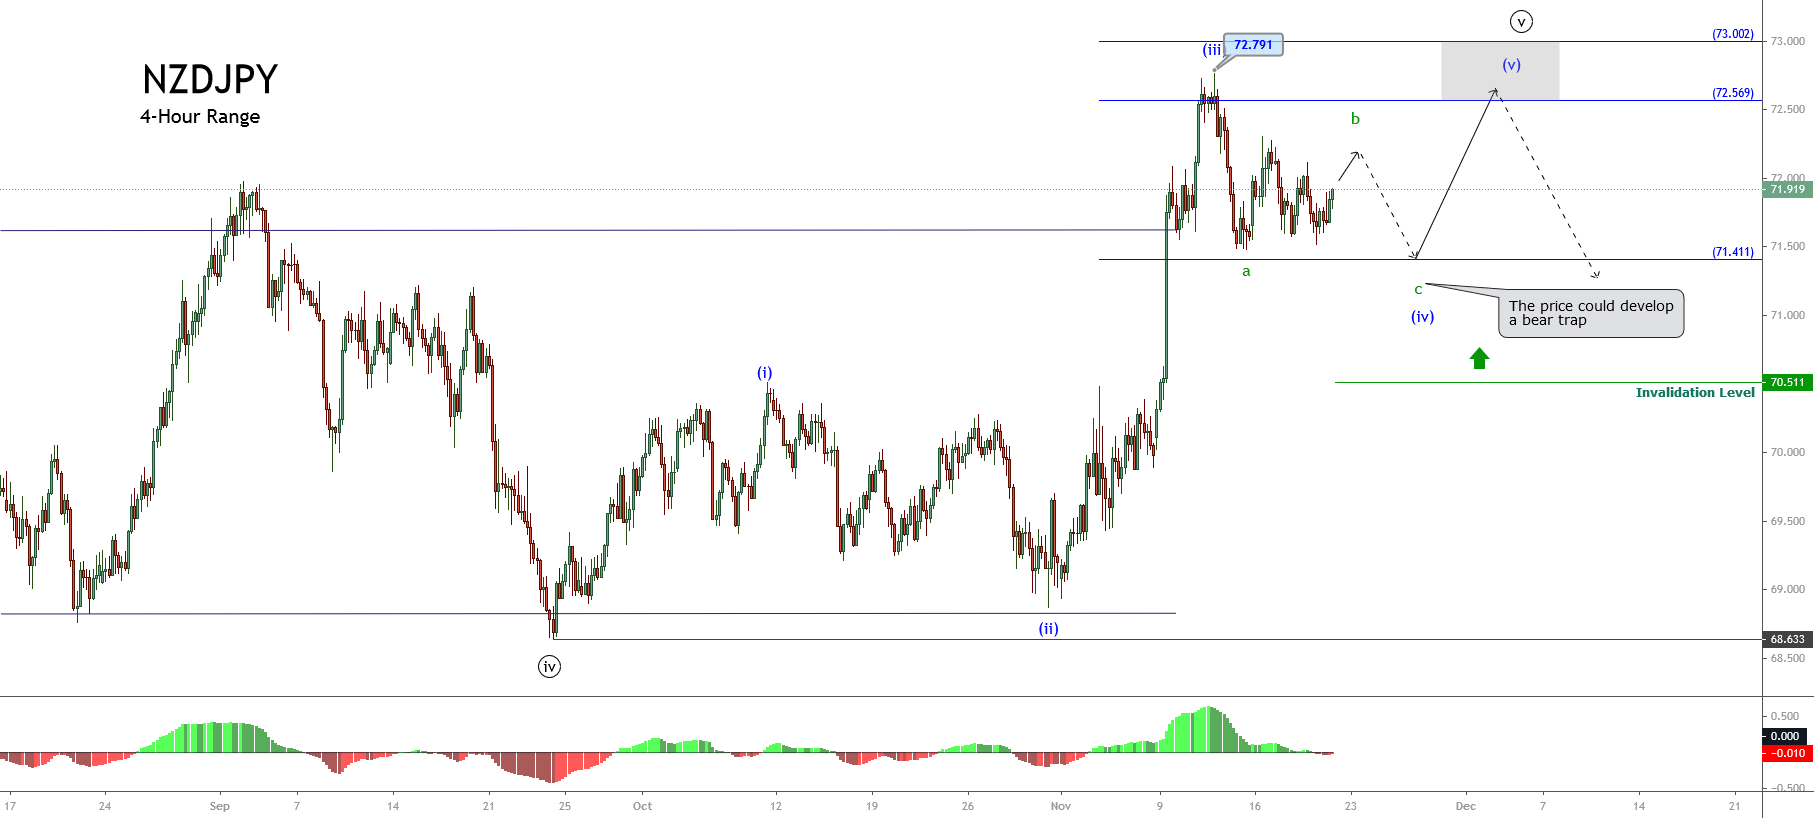
The short-term Elliott wave outlook for the NZDJPY cross displayed in the following 4-hour chart reveals the incomplete internal sequence that currently appears advancing in its fourth wave of Minuette degree identified in blue. At the same time, the corrective wave in progress is running in wave b of Subminuette degree labeled in green.
Once NZDUSD completes its wave b (labeled in green), it could develop a new decline corresponding to wave c. This intraday downward movement, subdivided into five internal segments, could fail below the latest lows, with its potential support on 71.411, where the NZDJPY cross could find fresh buyers expecting to boost its price toward the potential target zone located between 72.569, even till the psychological barrier at 73.002. This likely decline could be a “bear trap,” the big market participant could use to incorporate their long positions.
On the other hand, looking back in our first 12H chart, considering that the third wave is the extended wave,we can perceive two potential scenarios for the wave (v), in blue.
- Scenario 1: Wave (v) doesn’t surpass the end of wave (iii) located at 72.791 and starts to decline, unveiling the bearish pressure for the cross. In this case, the price likely would pierce and close below level 71.411.
- Scenario 2: Wave (v) exceeds the end of wave (iii). In this case, the bullish pressure continues; therefore, the cross retracement could find support above the recent low located at 71.51.
Finally, the invalidation level corresponding to the intraday bullish scenario is 70.511, corresponding to the end of wave (i) identified in blue.


