
The cryptocurrency sector has ended up with the majority of cryptos in the green as Bitcoin continued its rally past $18,000. The largest cryptocurrency by market cap is currently trading for $18,095, representing an increase of 1.31% on the day. Meanwhile, Ethereum gained 1.59% on the day, while XRP gained 2.42%.
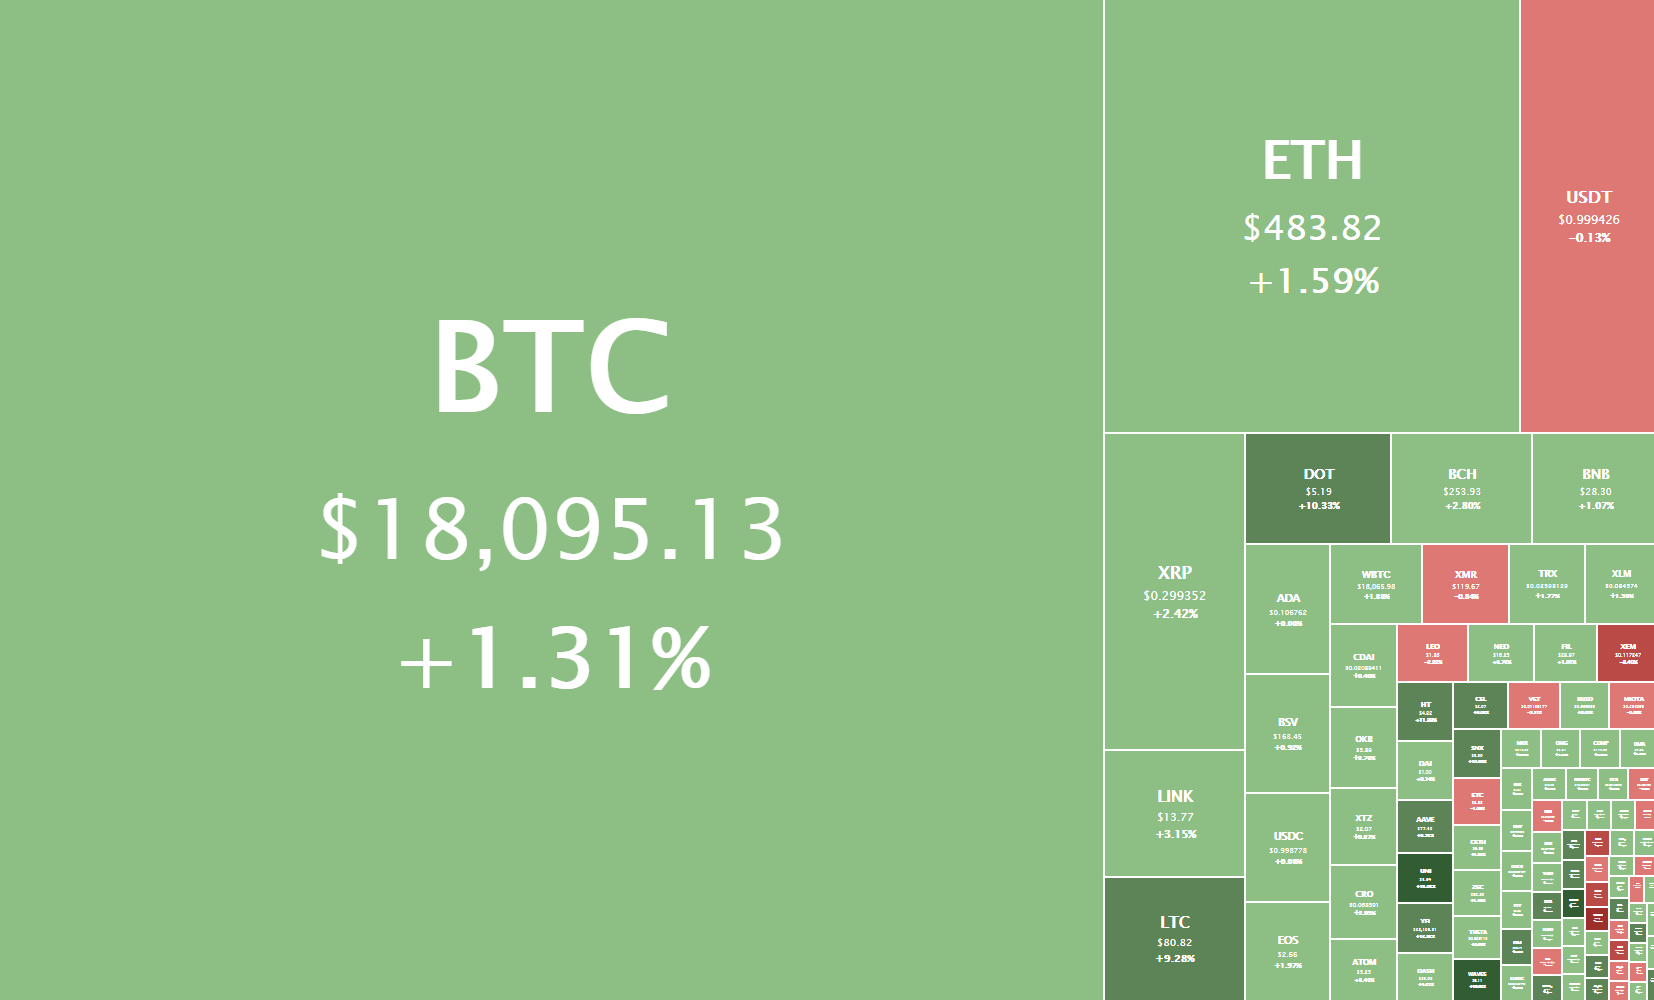
Daily Crypto Sector Heat Map
SushiSwap 31.66% in the past 24 hours, making it the most prominent daily gainer out of the top100 cryptos ranked by market capitalization yet again today. It is closely followed by Waves’ gain of 21.42% and CyberVein’s 17.06% gain. On the other hand, Blockstack lost 8.00%, making it the most prominent daily loser. NEM lost 7.73% while ABBC Coin lost 6.77%, making them the 2nd and 3rd most prominent daily losers.
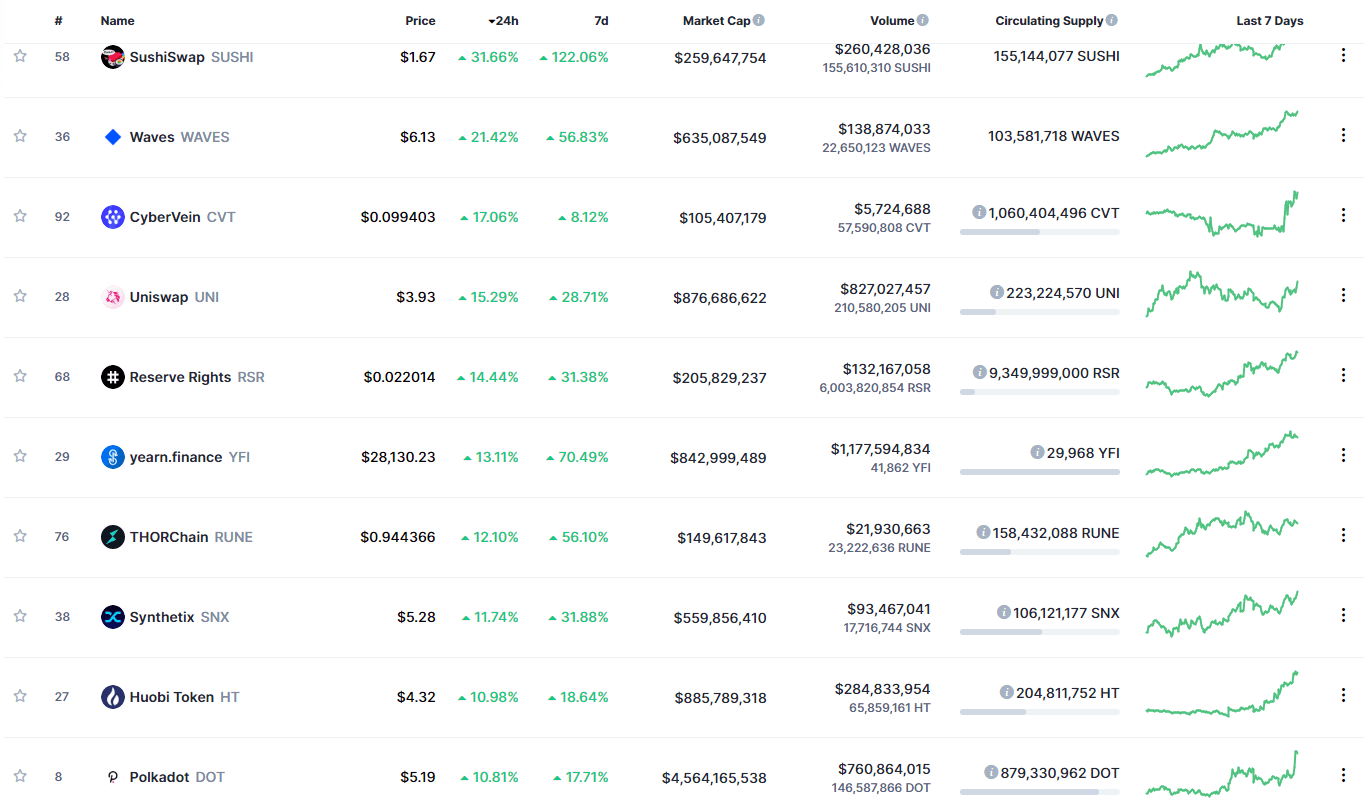
Top 10 24-hour Performers (Click to enlarge)

Bottom 10 24-hour Performers (Click to enlarge)
Bitcoin’s market dominance has reduced slightly over the course of the day, with its value is currently staying at 66.1%. This value represents a 0.2% difference to the downside when compared to the value it had yesterday.
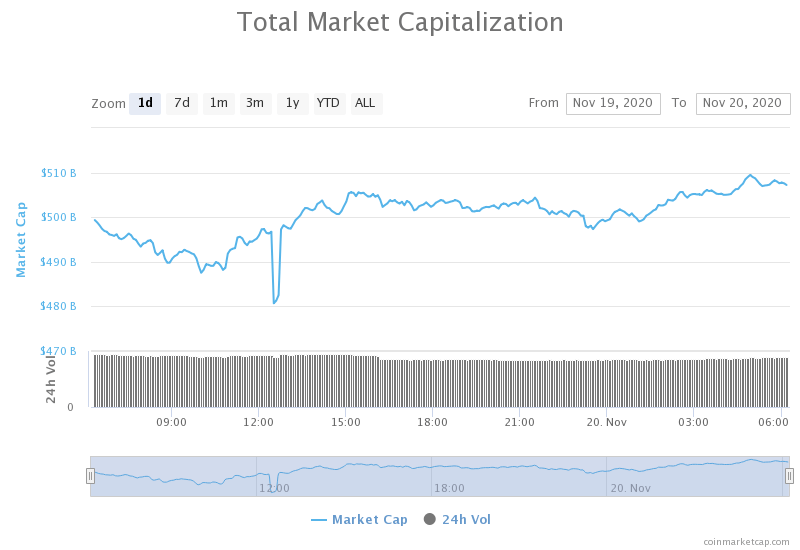
Daily Crypto Market Cap Chart
The crypto sector capitalization has increased over the course of the day. Its current value is $507.23 billion, representing a $12.16 billion increase compared to our previous report.
_______________________________________________________________________
What happened in the past 24 hours?
_______________________________________________________________________
- Outgoing SEC Chair Jay Clayton reveals the main driver for the rise of BTC (Cointelegraph)
- Lightning Network’s New Liquidity Marketplace Attracts a ‘Surprising’ Mix of Individuals, Enterprises (Coindesk)
- Bitcoin (BTC) pump to $18k pushes miner revenues to pre-halving levels (Cryptoslate)
- Uniswap (UNI) liquidity falls 50% as incentives end, funds flow to Sushiswap (SUSHI) (Cryptoslate)
- yEarn.Finance Ready to Pullback Following 240% Bull Rally (Cryptobriefing)
- Binance Controls the Only Major Pool Rejecting Bitcoin’s Taproot Update (Cryptobriefing)
- The IRS is weighing different approaches to cryptocurrency taxation, says Treasury official (The Block)
- SEC issues no-action letter to a social media company for its planned Ethereum token (The Block)
- Crypto’s most prominent options traders are taking advantage of a new market anonymity tool (The Block)
- The European Commission is seeking advice for a public-sector blockchain (The Block)
_______________________________________________________________________
Technical analysis
_______________________________________________________________________
Bitcoin

The largest cryptocurrency by market cap has spent the past 24 hours pushing towards and past the $18,000 level after it has won the fight for $17,850. While the move was quite sudden at one point, it was actually not accompanied by a great increase in volume. This has ultimately caused BTC to end its move slightly above $18,200 and start its consolidation phase.
Due to many people taking profits and shorting to hedge their portfolios, Bitcoin has a hard time going up. However, trading pullbacks is equally as risky. Bitcoin traders would have the most chance of success if they traded only pushes to the upside, accompanied by a decent volume increase.
BTC/USD 1-hour Chart
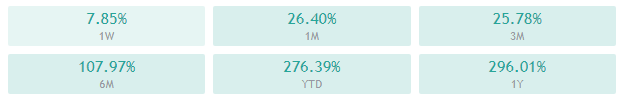
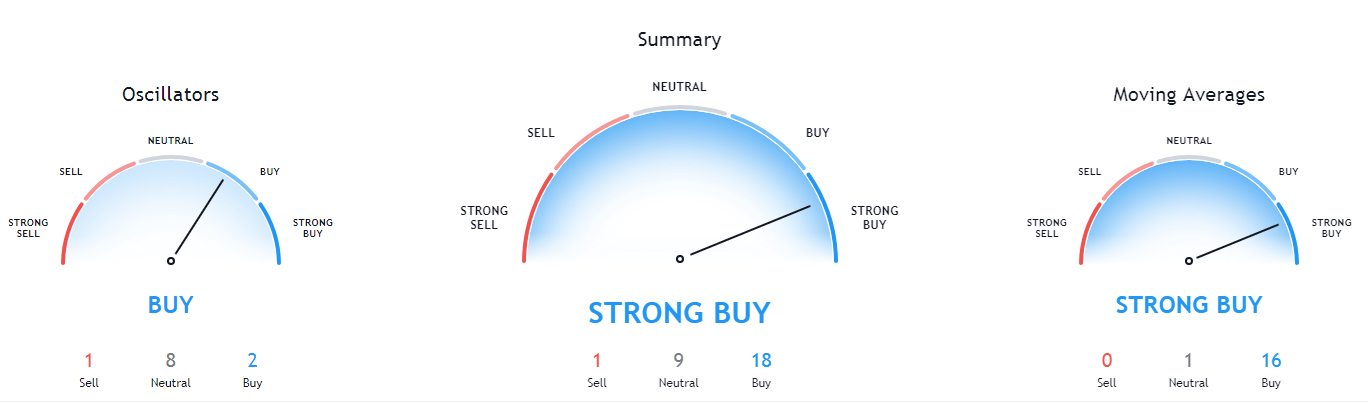
Bitcoin’s technicals on the 4-hour, daily, and monthly time-frame are all bullish but show some signs of neutral presence. On the other hand, its weekly overview is tilted towards the buy-side and doesn’t show any bearishness.
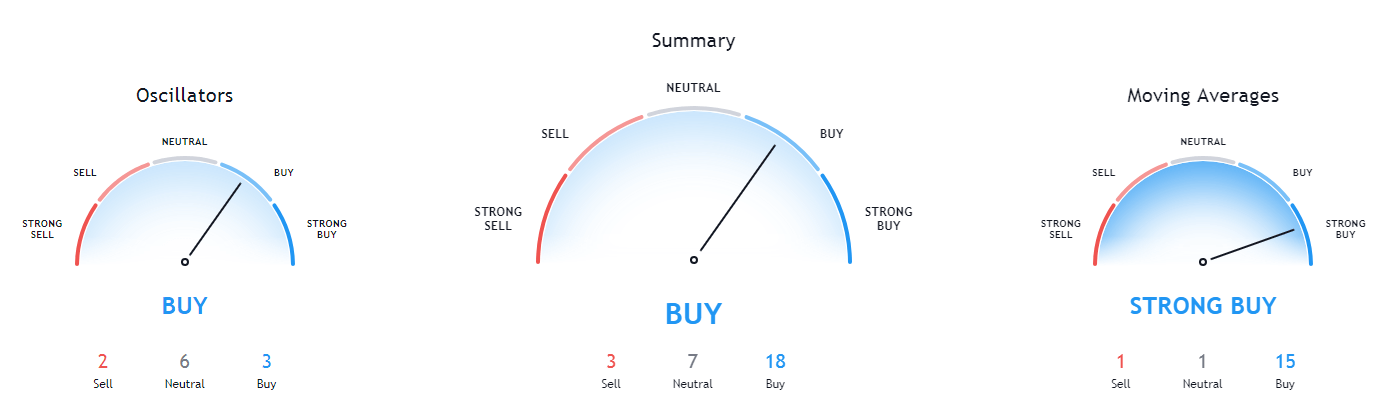
BTC/USD 1-day Technicals
Technical factors (4-hour Chart):
- Price is above both its 50-period EMA and its 21-period EMA
- Price is near its top Bollinger band
- RSI is neutral (57)
- Volume is slightly below average
Key levels to the upside Key levels to the downside
1: $18500 1: $17,850
2: $19000 2: $17,450
3: $19500 3: $17,130
Ethereum
Our yesterday’s call for Ethereum traders was that they should wait for the cryptocurrency to confirm its support level or fall under it, and then trade “with the wave.” Ethereum confirmed its position above the yellow dotted line (top line of the ascending channel) and pushed up instantly. The move brought Ether from $470 all the way to $488 before slowing down and starting to consolidate.
While Ethereum’s downside is quite defined, its upside isn’t. Traders should be wary of Ether’s future pushes to the upside, while they should trade any pullback from the retest of the yellow line.
ETH/USD 1-hour Chart
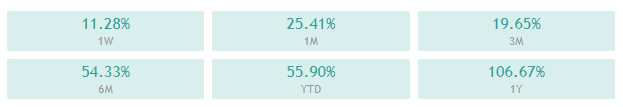
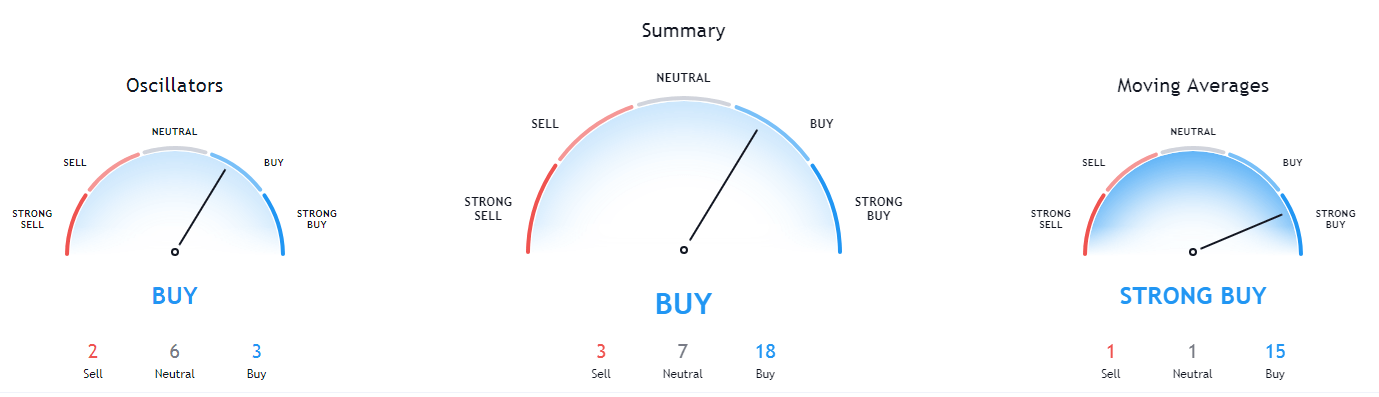
Ethereum’s 4-hour, daily and monthly time-frames are extremely bullish and show no signs of neutrality or bearishness. On the other hand, its weekly overview is still titled to the bull side but does show significant neutrality.
ETH/USD 1-day Technicals
Technical Factors (4-hour Chart):
- The price is above both its 50-period and its 21-period EMA
- Price is near its top Bollinger band
- RSI is neutral after bouncing from almost being overbought(59.32)
- Volume is average
Key levels to the upside Key levels to the downside
1: $490 1: $470
2: $500 2: $451
3: $510 3: $445
Ripple
The fourth-largest cryptocurrency by market cap has spent the day breaking out of its slow price descent and pushing towards the upside. XRP first changed its price direction at $0.284 and quickly pushed towards the upside, reaching as high as $0.306. However, that price did not hold up, and XRP started trading sideways around the $0.3 mark.
XRP traders should still be safe to trade within the range bound by $0.2855 and $0.31. However, since the range is quite large, traders would be even better if they could spot additional small buy/sell walls in the order books before blindly trading.
XRP/USD 1-hour Chart
XRP’s daily and weekly overviews are completely bullish and show no signs of neutrality, while its 4-hour and monthly overviews show slight neutrality.
XRP/USD 1-day Technicals
Technical factors (4-hour Chart):
- The price is above its 50-period EMA and at its 21-period EMA
- Price is near its middle Bollinger band
- RSI is neutral (53.74)
- Volume is average
Key levels to the upside Key levels to the downside
1: $0.31 1: $0.28
2: $0.3244 2: $0.27
3: $0.3328 3: $0.266
Related posts
 Daily Crypto Review, Jun 10 – Crypto Ransomware Cartels Forming; Market Preparing For A Move
 Daily Crypto Review, Jun 17 – Craig Wright Called a Thief or a Fraud by the Ex CEO of Mt. Gox
 Daily Crypto Review, Oct 27 – Bitcoin Preparing For a Retracement; XRP Tumbles on the Daily
 Daily Crypto Review, Nov 4 – Bitcoin Contesting $14,000; Crypto Sector in the Green