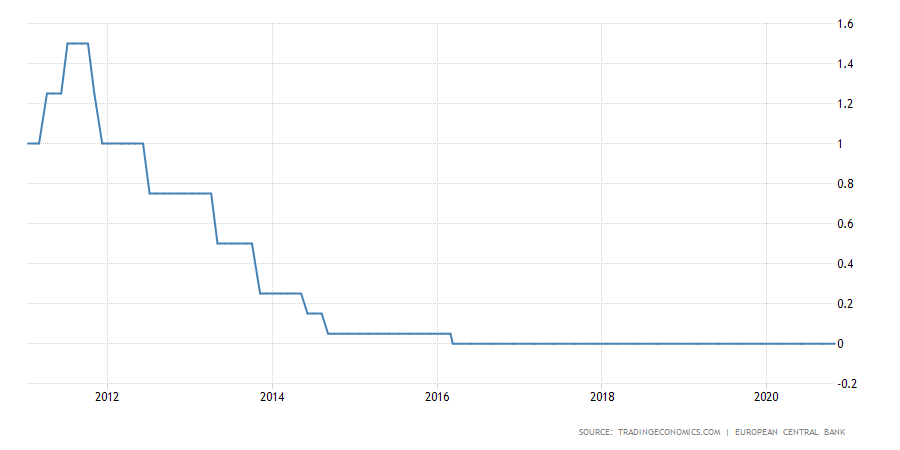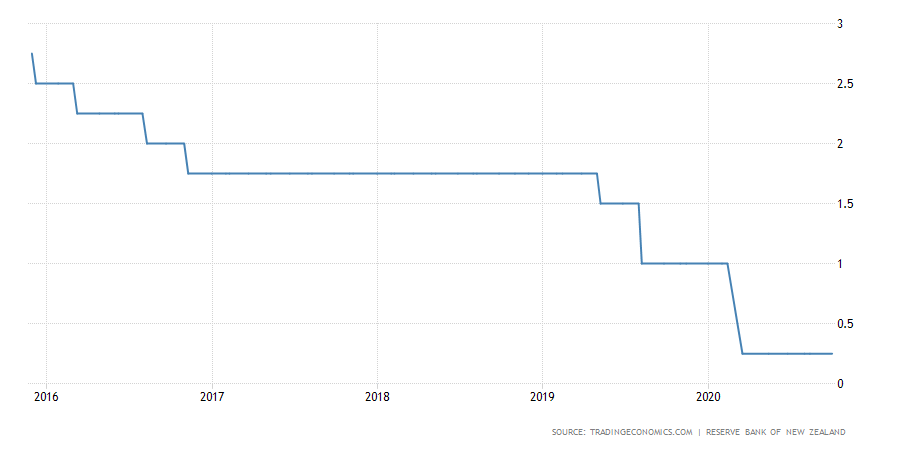
The US Dollar Index (DXY) reached a new yearly low of 90.128, expecting the last FOMC interest rate decision meeting of the year. The analysts’ consensus anticipates the rate unchanged at 0.25% by the FED.
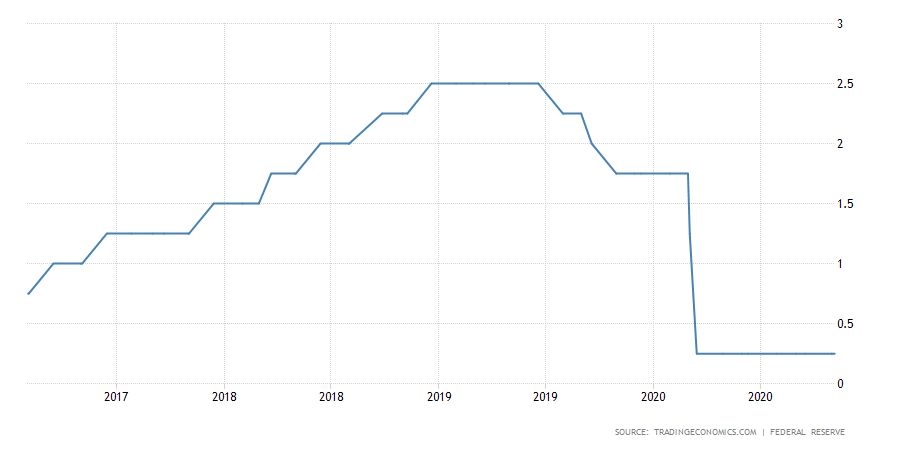 Source: TradingEconomics.com
Technical Overview
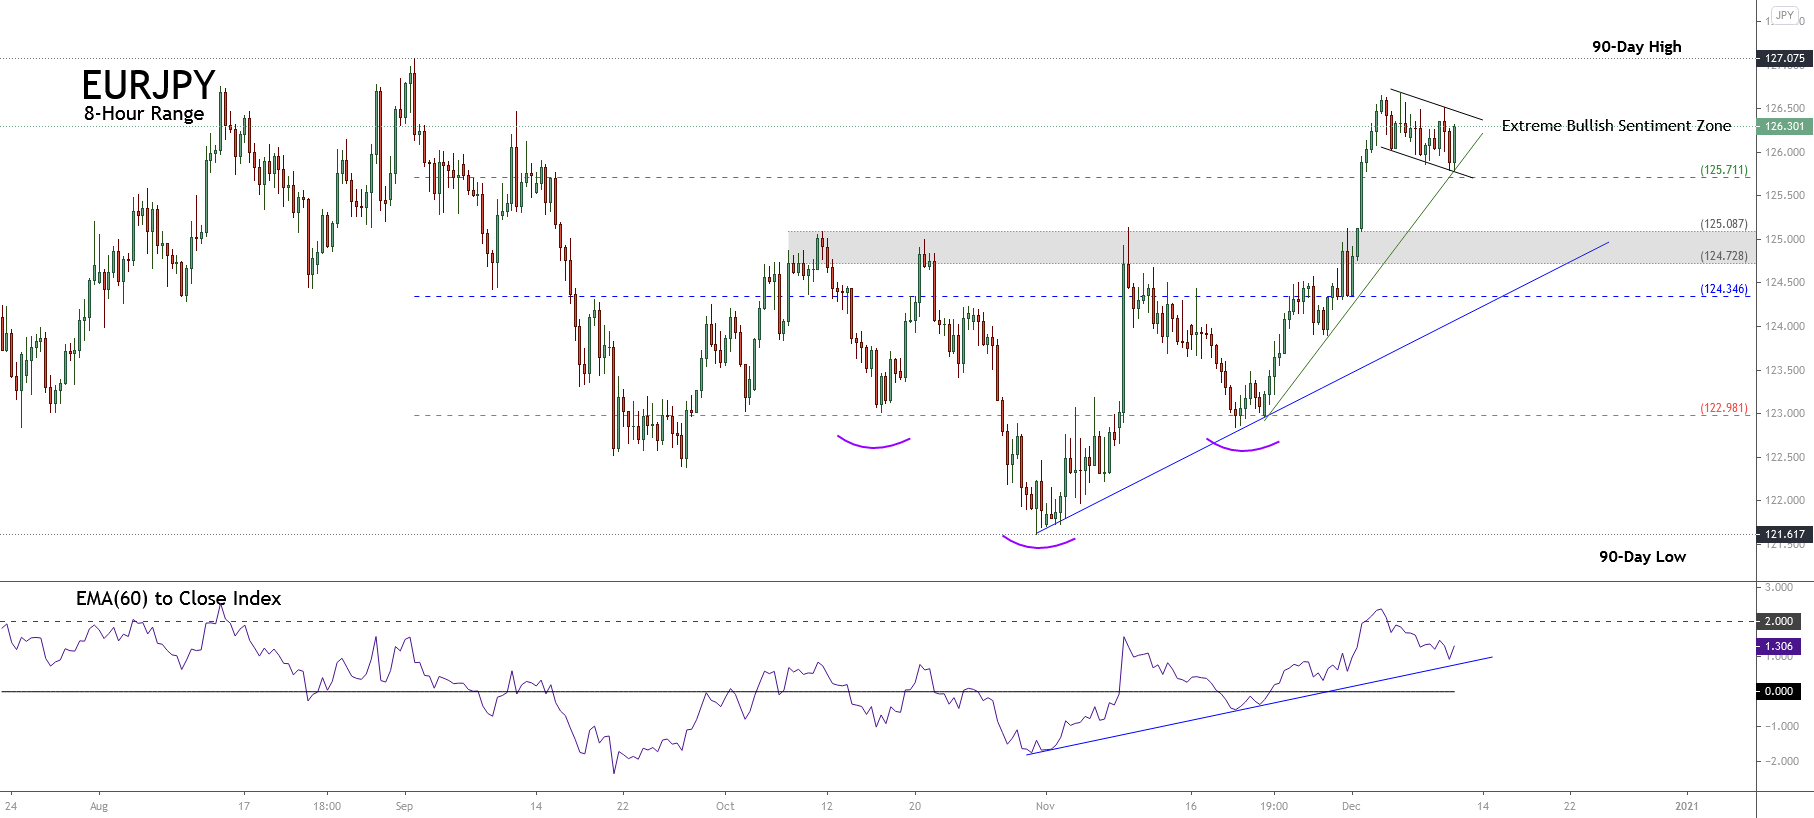
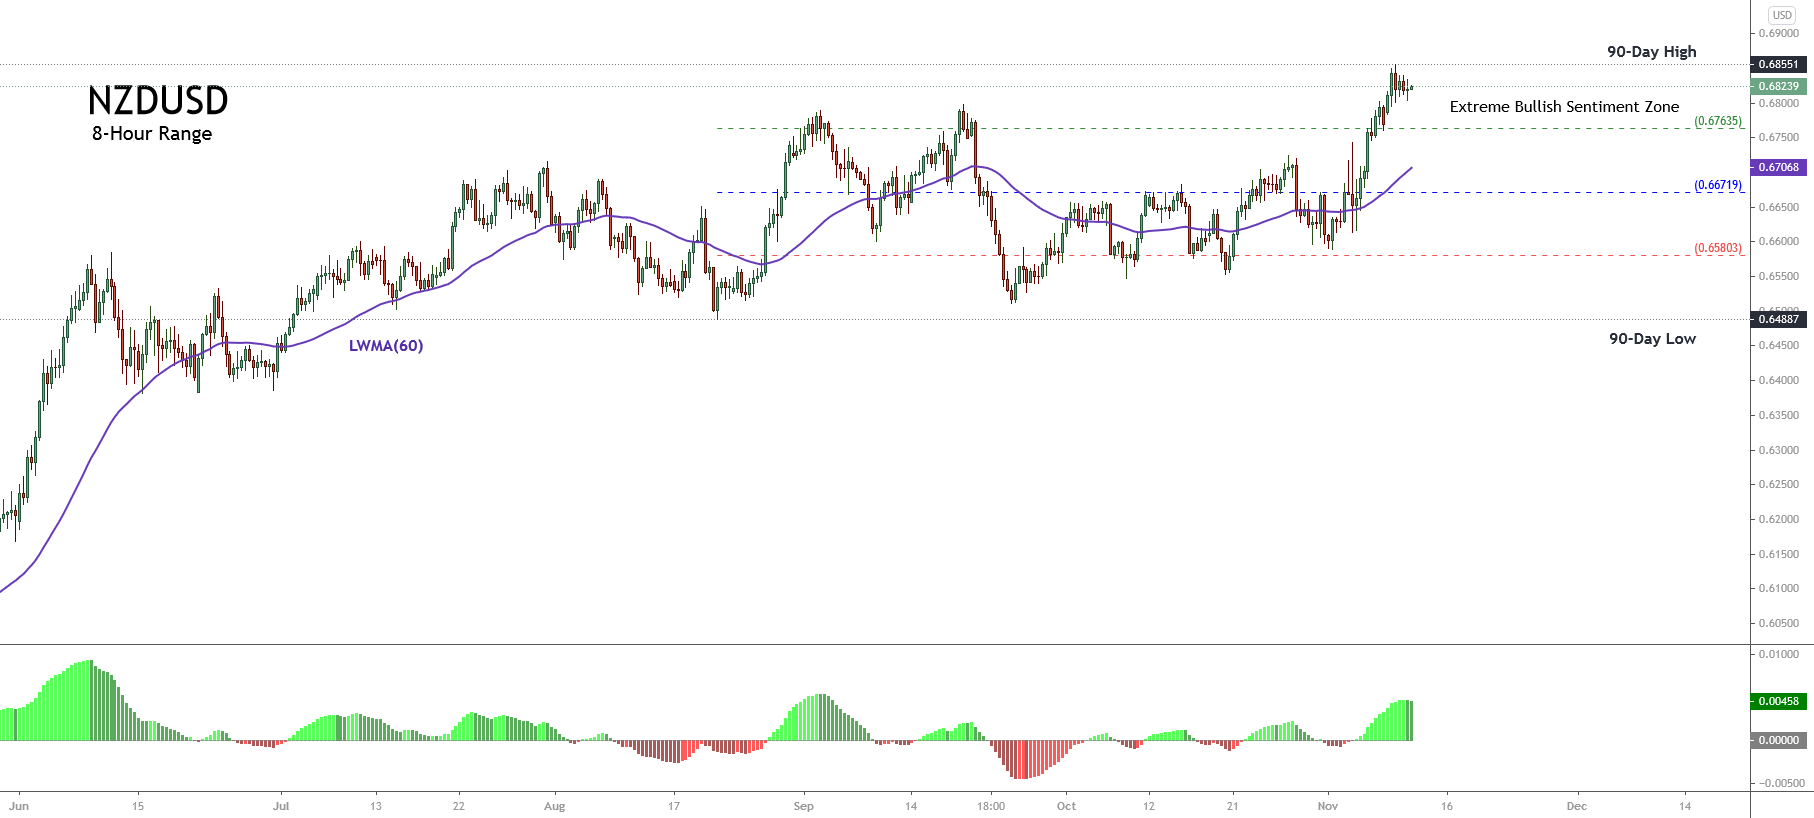
The short-term overview for the Greenback illustrated in the following 8-hour chart displays the short-term market participants’ sentiment unfolded by the 90-day high and low range, which shows the price action moving in the extreme bearish sentiment zone. Likewise, the bullish divergence observed on the EMA(60) to Close Index carries to expect a recovery for the following trading sessions.
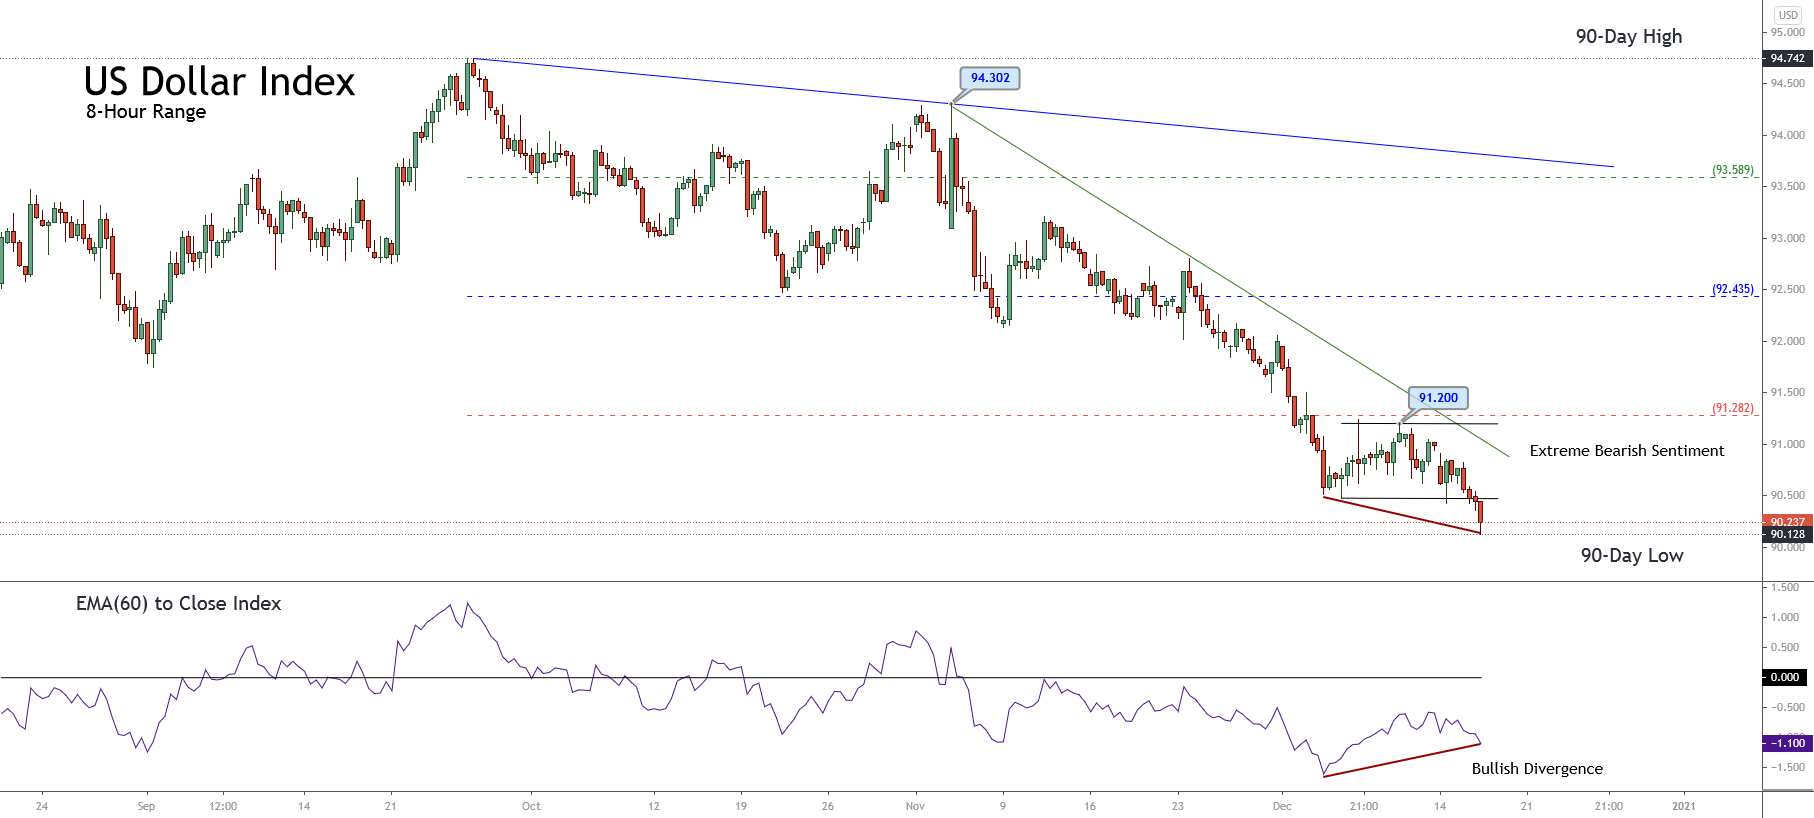
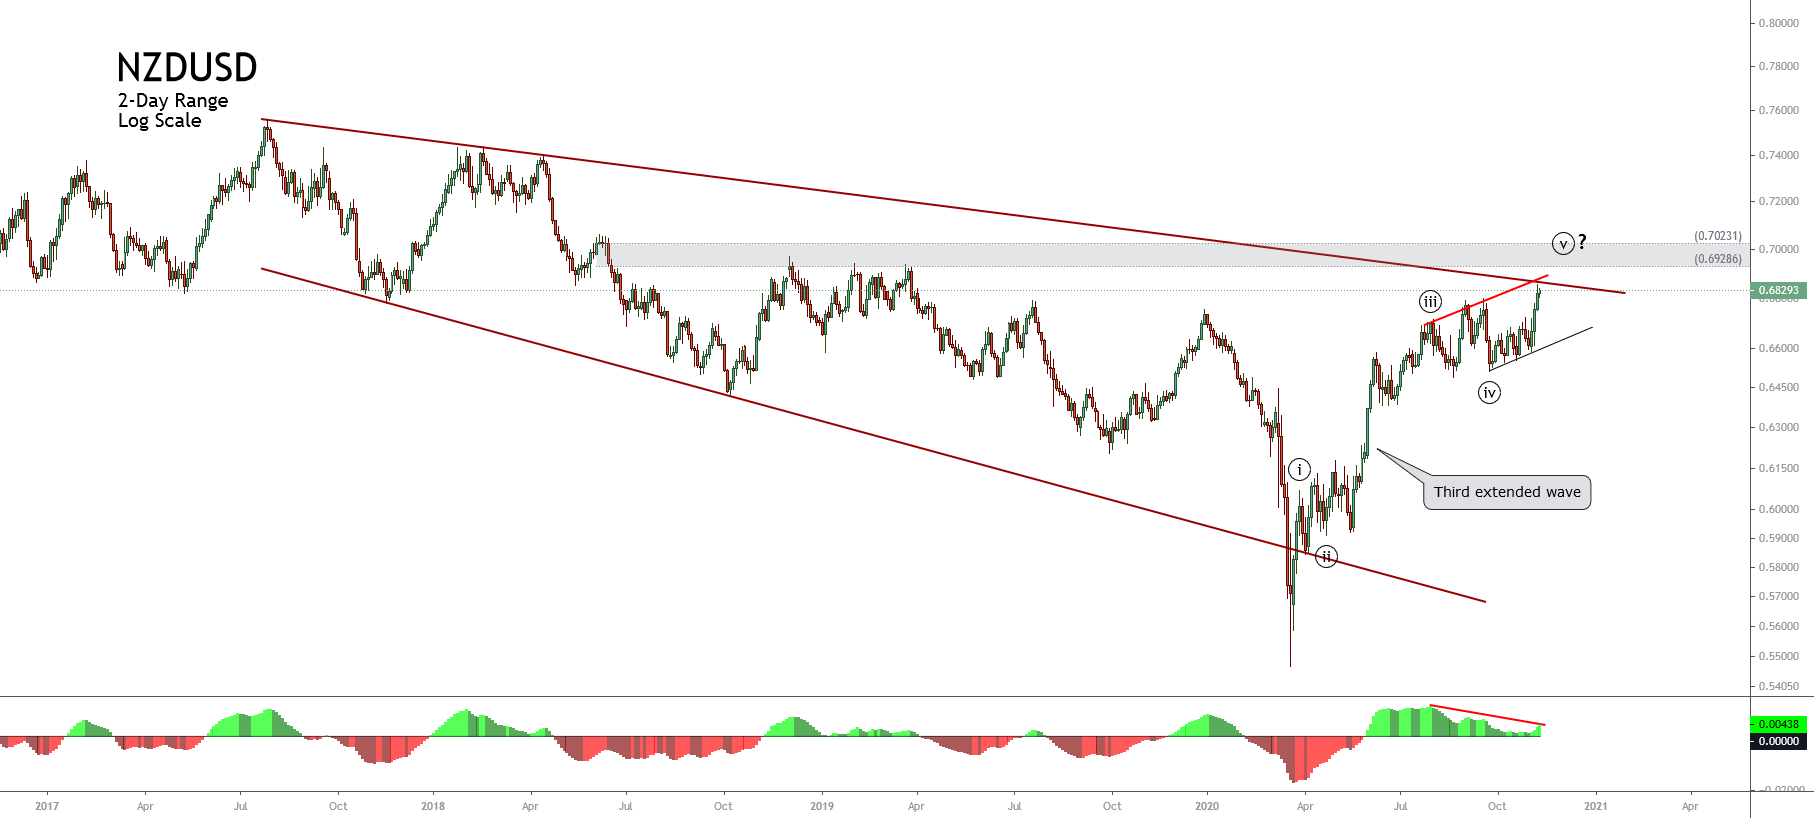
On the other hand, the short-term primary trend outlined with its trend-line drawn in blue reveals that the bearish bias remains intact since September 25th, when the price topped at 94.742. The secondary trend plotted with the trend-line in green shows the acceleration of the downward movement that began on November 04th at 94.302.
Nevertheless, the breakdown of the last sideways range developed by DXY during the latest trading session, combined with the bullish divergence observed between the price and the EMA to Close indicator, makes us suspect a bounce, which could hit the resistance of the extreme bearish sentiment zone at 91.282.
Short-term Technical Outlook
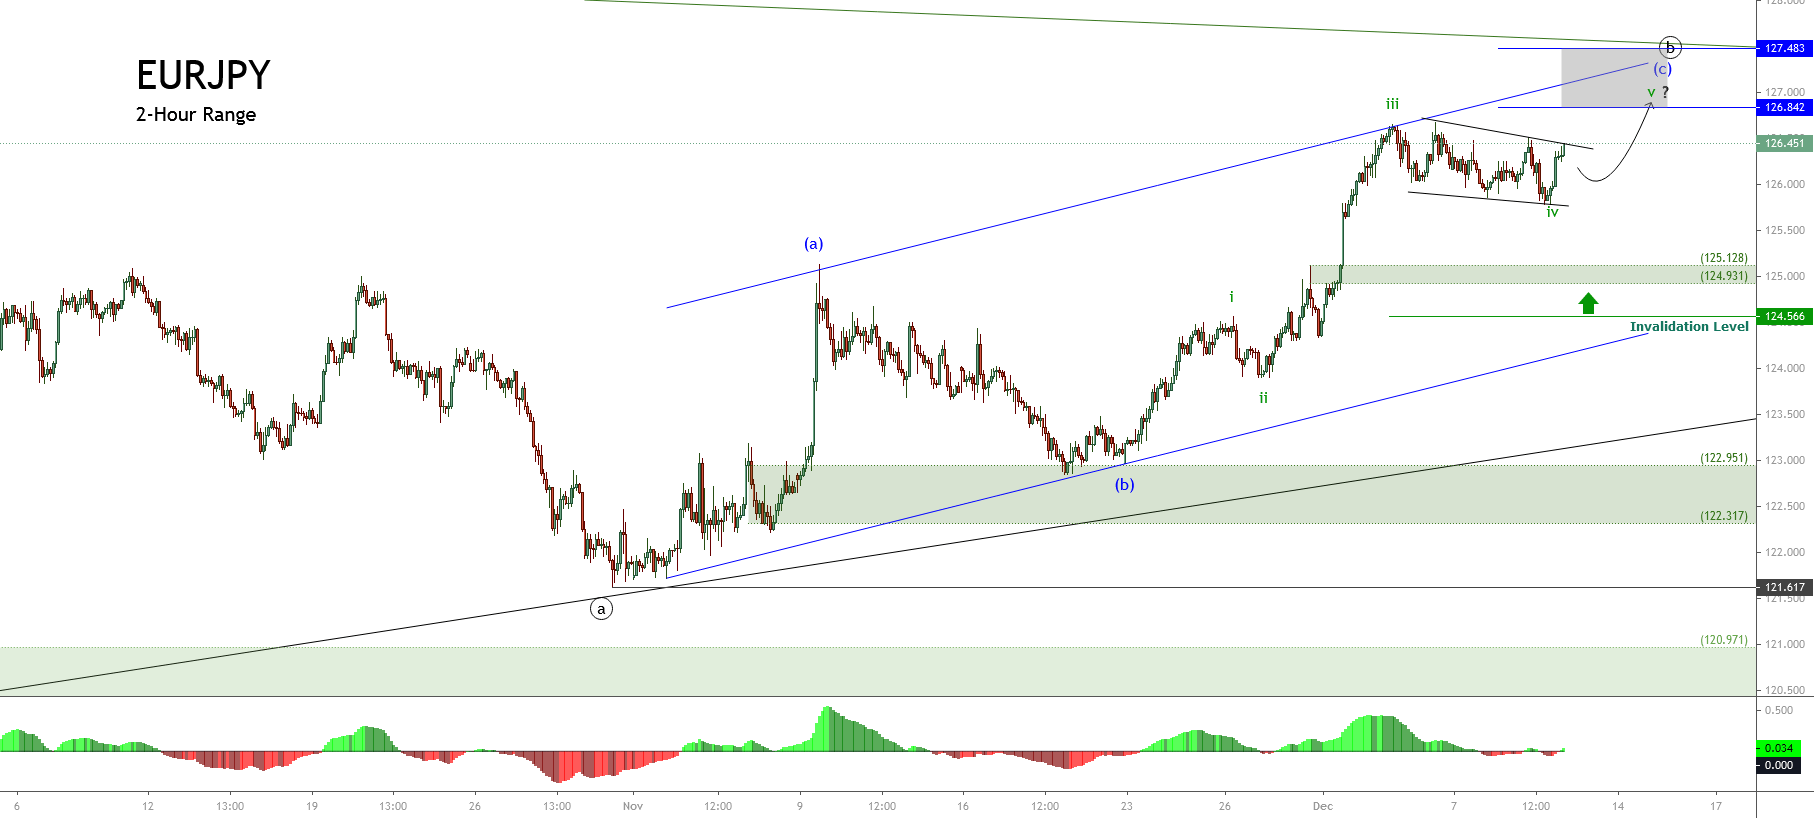
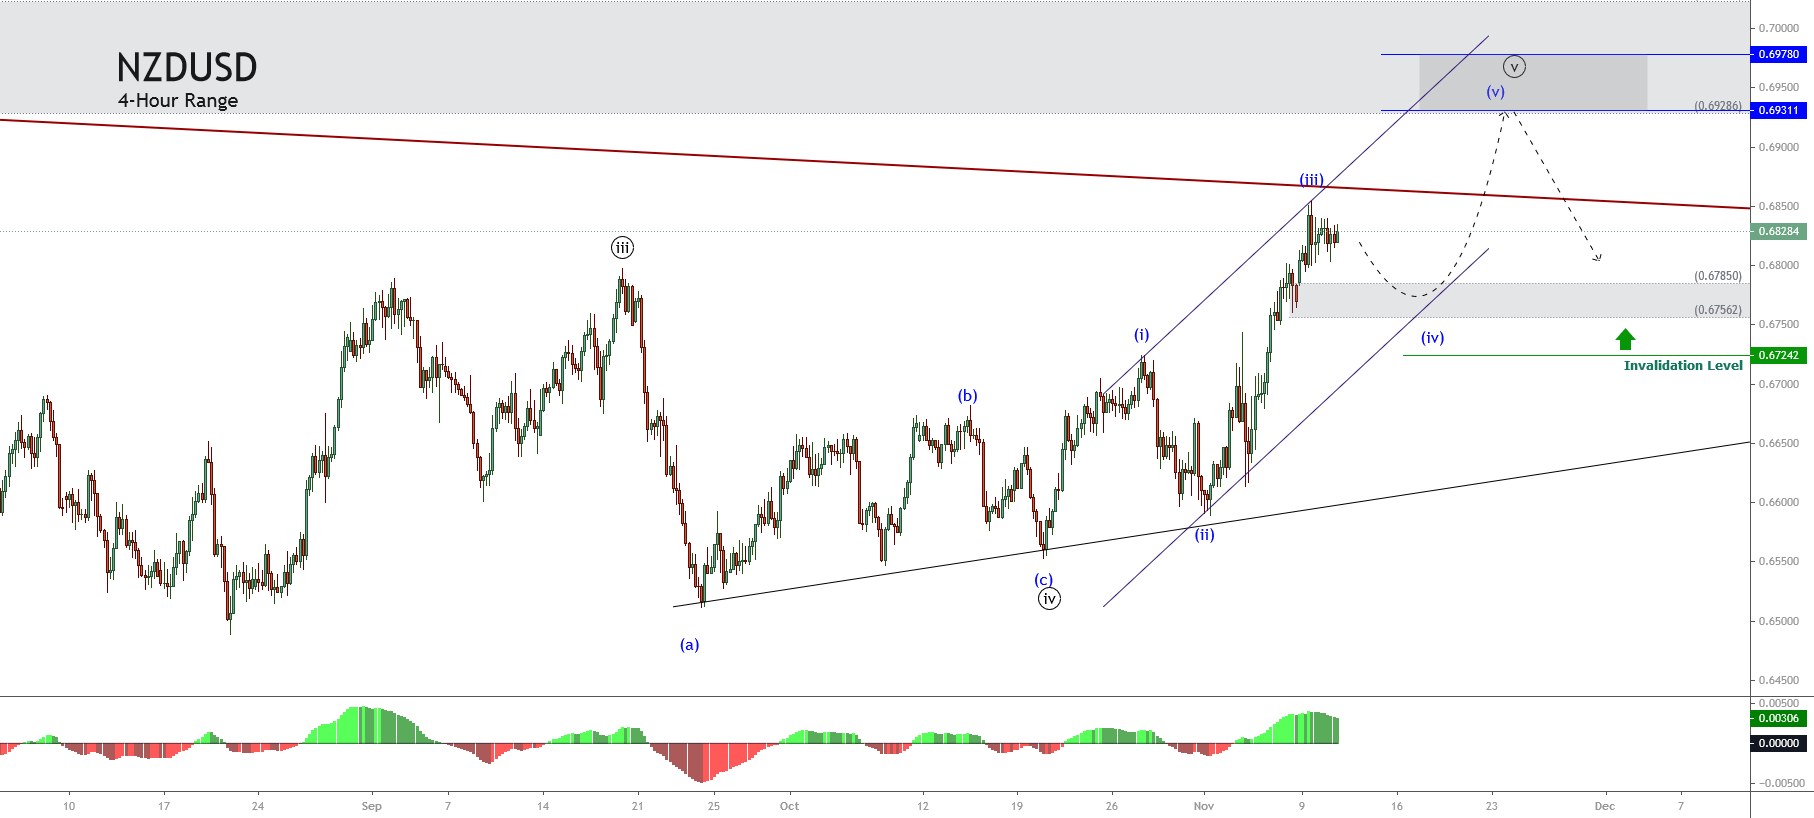
The short-term Elliott wave view for the US Dollar Index unfolded by the next 4-hour chart exposes the bearish progression of wave ((iii)) of Minute degree labeled in black that belongs to the downward sequence that began on November 04th at 94.302.
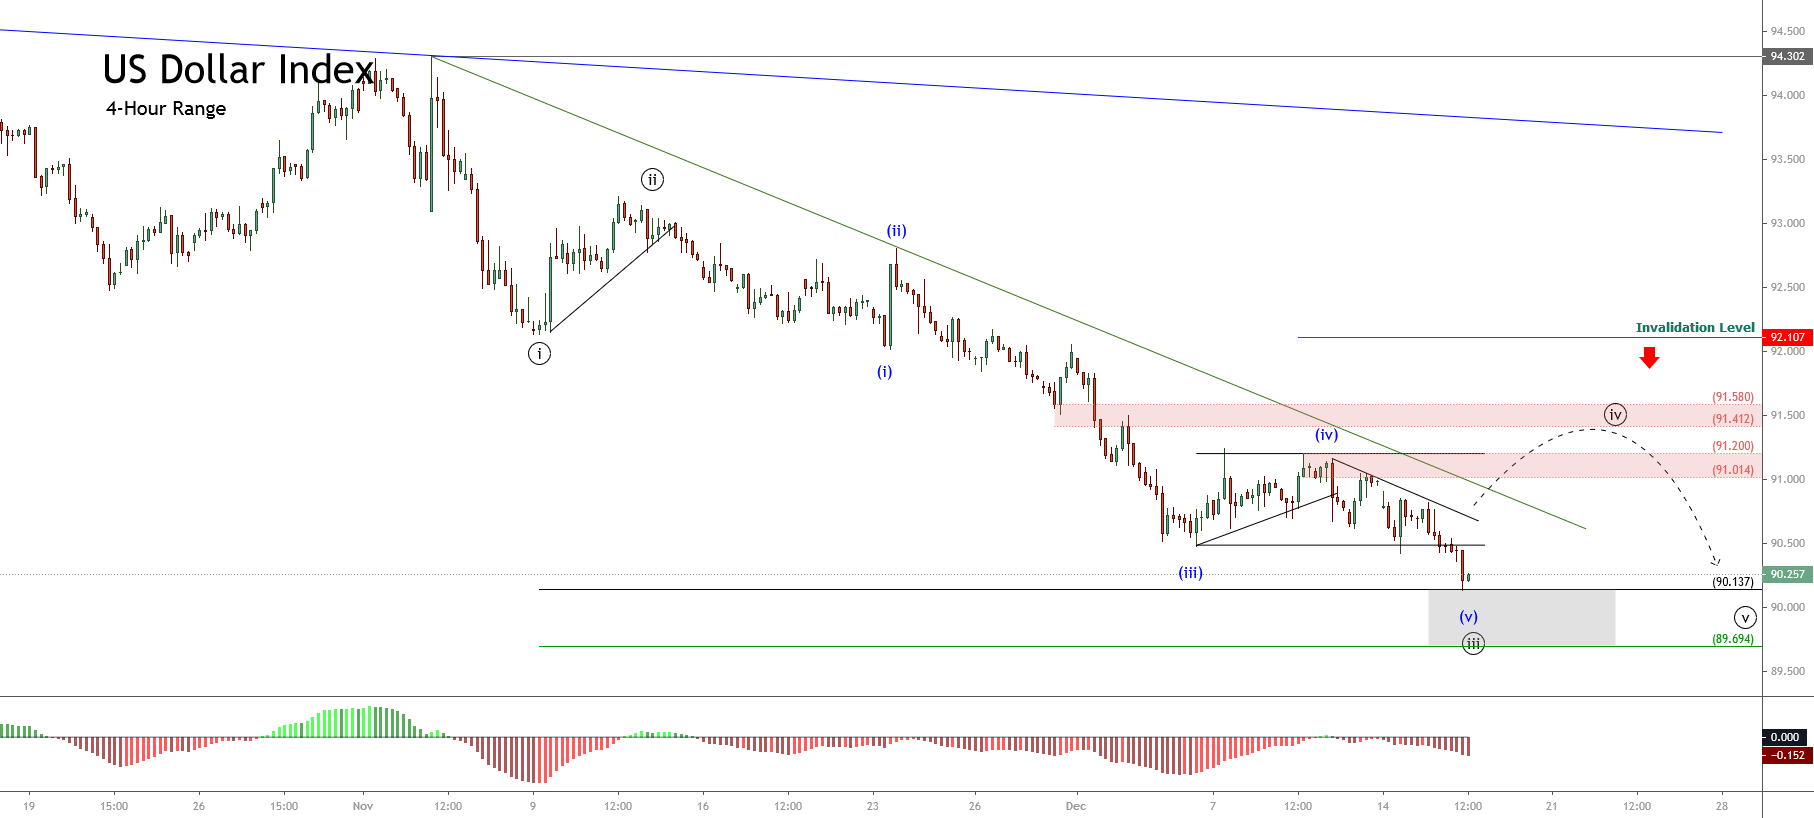
According to the textbook, the price action requires to confirm the third wave’s completion before acknowledging the start of the wave ((iv)) in black. In this regard, the internal structure of the wave ((iii)) added to the bullish divergence observed in the MACD oscillator; thus, suggesting the advance in wave (v) of Minuette degree identified in blue.
On the other hand, considering both the alternation principle and that the second wave of the same degree looks simple in terms of price and time, the next corrective structure should be complex in terms of price, time, or both.
In this context, the next DXY path could produce a bounce corresponding to the fourth wave of Minute degree, advancing to the supply zone between 91.014 and 91.200, and even strike the 91.580 level.
In summary, the US Dollar Index looks advancing in the fifth wave of Minuette degree that belongs to the third wave of Minute degree. In this context, the price action could experience a bounce corresponding to the fourth wave of Minute degree, which could move up to 91.850. Nevertheless, if the price surpasses the invalidation level located at 92.107, the Greenback could be showing the start of a reversal of the current bearish trend.