Categories
Forex Technical Analysis

US Dollar Index awaiting FOMC Meeting in the Extreme Bearish Zone

The US Dollar Index (DXY) reached a new yearly low of 90.128, expecting the last FOMC interest rate decision meeting of the year. The analysts’ consensus anticipates the rate unchanged at 0.25% by the FED.
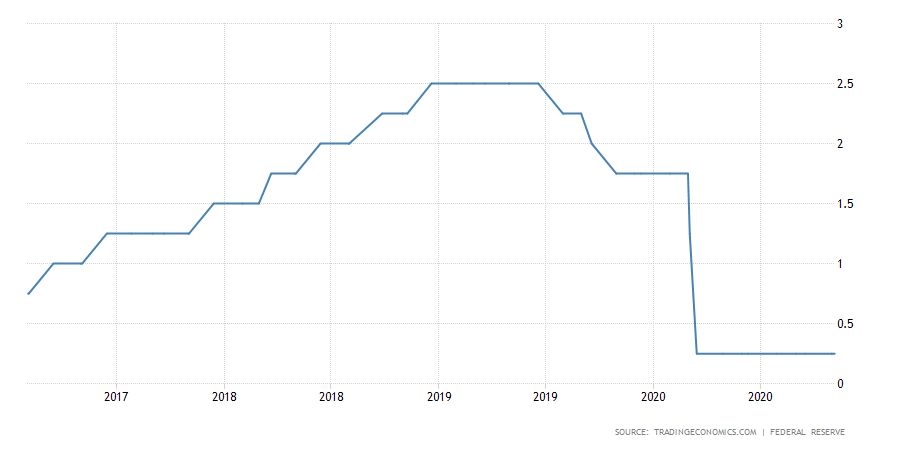
Source: TradingEconomics.com

Technical Overview

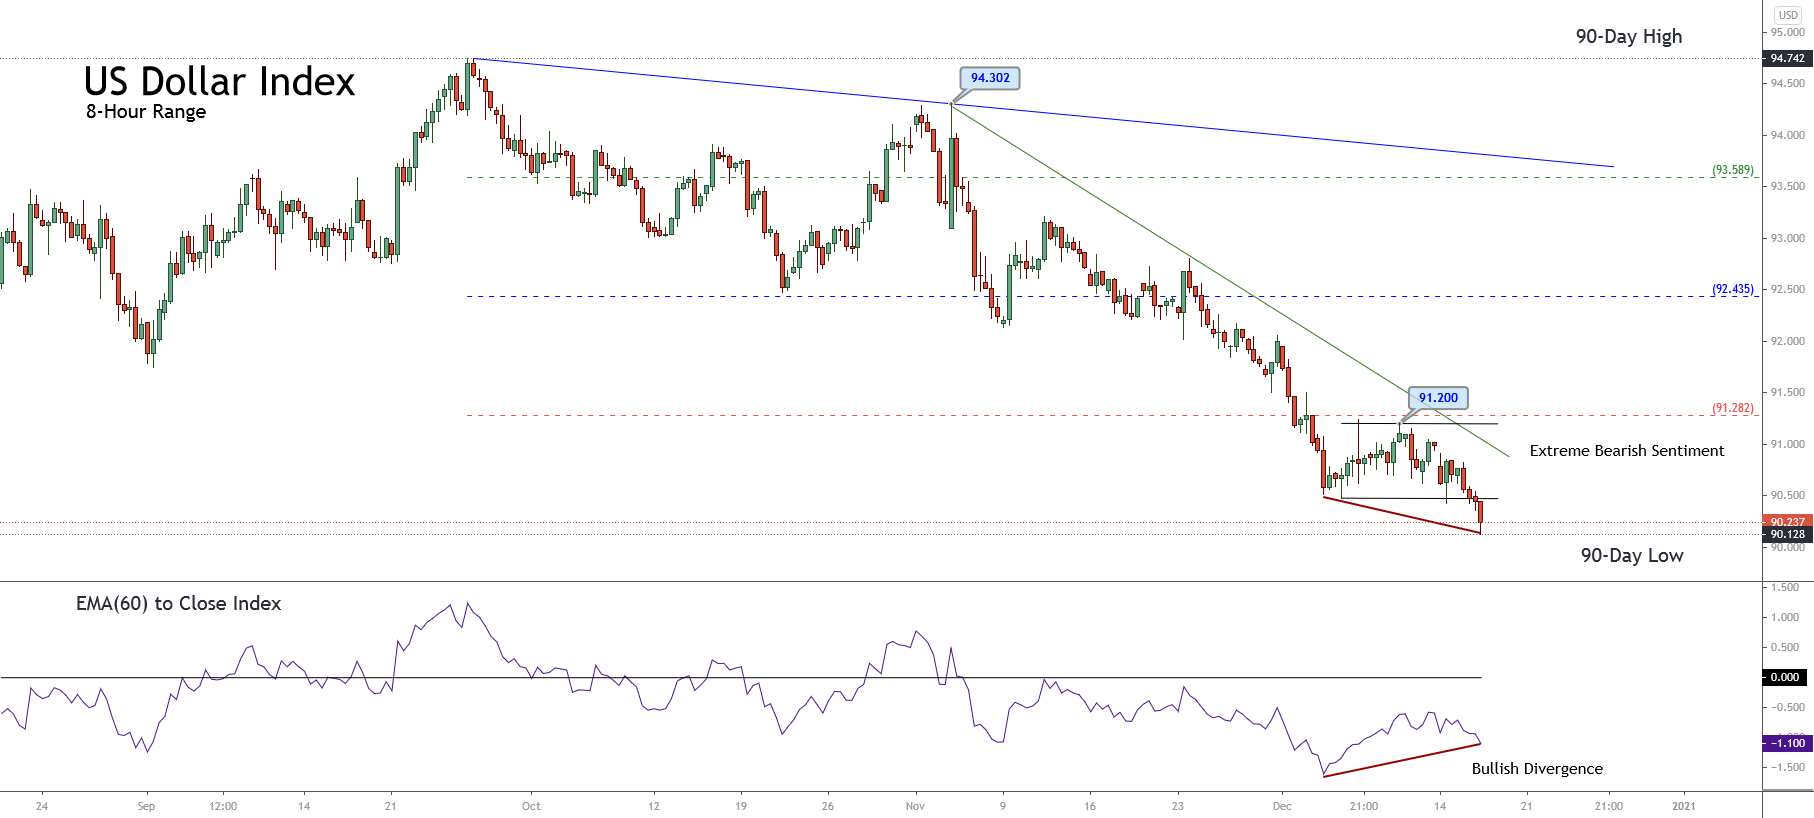
The short-term overview for the Greenback illustrated in the following 8-hour chart displays the short-term market participants’ sentiment unfolded by the 90-day high and low range, which shows the price action moving in the extreme bearish sentiment zone. Likewise, the bullish divergence observed on the EMA(60) to Close Index carries to expect a recovery for the following trading sessions.

On the other hand, the short-term primary trend outlined with its trend-line drawn in blue reveals that the bearish bias remains intact since September 25th, when the price topped at 94.742. The secondary trend plotted with the trend-line in green shows the acceleration of the downward movement that began on November 04th at 94.302.

Nevertheless, the breakdown of the last sideways range developed by DXY during the latest trading session, combined with the bullish divergence observed between the price and the EMA to Close indicator, makes us suspect a bounce, which could hit the resistance of the extreme bearish sentiment zone at 91.282.

Short-term Technical Outlook

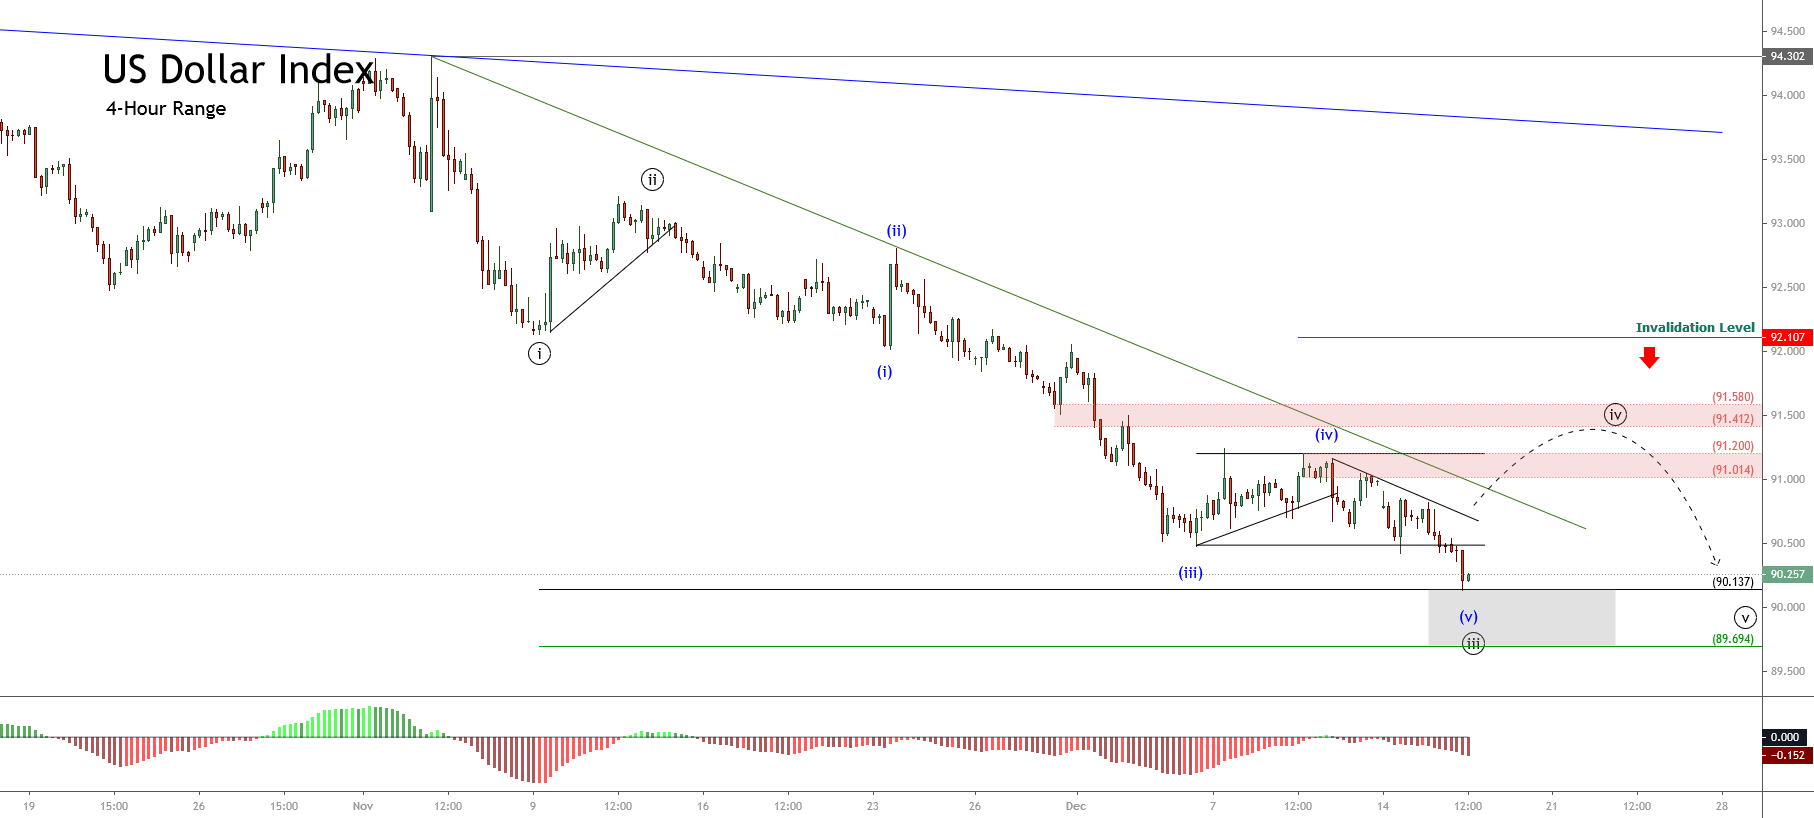
The short-term Elliott wave view for the US Dollar Index unfolded by the next 4-hour chart exposes the bearish progression of wave ((iii)) of Minute degree labeled in black that belongs to the downward sequence that began on November 04th at 94.302. 


According to the textbook, the price action requires to confirm the third wave’s completion before acknowledging the start of the wave ((iv)) in black. In this regard, the internal structure of the wave ((iii)) added to the bullish divergence observed in the MACD oscillator; thus, suggesting the advance in wave (v) of Minuette degree identified in blue.

On the other hand, considering both the alternation principle and that the second wave of the same degree looks simple in terms of price and time, the next corrective structure should be complex in terms of price, time, or both.

In this context, the next DXY path could produce a bounce corresponding to the fourth wave of Minute degree, advancing to the supply zone between 91.014 and 91.200, and even strike the 91.580 level.

In summary, the US Dollar Index looks advancing in the fifth wave of Minuette degree that belongs to the third wave of Minute degree. In this context, the price action could experience a bounce corresponding to the fourth wave of Minute degree, which could move up to 91.850. Nevertheless, if the price surpasses the invalidation level located at 92.107, the Greenback could be showing the start of a reversal of the current bearish trend.


Categories
Forex Assets

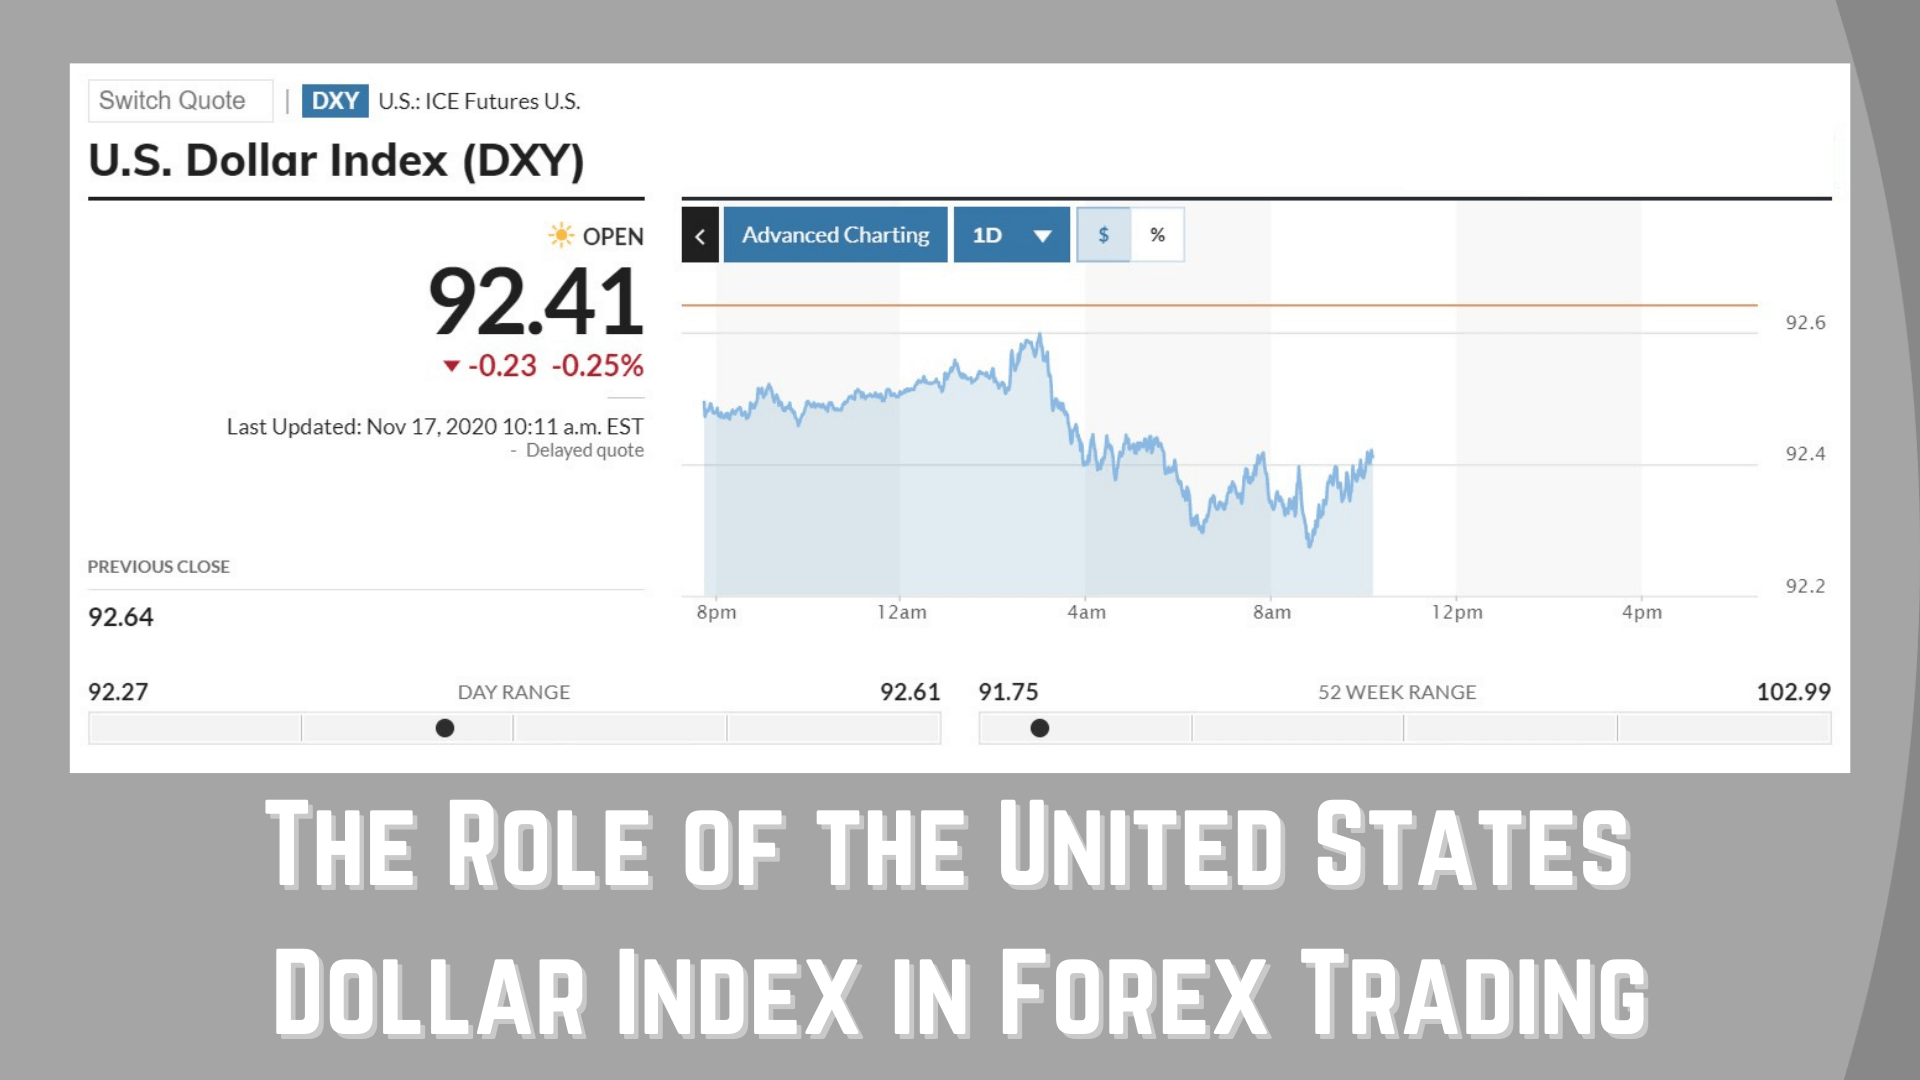
The Role of the United States Dollar Index in Forex Trading

The US Dollar Index is something that you often see mentioned around the trading world, if you haven’t seen it mentioned then it probably won’t be long until you do. If you haven’t, then it would be a good idea to get to know a little more about it, the US Dollar Index is a great tool that can help you to confirm if there is a directional bias for the currency pair that you are currently trading, it can also help to warn you of awesome potential barriers to your trade before you decide to place the trade.

The Federal Bank in the US is one of the more important central banks in the world, the US dollar is also one of the most traded currencies in the world making up to 70% of all transactions each day, so being able to have an idea of what the Dollar is doing on any day will give you a huge advantage for your trading and you as a trader, and that is exactly what he US Dollar Index will help us do.

So what exactly the US Dollar Index? It started back in 973 for the value of 100.000. In 1985 the USDX (US Dollar Index) traded for as high as 164.7200 and then on March 16 2008, it dropped as low as 70.698. So the USDX can range quite a bit moving both up and down, the ranges are often quite large having large trends. However, this is not always a guarantee and so this is why it should be used as an indicator only instead of as an actual trading tool to make trades.

The USDX is basically a measure of the US dollar in relation to a basket that will contain a number of the most important trading partners for the US. The basket has six different foreign currencies within it, with each currency having a different weighting due to the size of the country or countries using the currency, for example, the Euro has 23 different countries within it and so it is weighted slightly higher than a smaller one such as the Swiss Franc. The largest part of the USDX is made up of the Euro which currently weighted at 57.6%. The following currencies are included in the USDX:

  1. The Euro (EUR), 57.6% weight
  2. The Japanese Yen (JPY), 13.6% weight
  3. The Great British Pound (GBP), 11.9% weight
  4. The Canadian Dollar (CAD), 9.1% weight
  5. The Swedish Krona (SEK), 4.2% weight
  6. The Swiss Franc (CHF) 3.6% weight

So it is clear that the value of the USDX is influenced quite heavily by the Euro, this is one of the clues as to why the USDX will be useful for us as traders when it comes to making trading decisions.

The USDX can actually be seen as a kind of anti-euro indicator, due to the Euro having such a high weighting on the USDX, it means that there is a kind of negative correlation between the two. When the Euro falls the USD will generally rise, and when the Euro rises the USDX will generally fall. Knowing this can mean that we are able to use the USDX as an indicator for the potential movement of the EUR/USD pair. 

The USDX can also be seen as a guide for the direction of the USD traded against pretty much any pair. When you trade a currency pair that has the USD in it, it will be guided by the USDX. If the USD is the base currency within a trading pair, then the USDX and the currency pair will typically move in the same direction. If the USD is the quote currency (second currency) then the USDX and the currency peri will often move in the opposite direction.

There is something known as the smile theory, this is basically a good way of mentally remembering the three different ways that the dollar responds to different situations. It is called the smile theory because the three different situations create the shape of a smile. On the left of the smile at the top, we have the USD strength that is formed when the global economy is starting to struggle. The bottom part of his smile is where the USD depreciated on something known as a dovish feed. The right side of the smile, the right upper part, is when the USD gains value on something known as a hawkish feed and risk on the environment. This then creates a smile like a graph. The smile theory allows you to get an overall picture of understanding where the dollar is at present and what is likely to happen next.

If you manage to get into the habit of looking at the US Dollar Index prior to making any trades, it gives you another indication of what could happen and could also be used as an additional confirmation for your trades. As with anything in trading, nothing is a guarantee, you cannot rely on the USDXto show you the exact direction or exactly what any currency or currency pair will do, simply use it as an indicator and nothing more. It can be quite a powerful tool and can really give you a little edge when trying to work out the potential direction and bias of the markets, so it is a good idea to get to grips with how it moves and how it works in order to implement it into your own trading analysis.

Categories
Forex Market Analysis

Dollar Index reaches its highest level since December 2017.

Hot Topics:

  • Dollar Index reaches its highest level since December 2017.
  • Indices return to the bullish path
  • EURAUD advances as forecasted.

Dollar Index reaches its highest level since December 2017.

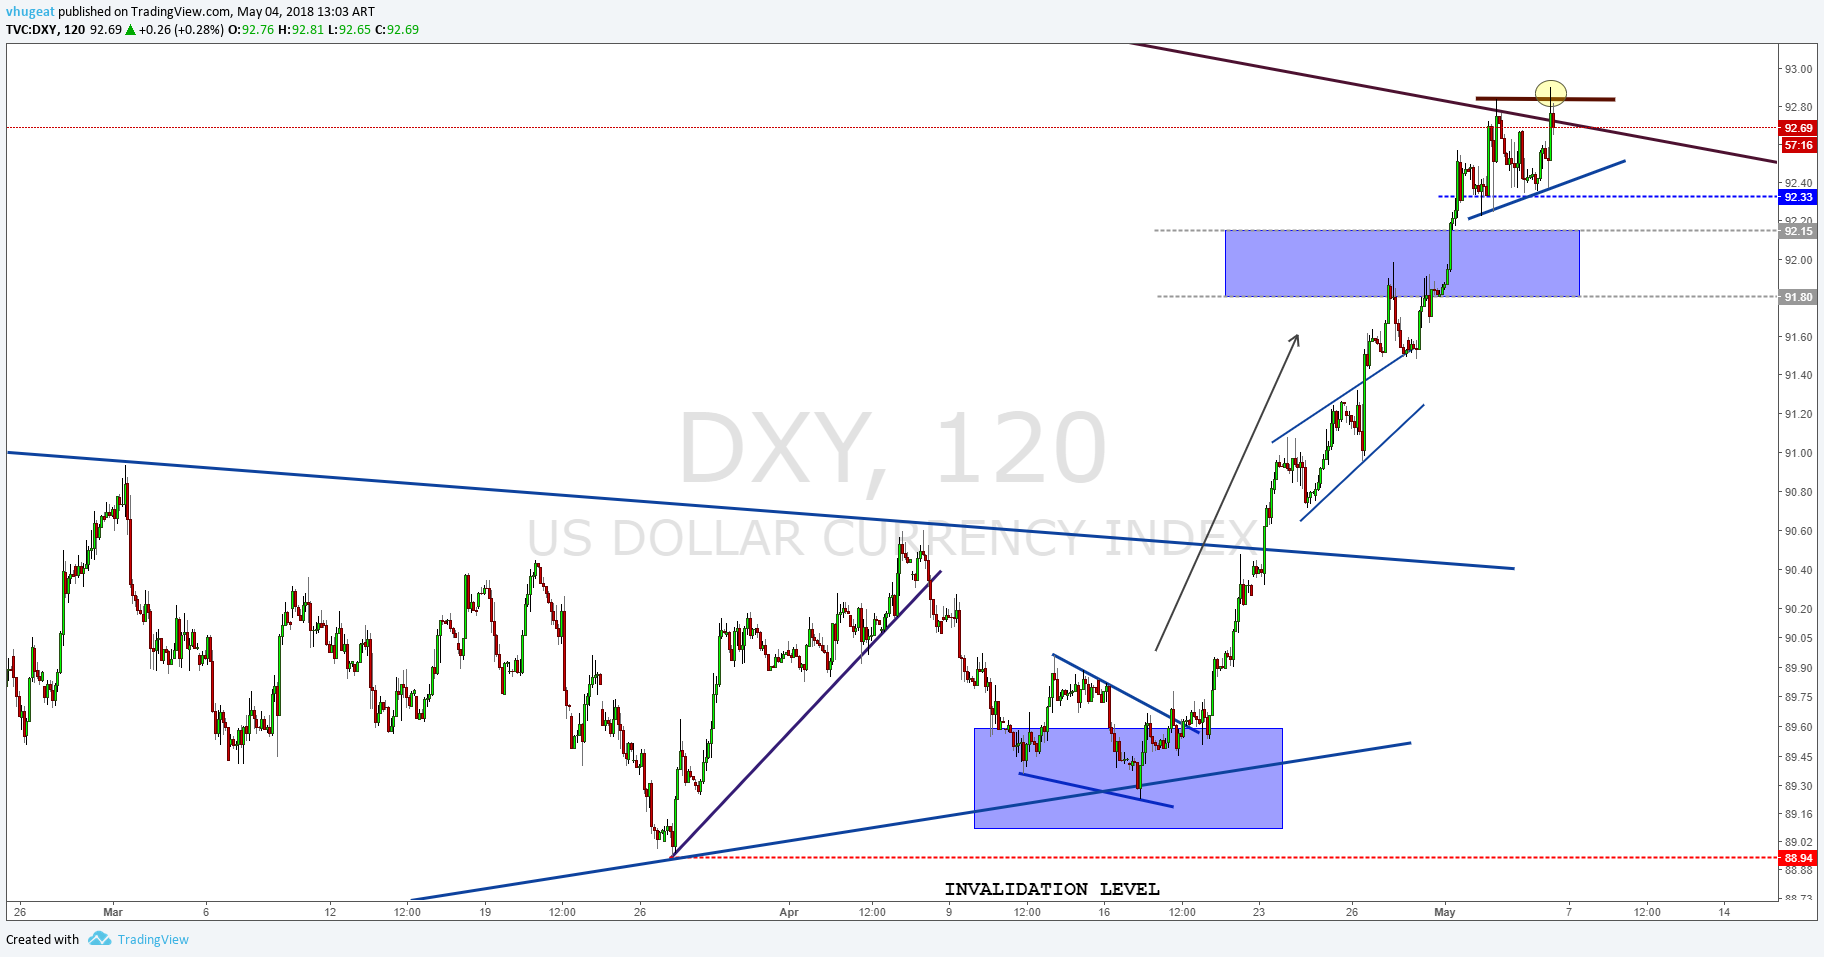
The dollar index rose to 92.74 after the employment data from the United States, its highest level since December 2017. The unemployment rate fell in April to 3.9% from the 4.1% achieved in March, the lowest rate for more than 17 years. Technically, the greenback reached 92.74 and began to draw back forming a potential bearish 2B pattern.

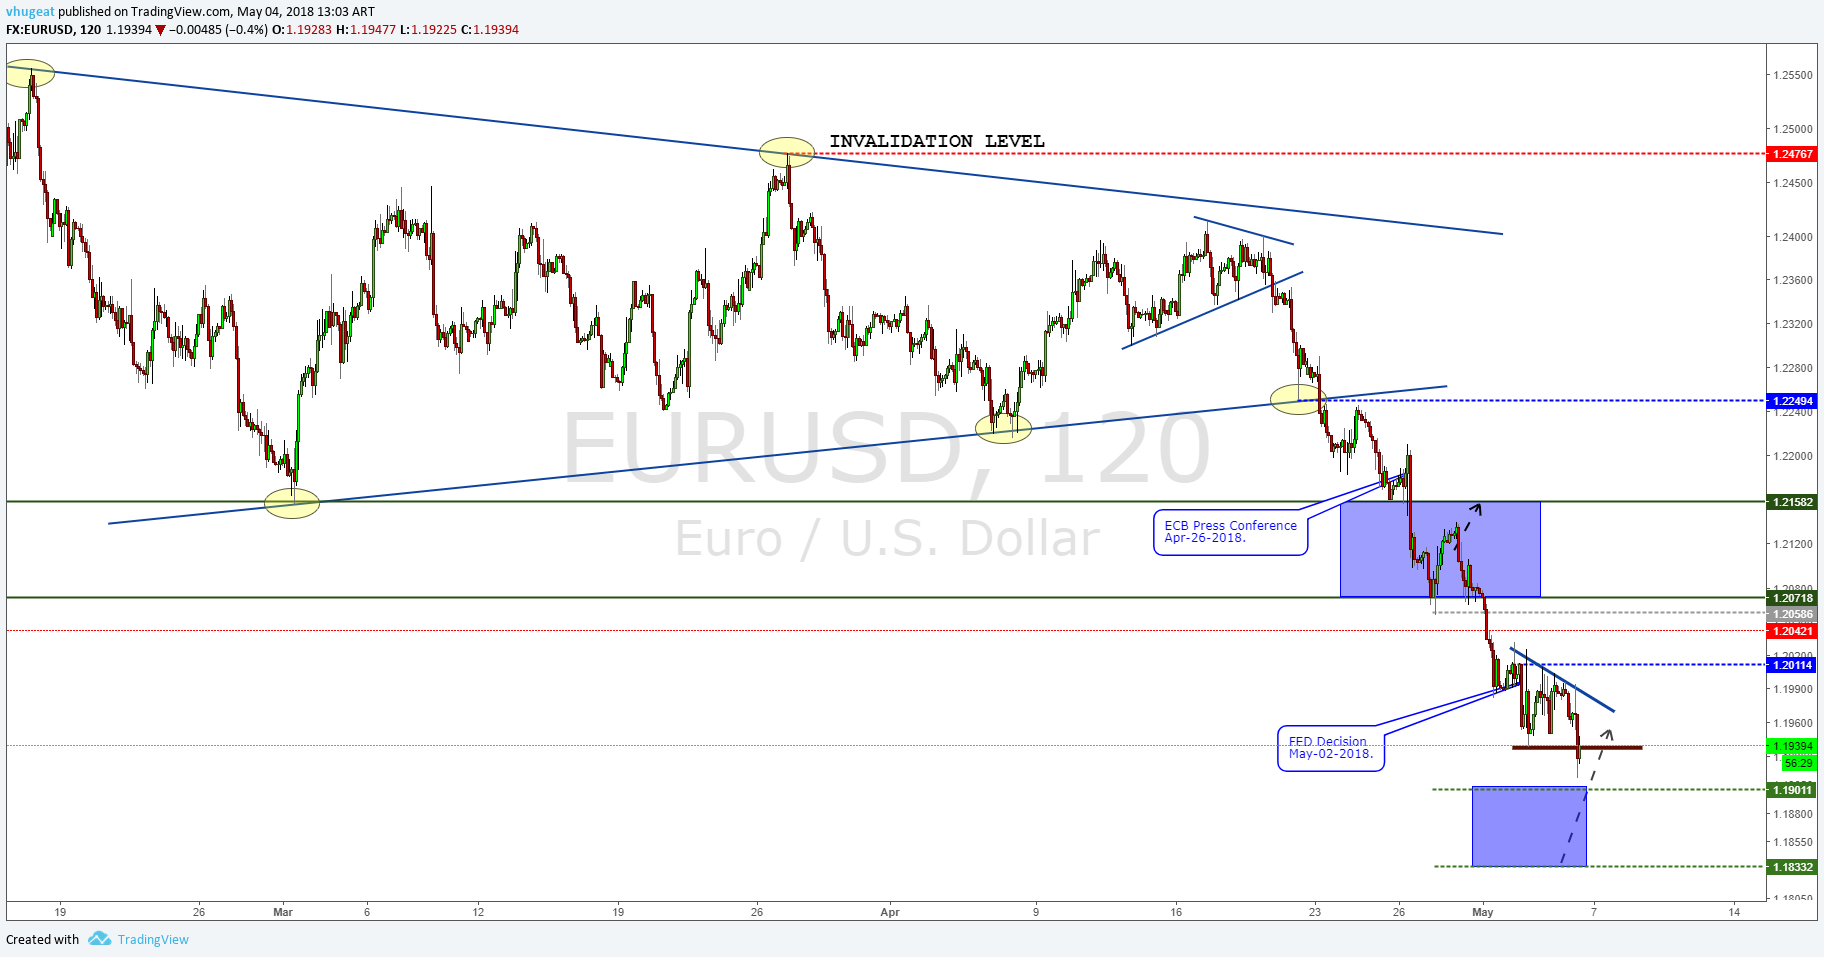
The single currency reached the potential reversal zone, testing the support level at 1.19 from where it began to bounce. From this area, we will be monitoring long positions in the EURUSD.

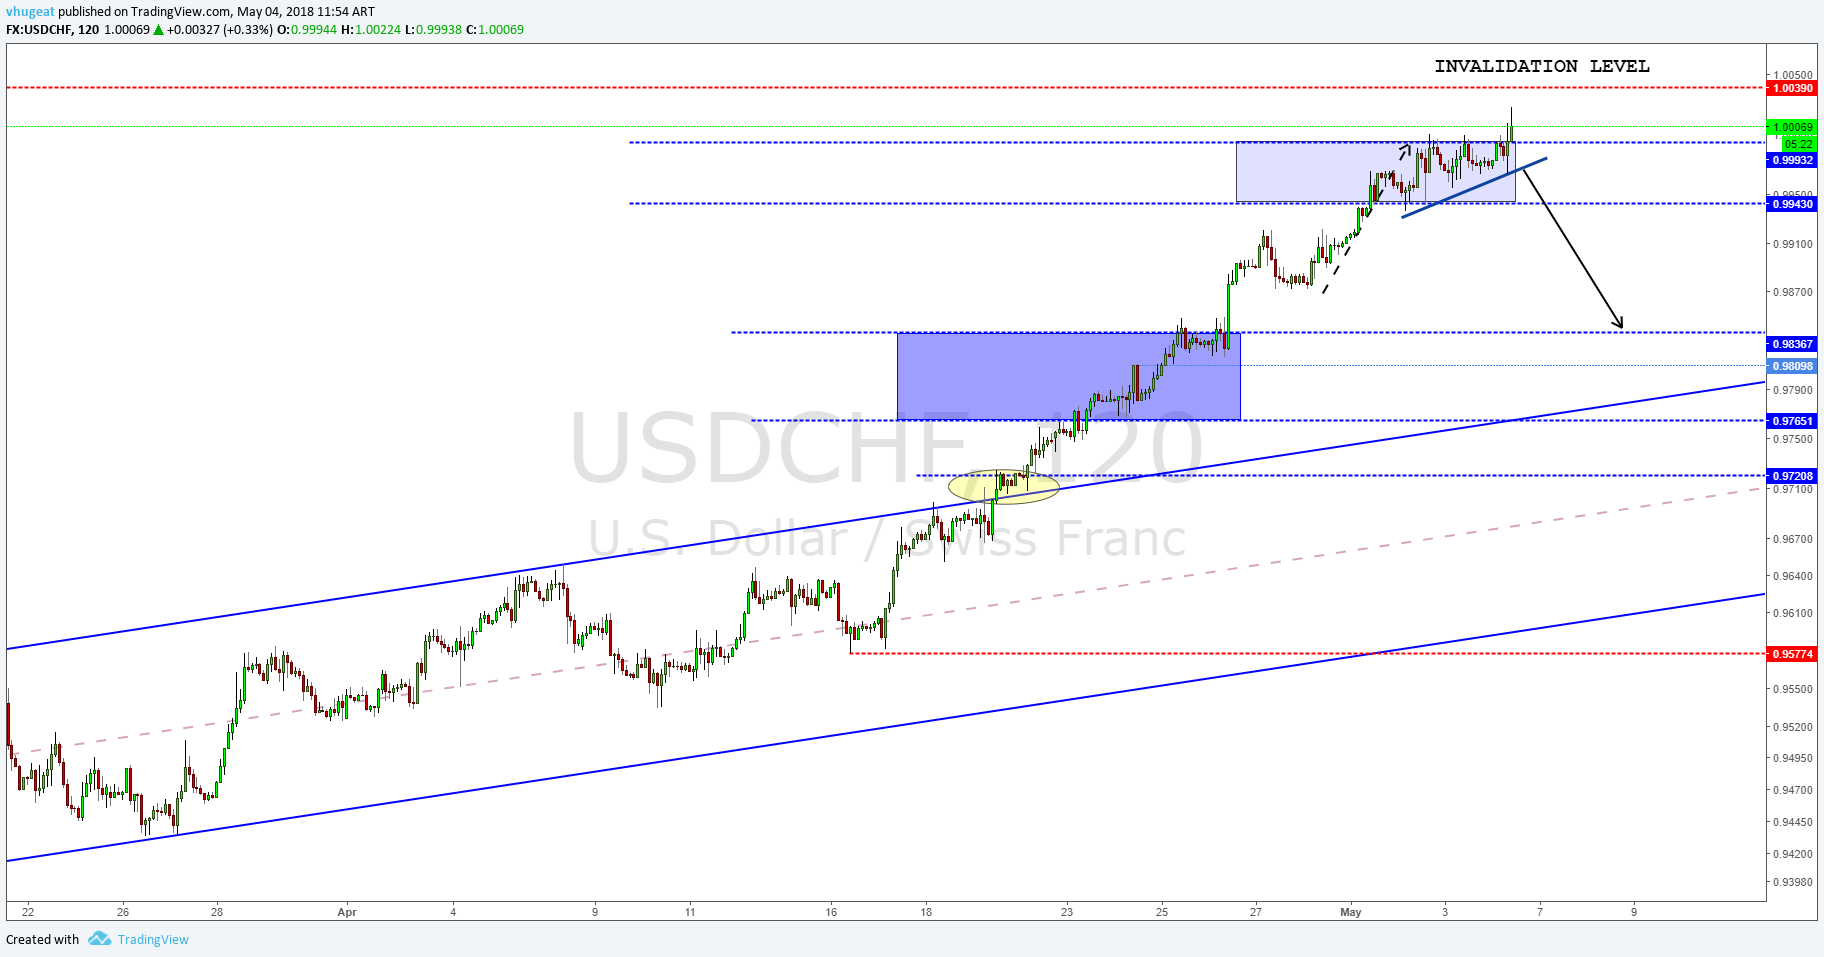
The USDCHF made the same move as the dollar index, climbing to a new higher high, but it still did not touch the level of invalidation we have forecast in previous updates (above 1.0370). Short positions will be valued below the 0.9973 level, the invalidation level for short positions remains intact.

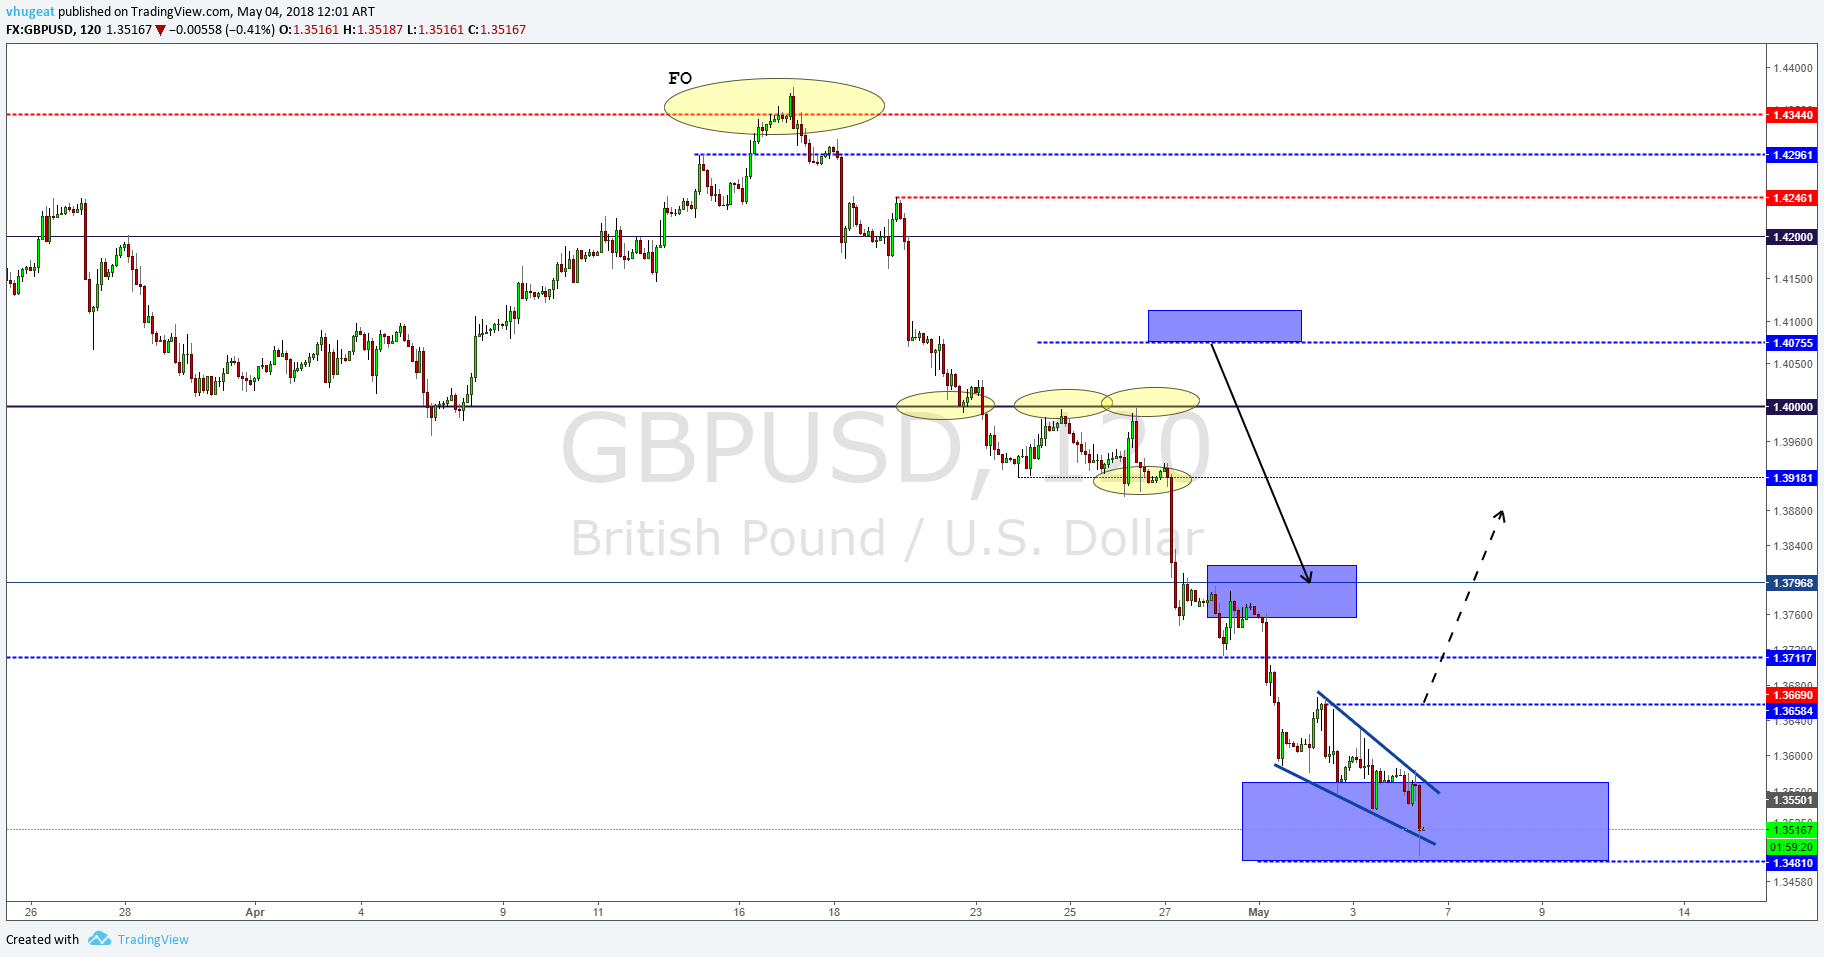
The cable, as in the case of the EURUSD pair, made a new low at 1.3488 developing a potential ending diagonal pattern. Once the breakout occurs it will be validated; we could begin to place long positions. In the meantime, we will remain alert to the movements that it carries out.

Indices return to the bullish path

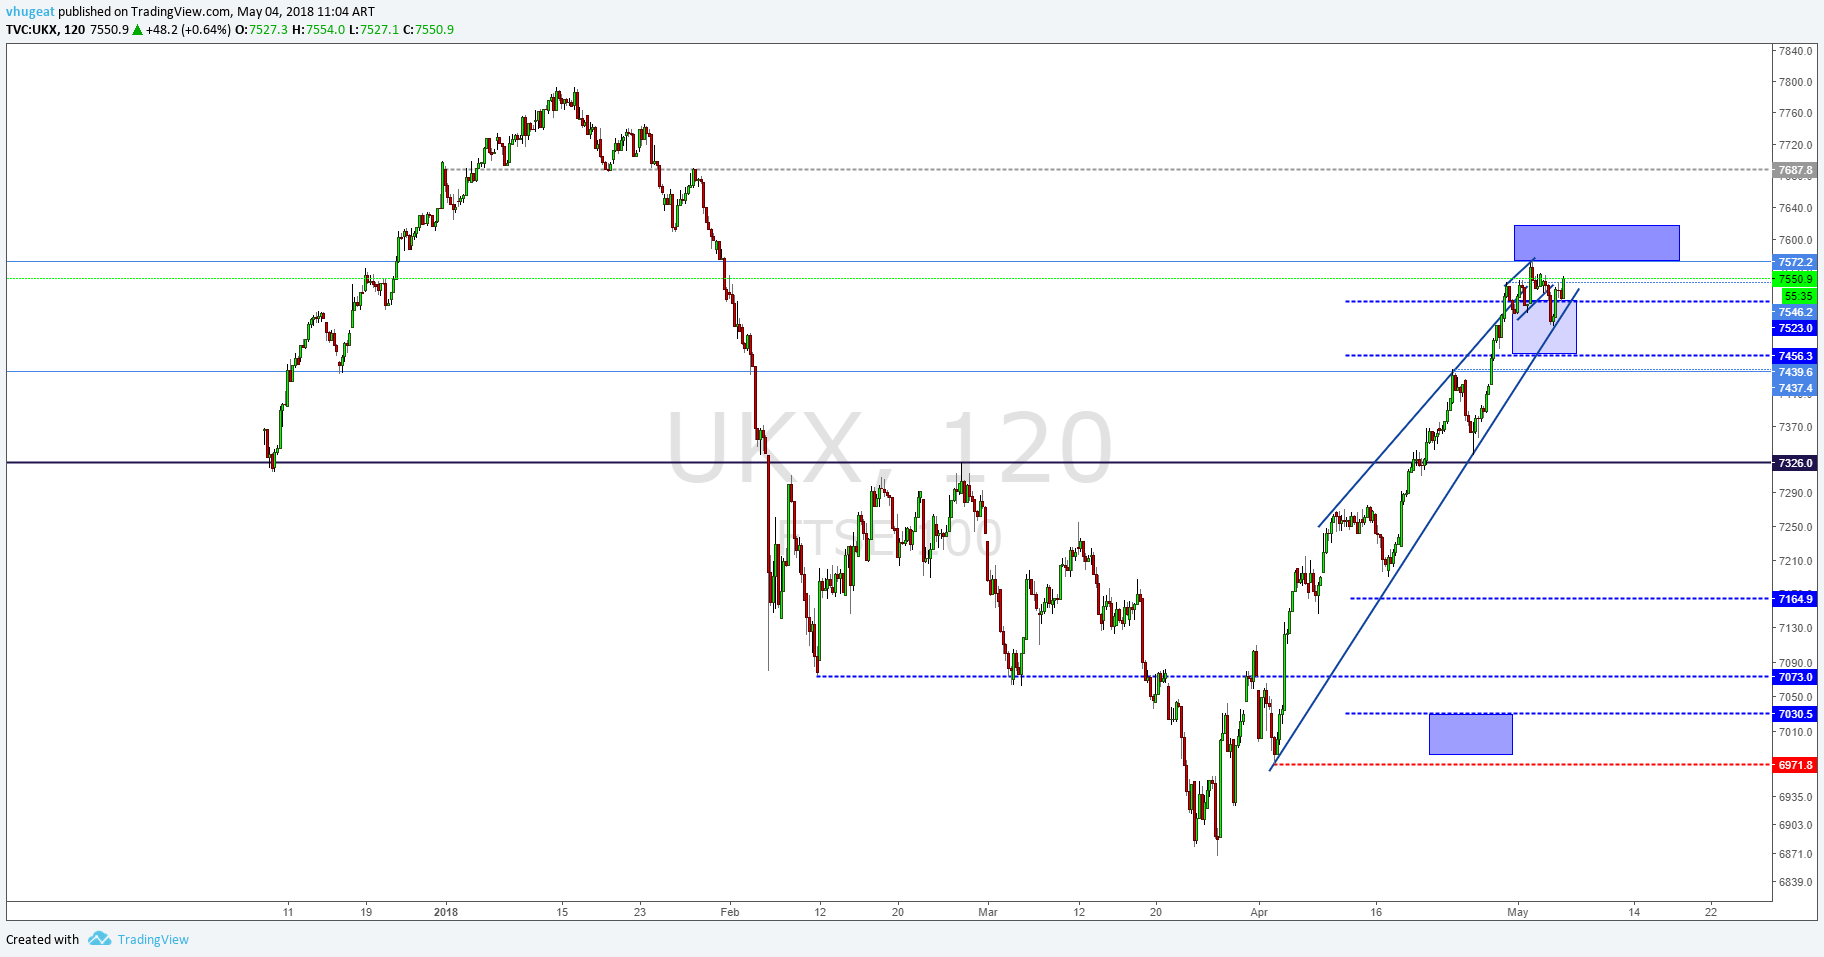
The FTSE short position proposed yesterday has been invalidated when its price has been rejected at the lower edge of the rising wedge, drawing a bullish movement. For now, the index is in our potential reversal zone so we will maintain our neutral position.

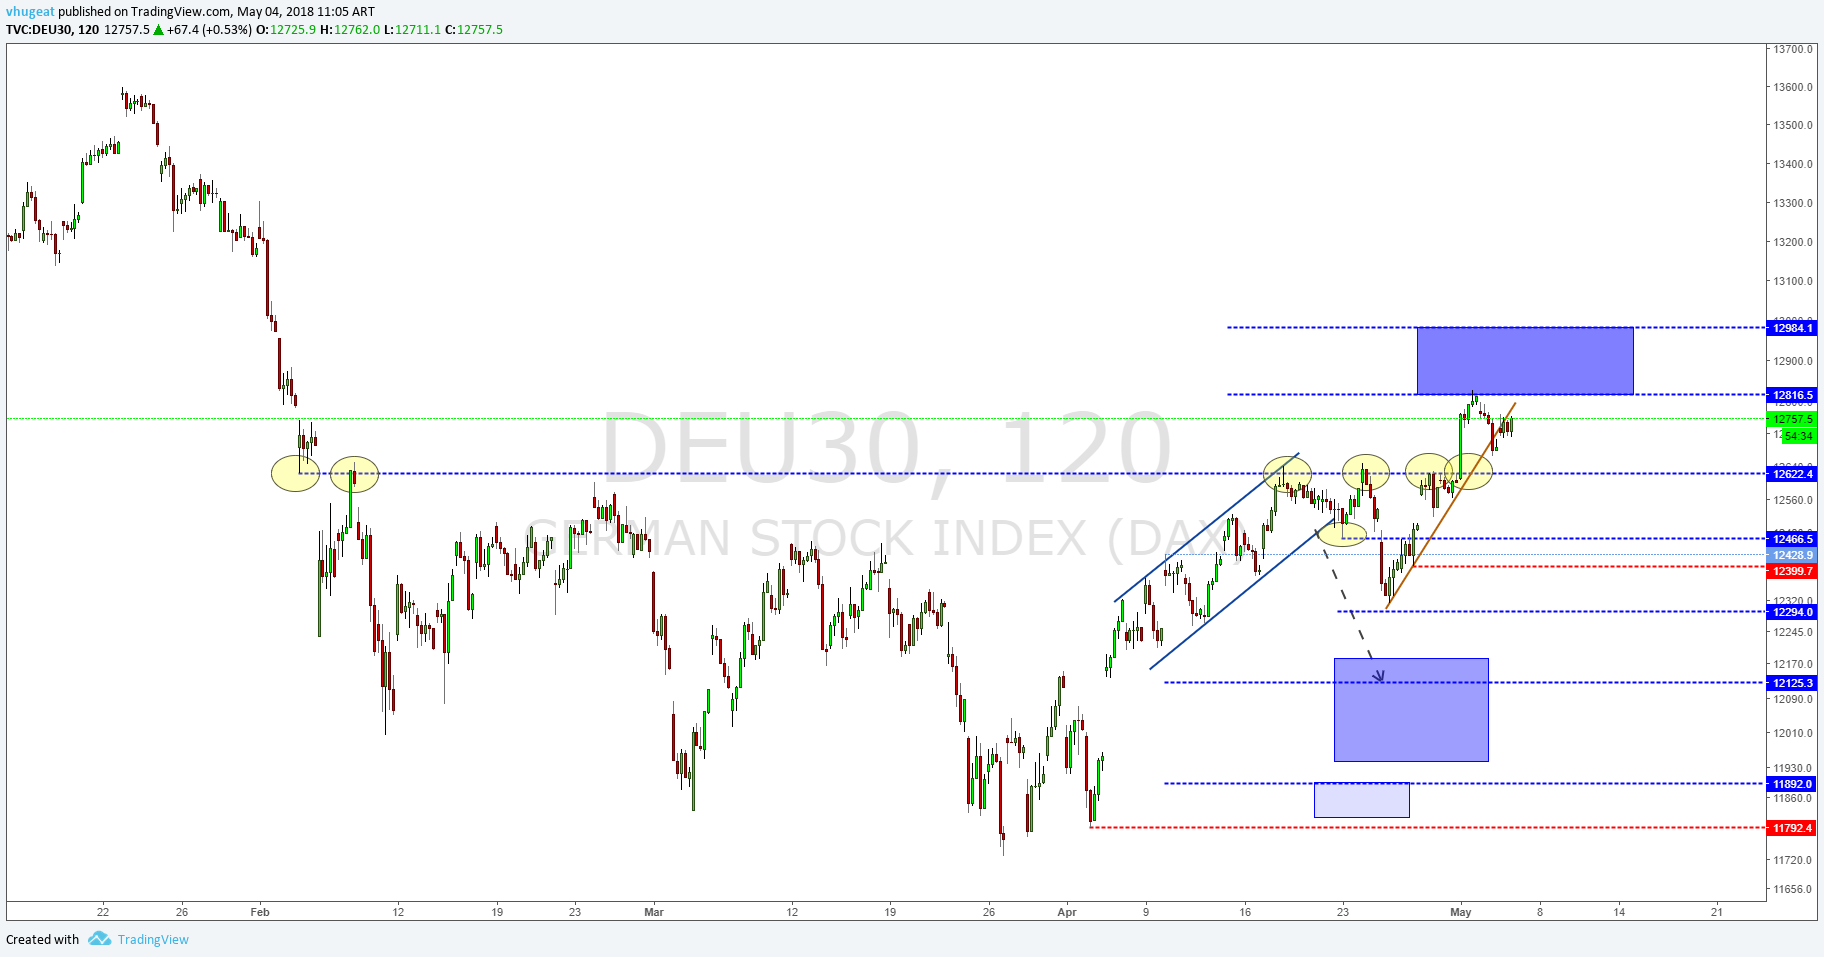
The DAX 30 continued moving bullish in the current session with all eyes on the next psychological resistance at 13,000 points. The invalidation level is 12,400 pts.


EURAUD advances as forecasted.

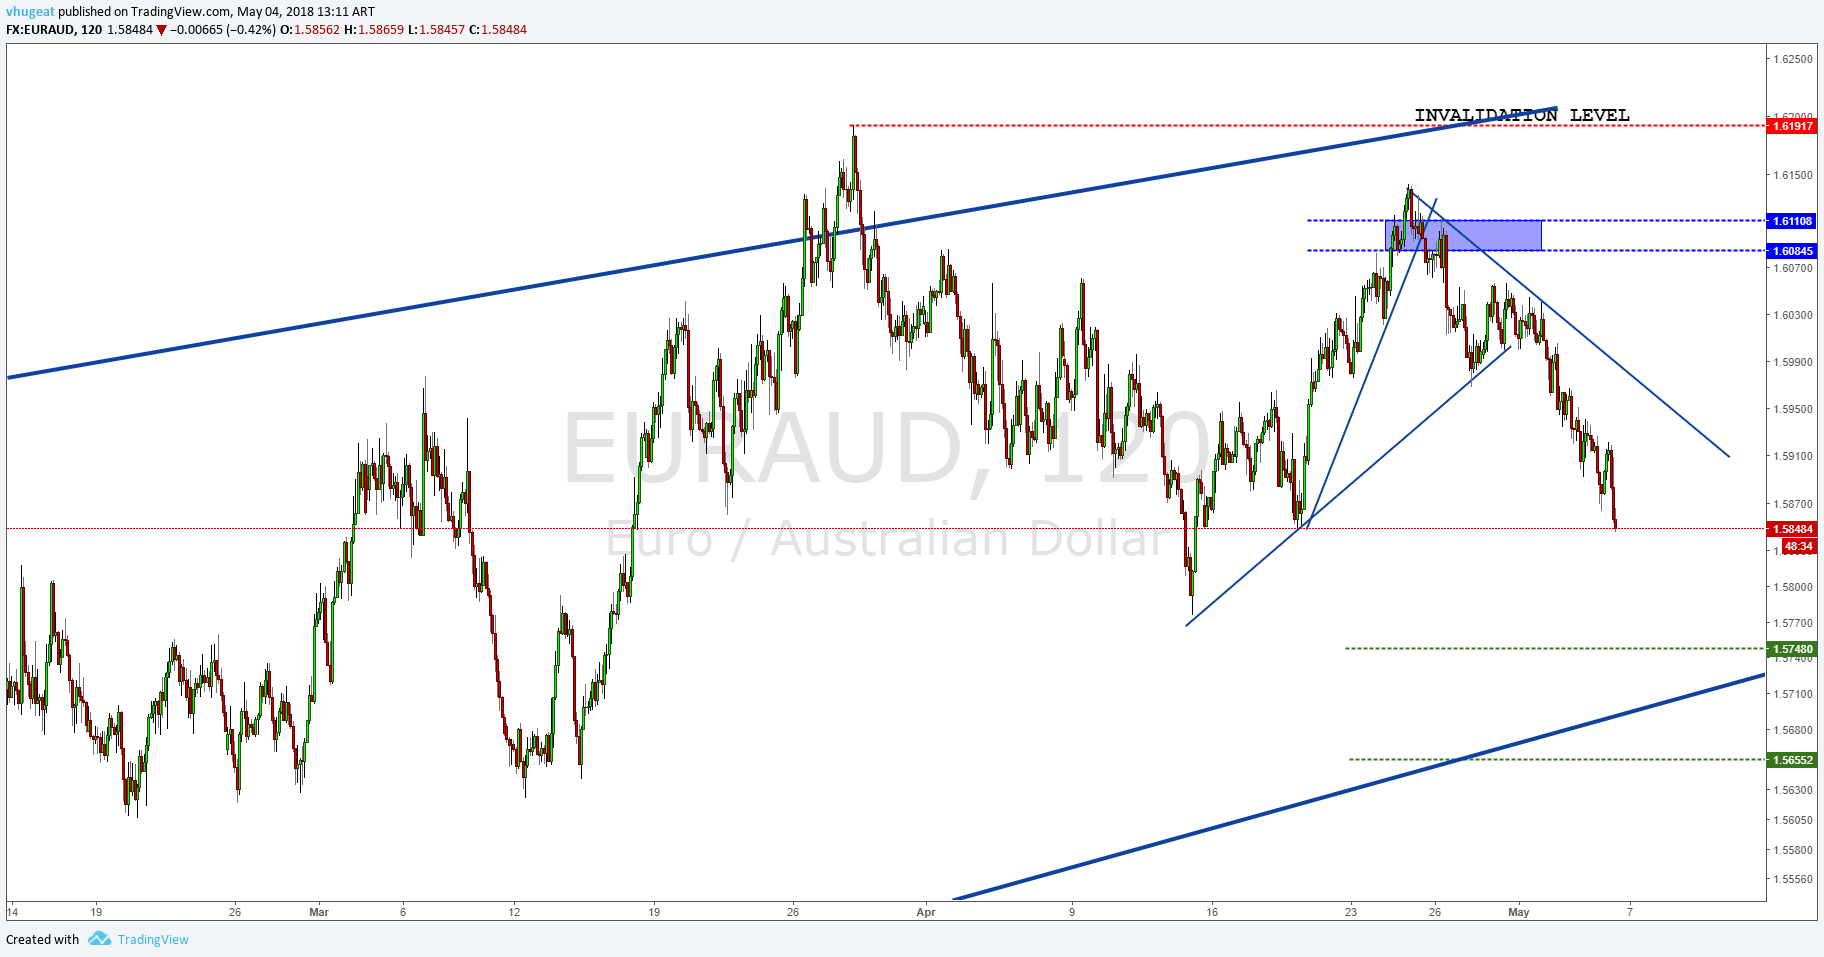
The cross continues moving on the bearish trend we have been forecasting since January and out of which we have been profiting when we took short positions at 1.6084. It is time to move our stop-loss to break-even, and possibly, take partial profits.


©Forex.Academy

Categories
Forex Market Analysis

Business survey of the Bank of Canada is optimistic


Hot Topics:

  • Business survey of the Bank of Canada is optimistic.
  • How much could it cost to Facebook, the loss of users confidence?
  • Dollar Index the weakness remains..

Business survey of the Bank of Canada is optimistic.

The results shown by the survey of the Spring Business Outlook published yesterday by the Bank of Canada (BoC) reflects the confidence of the business sector, which is supported by good prospects for sales in most regions and sectors. Considering the credit conditions that remain intact, respondents continue to maintain their intentions in the increase of investments, however, expect a slight adjustment in conditions.

On the technical side, the loonie is within a bearish wedge formation. The price is testing 50% of the entire previous bullish cycle. Added to this, it has also reached and broken the psychological level of the 1.27, which is acting as support at this time. Our vision is that between the 50% and 61.8% zone, it should begin to develop a bullish movement up to the area of 1.29 – 1.30. In the short term, the dominant trend is bearish. Bullish positions are valued above 1.2745.

How much could it cost to Facebook the loss of users confidence?

The social network created by Mark Zuckerberg is still in the midst of criticism. The Facebook scandal that began with Cambridge Analytica, where it was revealed that the private data of 87 million users were sold and used with the aim of manipulating the decisions of the users and that it was later shown that the private data of the most of 2 billion users are vulnerable. It has led his CEO to have to testify in front of the United States Congress. Senator John Neely Kennedy mentioned that he agrees to regulate Facebook. Senator John Thrune, meanwhile, said that “the biggest question that Mark Zuckerberg should answer is what Facebook is responsible for what happens on its platform, how it will protect users’ data and how it intends to stop harmful behaviours instead of being forced proactively.”

The problems for the social network are not limited to the attempt to regulate their activity and control of the privacy of information, or to the campaign with the hashtag #DeleteFacebook that has been promoted since the scandal was announced. The price is developing a bearish corrective structure that is testing the long-term trend line. On the other hand, the stock has been below the 200-day exponential moving average, changing the market sentiment to bearish. Structurally, we expect the price to reach $ 149 and could fall between $ 129 to $ 121 as the target level. The closest resistances are $ 162 and $ 167, while the most relevant supports are $ 149 and $ 145.

Dollar Index the weakness remains.

The index of the green ticket continues in a lateral range, with a clear resistance in 90.3, which has not yet been overcome. The key control areas are 89.5 and 89.1, levels that could act as pivots in the medium term. Our long-term vision remains bearish with pending objectives in the area of 87.6 – 86.5.

©Forex.Academy