Categories
Forex Elliott Wave Forex Market Analysis

Will 1.24 be the Next EURUSD Yearly High?

The EURUSD pair continues extending its gains after surpass its psychological resistance of $1.22 for the first time since late April 2018. The common currency gained over 9.20% (YTD), encouraged by the US Dollar weakness.

Technical Overview

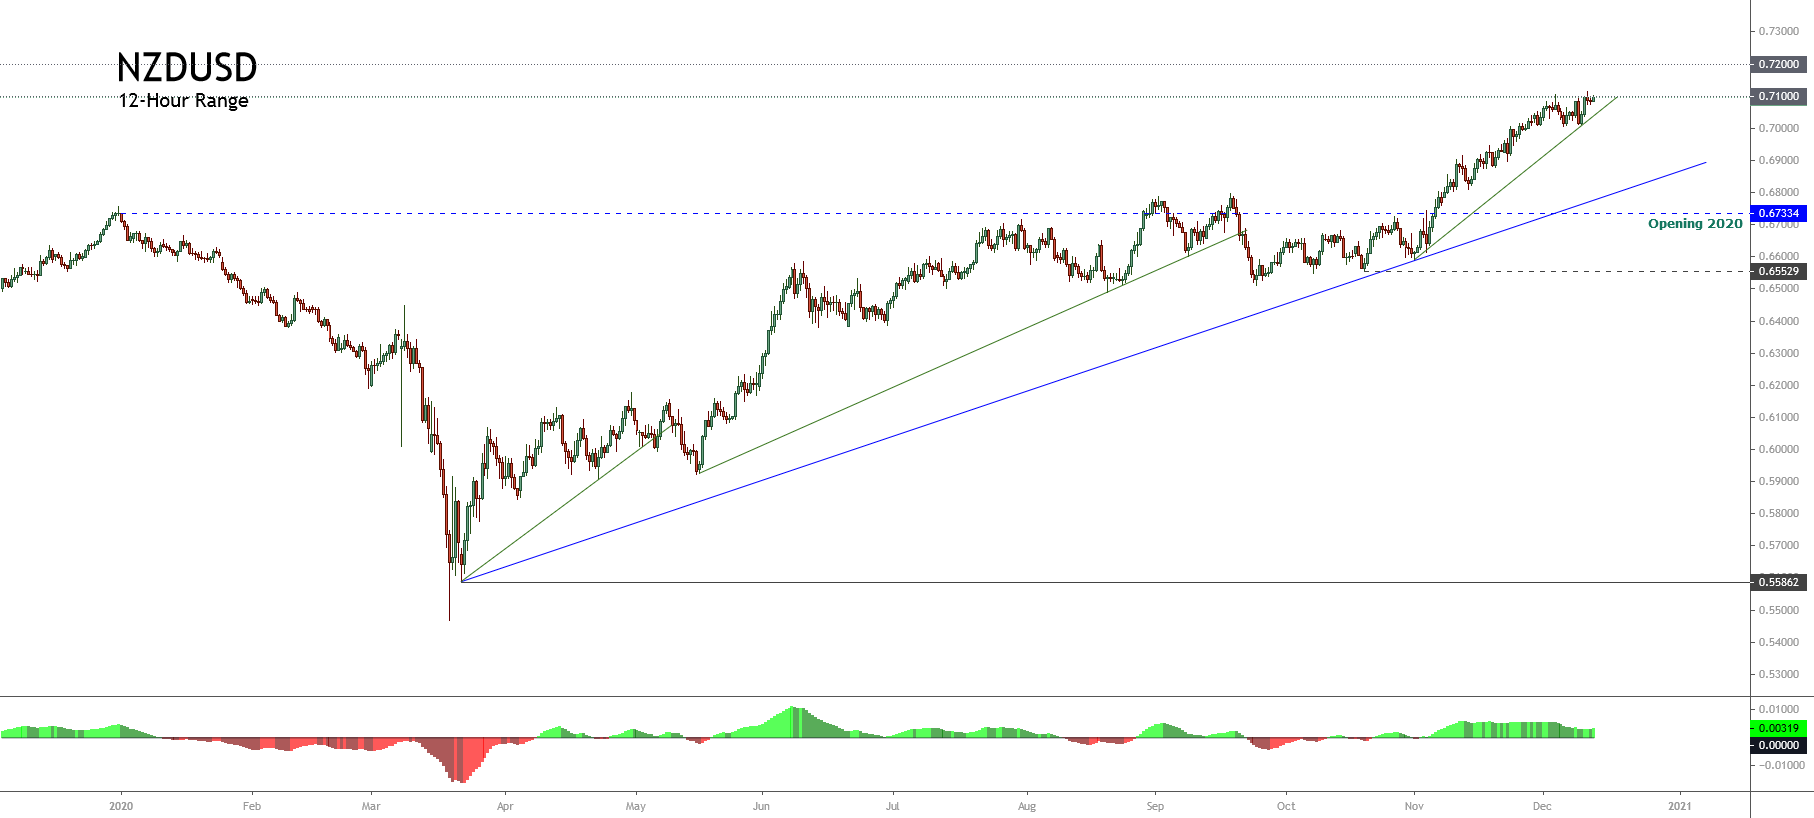
The following daily chart illustrates the long-term market participants’ sentiment unfolded within the 52-week high and low range. The figure shows the progression starting from 1.06359, which corresponds to the lowest level of the year. 

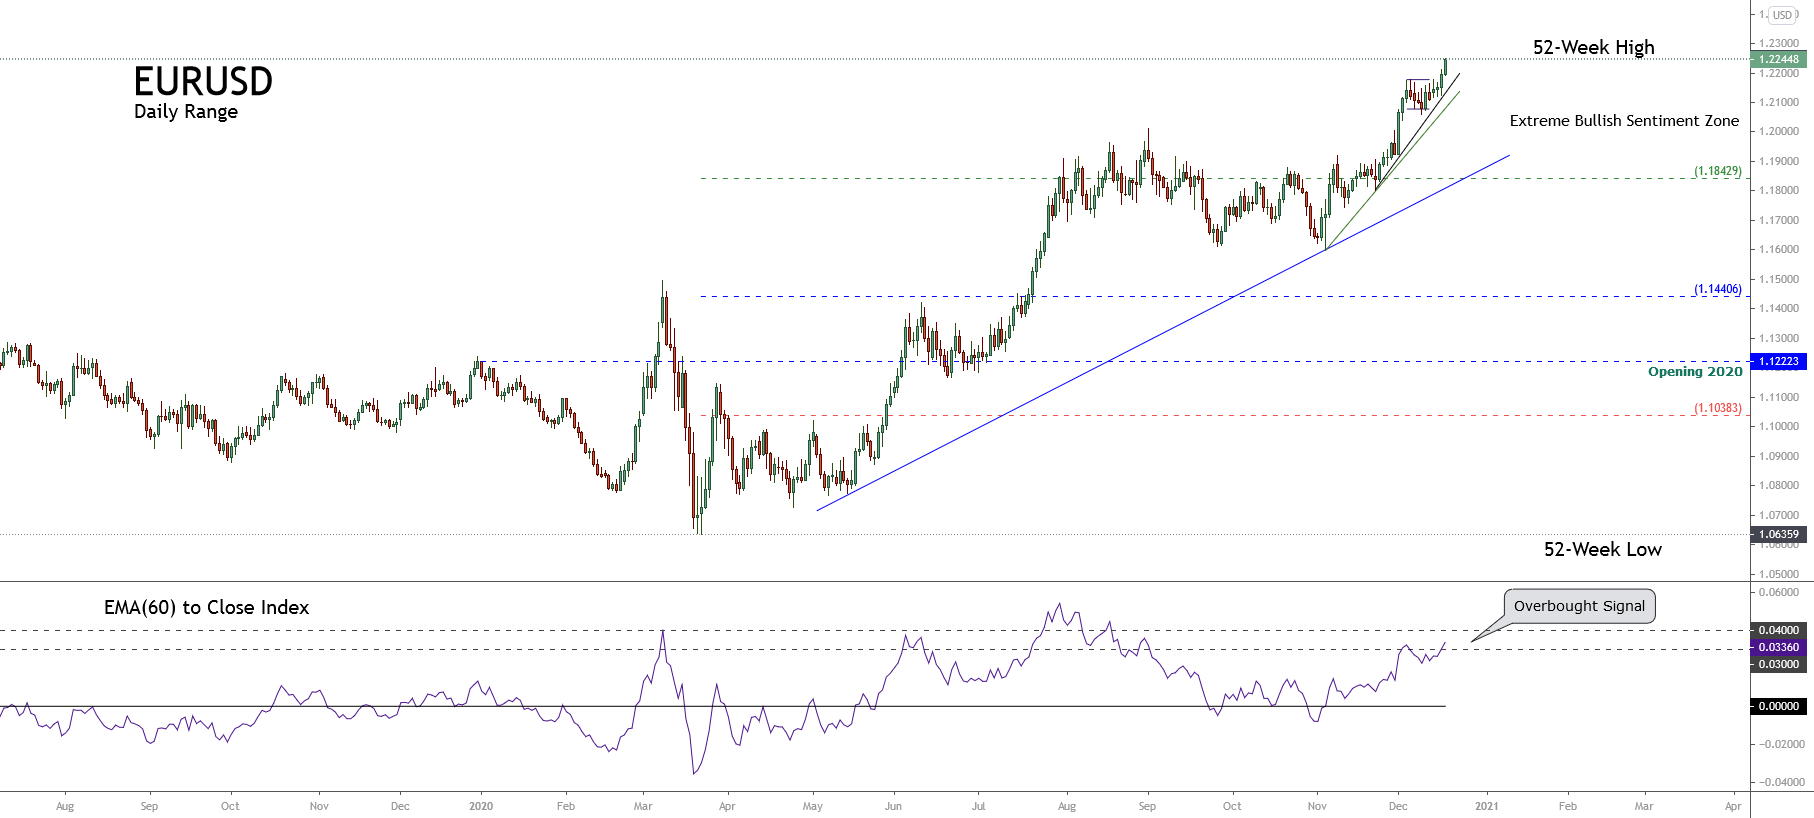
The long-term primary trend identified with the trend-line in blue reveals that bull traders remain the market control since last March 23rd when the price found and confirmed the bottom at 1.06359 after the massive sell-off occurred last mid-February. Moreover, both the secondary trend (green trend-line) and the minor trend (black trend-line) show the bullish acceleration that carries the cross from November 04th when the EURUSD found fresh buyers expecting further upsides. 

On the other hand, although the trend looks mostly bullish, the EMA(60) to close index is moving in its overbought zone; thus, we should be prepared fr the upward movement in progress to end soon. Under this context, the main bias for bulls should change from buy to hold. Also, Bearish traders should expect confirmation signals such as a significative breakdown before placing their short positions.

Technical Overview

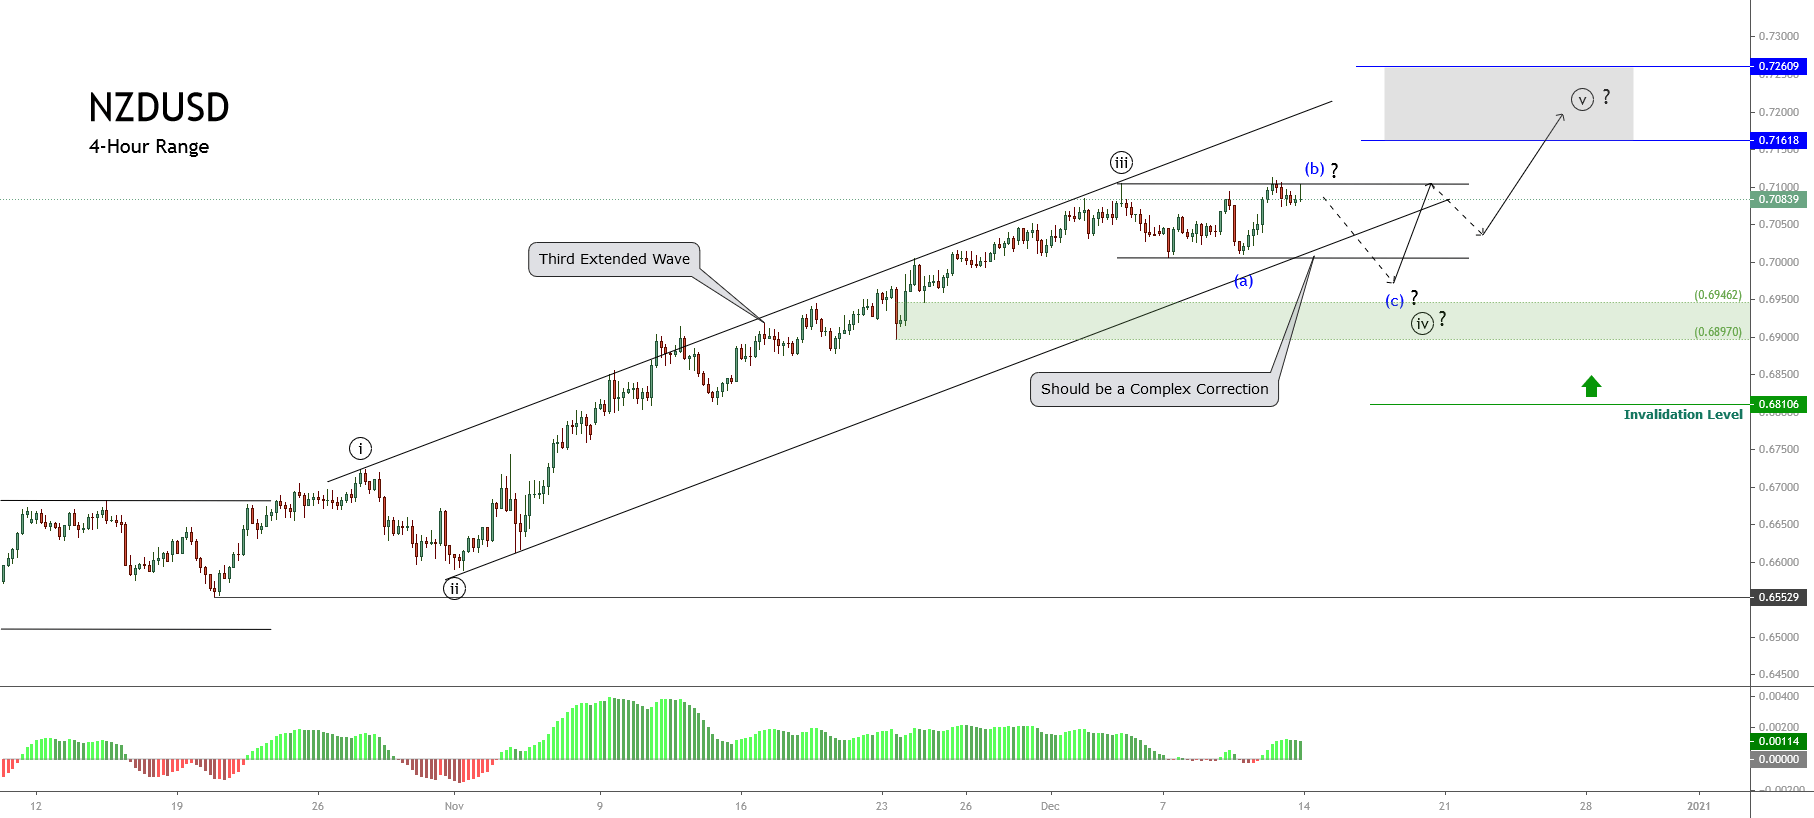
The mid-term Elliott wave view of the EURUSD pair exposed in the next 12-hour timeframe chart reveals the price action is reaching its second target level of $1.22575 proposed in our previous analysis. Also, the chart illustrates its progress in an incomplete wave 5 of Minor degree labeled in green.

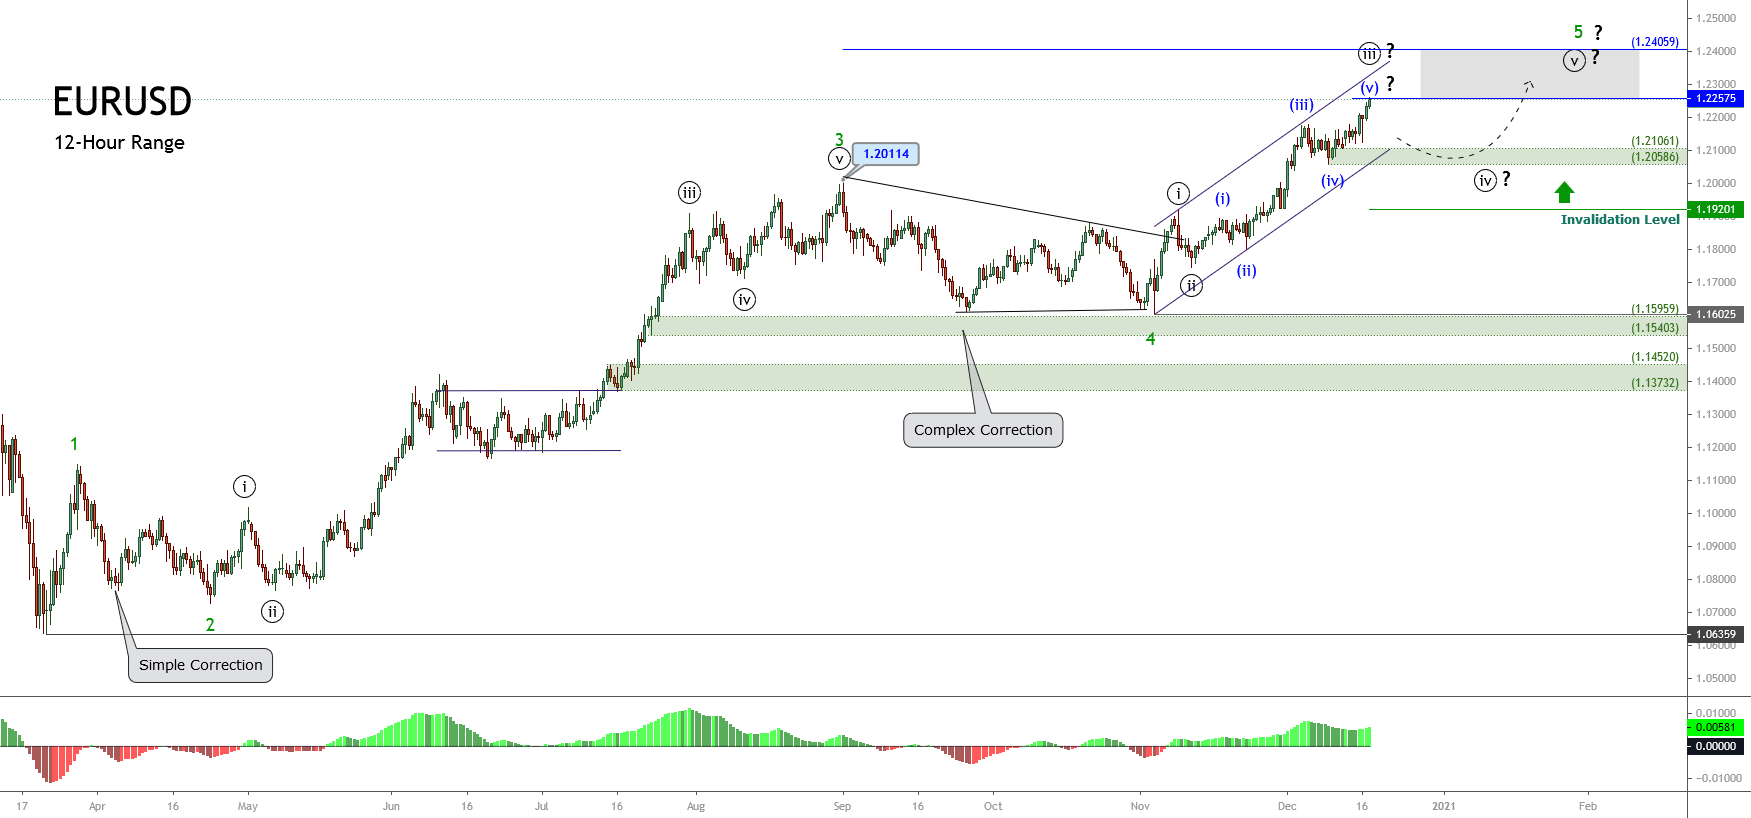
The lesser degree structure observed in the fifth wave in green shows the progression of the wave ((iii)) of Minute degree labeled in black, which simultaneously appears advancing in its internal fifth wave of Minuette degree identified in blue. The Elliott Wave textbook suggests that, currently, the common currency moves in an extended wave. In this context, once the pair completes its rally, it should start to consolidate in its wave ((iv)) in black. This corrective formation could find support in the demand zone between 1.21061 and 1.20586, which could bring the possibility to join the long-term bullish trend. The potential target for wave 5 in green is $1.2405.

In summary, the EURUSD pair moves in its third wave of Minute degree, which should complete its rally in the coming trading sessions. The next path corresponding to wave ((iv)) in black could drag the price until the demand zone between 1.21061 and 1.20586, where the common currency could start a new rally with a potential target at 1.2405. Finally, the invalidation level of the bullish scenario is $1.19201.

Categories
Forex Elliott Wave Forex Market Analysis

NZDUSD Could Reach a New Yearly High

The NZDUSD pair continues extending its gains, testing the psychological barrier of 0.71, helped by the US Dollar weakness. The Oceanic currency outperforms over 5.4% during the current year. Also, the pair advances over 27% since it confirmed its bottom on March 22nd at 0.55862.

Technical Overview

The big picture of the NZDUSD illustrated in the following 12-hour chart shows the primary upward trend, its trendline plotted in blue, intact since March 22nd when the price confirmed its bottom at 0.55862 and began the rally that remains in progress to date. Likewise, the secondary trend and its green trendline reveal the acceleration of the price testing by the third time the psychological barrier of 0.71.

Considering that the NZDUSD pair currently re-tests the 0.71 level, the price could extend its gains, reaching a new yearly high, to find resistance in the next psychological resistance of 0.72.

Short-term Technical Outlook

The short-term Elliott wave view for the NZDUSD pair unfolded by its 4-hour chart led us to observe an incomplete impulsive sequence of Minute degree labeled in black, which began on October 22nd price found fresh buyers at 0.65529.

The previous chart illustrates the impulsive structure that continues progressing and looks to develop its fourth wave of Minute degree labeled in black. Moreover, in the chart, we should remark that the third wave, which looks like the extended wave of the incomplete impulsive sequence identified in black, has found resistance at 0.71043 on December 03rd. 

Once the price topped the yearly high at 0.71043, the pair began to develop a sideways corrective formation, still progressing. In this regard, considering both the alternation principle stated by the Elliott Wave Theory and that wave ((ii)) in black looks like a simple corrective pattern, the current wave ((iv)) of the same degree should be complex in terms of price, time, or both.

In this scenario, the price action might retrace until the demand zone bounded between 0.69462 and 0.68970, where the Kiwi could find fresh buyers expecting to boost the pair toward a new yearly high. This high could strike the potential target zone between 0.71618 and 0.7260.

In summary, the short-term Elliott wave perspective for the NZDUSD pair reveals the advance in a bullish trend that currently moves mostly sideways in an incomplete corrective formation. The fourth wave in progress could find support in the demand zone bounded between 0.69462 and 0.68970. Likewise, fresh buyers could boost the price toward 0.71618 and extend its gains until 0.7260. Finally, the invalidation level of the current bullish scenario is located at 0.68106.

Categories
Forex Market Analysis Forex Technical Analysis

NZDJPY Fills the Gap Unfilled Since May 2019

The NZDJPY advanced 5.70% in November, consolidating the price in the extreme bullish sentiment zone. Likewise, as illustrated in the following daily chart, during December’s kickoff trading, the cross reached the yearly high of 73.831, filling the gap that opened on May 06th, 2019.

Technical Overview

The previous chart also exposes the cross advancing in a mid-term uptrend drawn in blue, which remains active since last March 18th, when the price found support at 59.490. Likewise, we distinguish an accelerated short-term bullish trend plotted in green, which began in early November. 

The 2.774 reading observed in the EMA(60) to Close Index leads us to suspect that the impulsive bull market developed in the NZDJPY cross seems to be in an exhaustion stage. Therefore, the cross is likely to develop a reversal movement in the following trading sessions.  

Nevertheless, before taking a position on the bearish side, the price action must confirm the reversal movement. 

Technical Outlook

The following 12-hour chart presents the mid-term Elliott Wave view or the NZDJPY cross. The drawings reveal the cross advancing in an incomplete fifth wave of Minuette degree, labeled in blue that belongs to the fifth wave of Minute degree, in black.

NZDJPY’s price movements reveal an impulsive five-wave sequence of Minute degree identified in black, which began last March 18th, when the cross found fresh sellers after the massive sell-off developed in the global stock market. 

Likewise, once the extended third wave (in black) ended, the cross developed a sideways movement as a flat pattern, which found fresh buyers at 68.633. In this context, considering the Elliott Wave theory and that wave ((iii)) was the extended wave, the next impulsive wave ((v)) (in black) can’t be extended and should look similar to wave ((i)), also in black. 

On the other hand, watching the fifth wave’s internal structure (in black), the wave (ii) (in blue) looks like a complex correction, and the third wave is the extended movement. In this context, the current wave (v) (in blue), which is still in development, shouldn’t be an extended rally.

Consequently, the cross could complete its fifth wave of Minute degree in the area defined by the psychological levels between 74.00 and 75.00. Finally, until the cross shows evidence of a reversal, such as a bearish engulfing candle, we should consider the cross’ trend as bullish.

Categories
Forex Elliott Wave Forex Market Analysis Forex Price Action Forex Technical Analysis

Is EURGBP Ready for a Fresh Rally?

In our latest EURGBP technical analysis, we commented on the cross moving in an incomplete sideways corrective formation of Minor degree, identified in green. Its internal structure suggested the completion of a double-three pattern of Minute degree.

Also, we saw the pierce and bounce of the September 03rd low at 0.8658, when EURGBP dropped to 0.88610, found fresh buyers there, and created an intraday impulsive move identified as the first wave of Minute degree, labeled in black.

As the next 4-hour chart shows, once the EURGBP cross completed its first wave, in black that belongs to wave C, in green, it reacted mostly bearish, developing a correction, extending the move below our forecasted area, and testing the lows of the previous bullish impulsive move.

The breakout of the short-term descending trendline confirmed the end of wave ((ii)) of Minute degree and the beginning of the third wave of the same degree, which remains in progress.

Likewise, in the last chart, we distinguish the advance of the third wave of Minuette degree identified in blue in its internal structure.

Short-term Technical Outlook

The short-term Elliott Wave view of the EURGBP cross, unveiled in the below 4-hour chart, reveals the breakout of the descending trendline that follows the wave ((ii)) identified in black, which suggests the beginning of a new rally.

Once the price found fresh buyers at 0.88998, the cross began to advance mostly bullish in an impulsive sequence of Minuette degree, identified in blue, that remains in progress. This upward move corresponds to the internal structural series of wave ((iii)) of Minute degree that belongs to wave C of Minor degree, in green.

Furthermore, considering the reduced period it took for the first stage of wave (iii) to complete, It is plausible that the third wave in progress will be the extended wave, as the Elliott Wave theory states that only one extended wave would occur in an impulsive structure. 

In this context, the current upward move could advance to the next supply zone between 0.90446 until 0.90686. But, if the cross maintains its bullish momentum, it could strike the next potential target zone between 0.91260 and 0.91464.

Finally, the current bullish scenario’s invalidation level is 0.88610, which corresponds to the origin of the wave C in green.


Categories
Forex Market Analysis

Australian Dollar Prepares for Interest Rate Decision and Retail Sales Data Ahead

Overview

The Australian Dollar will face two high volatility events; the first one corresponds to the interest rate decision, for which the analysts’ consensus foresees a rate cut to 0.1% from the current 0.25%. The second one corresponds to September’s Retail Sales figures, where the consensus expects a recovery. Nevertheless, the price action suggests a new decline before reversing.

Market Sentiment

From a fundamental perspective, the Australian Dollar will have two high volatility events that will drive the next week’s oceanic currency movements.

The first event corresponds to the Interest Rate Decision, which will occur on Monday the 2nd during the overnight session. The analysts’ consensus foresees a reduction from the current rate of 0.25% to 0.10%. 

The last interest rate cut by the Reserve Bank of Australia’s broad members occurred in March 2020, where policymakers decided to cut the reference rate from 0.5% to 0.25%.

The second high impact will occur in the overnight trading session of Tuesday 03rd, where the Australian Bureau of Statistics will release the Retail Sales (MoM) data corresponding to September. The analysts’ consensus foresees a decline to 1.5%. 

Although the analysts’ polled foresee a contraction for September, they expect an improvement in the retail sector after falling 4% in August.

On the market sentiment side, the GBPAUD cross in its daily chart exposes the 90-day high and low range, which reveals the short-term participants’ sentiment. 

The previous chart illustrates the price action moving in an upward sequence that began on September 11th that pushed the cross from the extreme bearish sentiment zone toward the extreme bullish sentiment zone. 

In fact, the 60-day moving average movement below the price confirms the bullish bias that carries the cross. The next supports locates at 1.82688, which corresponds to the extreme bullish sentiment zone support, and 1.81227 corresponds to the 60-day moving average that acts as a dynamic support.

In summary, considering the pessimistic forecasts by the Australian data analysts and the extreme bullish sentiment unveiled in the GBPAUD cross, there exist the possibility of further weakness in the oceanic currency.

Technical Analysis Outlook

The big picture of the GBPAUD cross under the Dow Theory exposed in its 2-week log-scale chart reveals the price is moving mostly sideways since early March 2013, when the price touched its bottom of 1.43811. Once the cross found buyers, the price raised until 2.23722 reached in mid-August 2015. 

Once the March 2015 high was reached, the pair started to correct the Primary trend finding support at 1.57896 in late October 2016. This correction accomplishes the Dow Theory rule that says that the Secondary trend retraces between 33% to 66% of the Primary trend. 

The same situation occurs with the ascending sequence that advances from 1.57896 toward 2.08522 reached in mid-March 2020, which retraces beyond 66% of the previous decline. 

Likewise, the GBPAUD cross started to develop a downward sequence, which found a bottom at 66% of the previous rally. Nevertheless, considering the price and time relationship between the last decline and the previous two movements, we conclude that this decline corresponds to the Minor trend of the Secondary upward trend, which looks incomplete. 

The GBPAUD outlook under the Elliott Wave Theory exposes the progress in a downward five-wave sequence, which advances in its incomplete wave 4 of Minor degree labeled in green. This corrective structural series currently moves in its wave ((a)) of Minute degree identified in black.

Considering the elliott Wave theory, the current wave in progress should develop three internal segments and advance until the zone between 1.86783 to 1.90442, where the cross could find resistance and start its wave ((b)) in black.

Likewise, considering that the third wave of Minor degree is the extended wave, the fifth wave should fail to reach a lower low than the end of the third wave of Minor degree located at 1.74935. Finally, the invalidation level of the bearish scenario is located above 1.95100.

Categories
Forex Market Analysis

DAX 30 Unveils Exhaustion Signals

Overview

The German DAX 30 index, which groups together the 30 most capitalized companies in Germany, shows signs of exhaustion after the rally it developed since the second half of March this year. Likewise, the Elliott wave theory’s perspective reflects the exhaustion of the bullish impulsive movement, which may be advancing in the last impulsive wave of Primary degree.

Market Sentiment Overview

The German benchmark DAX 30 shows a pause in its upward trend, consolidating the rebound that the price has been developing since March 19th when the German index found support in the yearly low located at 7,957.6 pts. Since this bottom zone, DAX 30 has advanced over 60% to date; however, this year the benchmark eases over 2.75% (YTD).

The following daily chart of the German index shows the price action running in the zone of extreme bullish sentiment. However, the shift in price below the 60-day weighted moving average reveals that it could be starting to develop a new short-term corrective process. 

Although the DAX 30 remains in the zone of extreme bullish sentiment, our market bias continues being neutral as long as the likely corrective movement is not confirmed.

Elliott Wave Outlook

The DAX 30 index overview shows a bullish impulsive sequence that looks incomplete. This five-wave structural series that began in early March 2009 currently moves in a consolidation phase, showing exhaustion signals.

In its log-scale weekly chart, the DAX 30 reveals the price moving in a possible fifth bullish wave of Primary degree identified in black. At the same time, we note that the German benchmark had developed a third wave extended of Primary degree.

According to Elliott wave theory, in an impulsive structure, there can only be one extended wave. In this context, and based on the price development formed by DAX 30, we can recognize the movement of five internal impulsive waves of Intermediate degree labeled in blue within the third wave of Primary degree. This bullish movement ended in the second half of January 2018 when DAX climbed until 13,602 pts.

On the other hand, the alternation principle between corrective waves is recognized to happen between the second and fourth waves. While the second wave performed a corrective movement that took 133 days, the fourth wave was developed in 784 days.

As for the fifth wave’s potential completion, there is still no evidence to confirm this completion. On the one hand, according to Elliott wave theory, when in an impulsive sequence, the third wave is extended, it is highly likely that the fifth wave will fail in its attempt to reach new peaks.

On the other hand, we recognize that there is no confirmation of the fulfillment of the criterion of similarity in price, time, or both between the first and fifth wave. In other words, while the first wave advanced 4,024 pts in just over two years, the fifth wave, which started in the second half of March 2020,  has grown about 5,500 pts in barely six months.

To conclude, the overall market sentiment seems to have shifted from the extreme bullish to neutral. Furthermore, the market structure shows the progress fifth wave of Primary degree progress, giving exhaustion signals. Thus, our bias for the German DAX 30 index continues being neutral.