The EURUSD pair continues extending its gains after surpass its psychological resistance of $1.22 for the first time since late April 2018. The common currency gained over 9.20% (YTD), encouraged by the US Dollar weakness.
Technical Overview
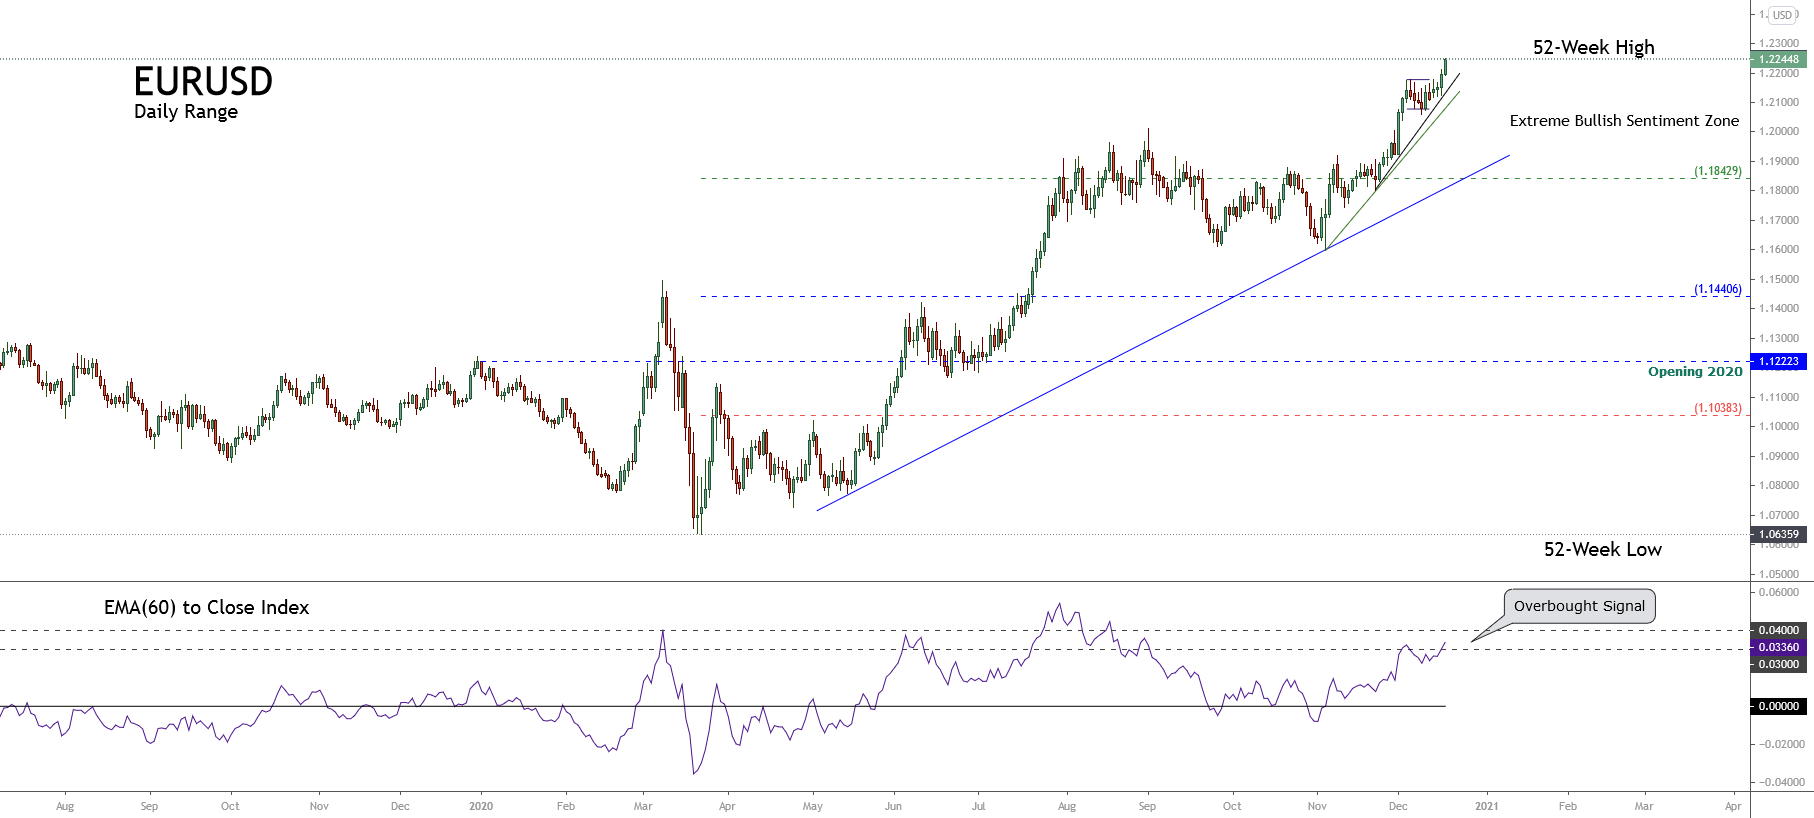
The following daily chart illustrates the long-term market participants’ sentiment unfolded within the 52-week high and low range. The figure shows the progression starting from 1.06359, which corresponds to the lowest level of the year.
The long-term primary trend identified with the trend-line in blue reveals that bull traders remain the market control since last March 23rd when the price found and confirmed the bottom at 1.06359 after the massive sell-off occurred last mid-February. Moreover, both the secondary trend (green trend-line) and the minor trend (black trend-line) show the bullish acceleration that carries the cross from November 04th when the EURUSD found fresh buyers expecting further upsides.
On the other hand, although the trend looks mostly bullish, the EMA(60) to close index is moving in its overbought zone; thus, we should be prepared fr the upward movement in progress to end soon. Under this context, the main bias for bulls should change from buy to hold. Also, Bearish traders should expect confirmation signals such as a significative breakdown before placing their short positions.
Technical Overview
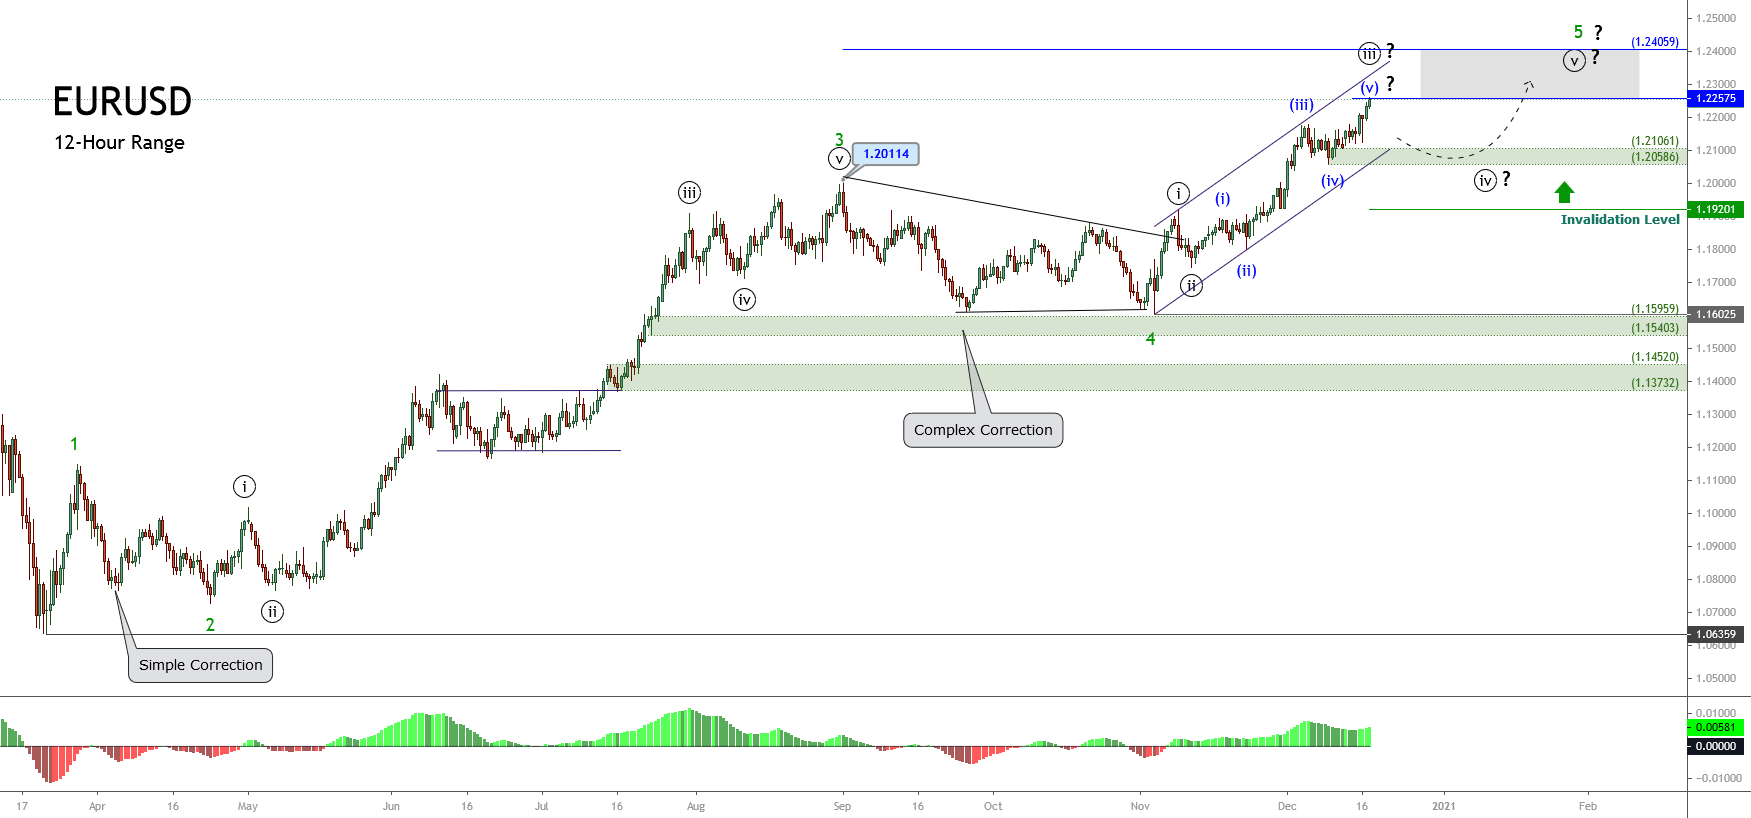
The mid-term Elliott wave view of the EURUSD pair exposed in the next 12-hour timeframe chart reveals the price action is reaching its second target level of $1.22575 proposed in our previous analysis. Also, the chart illustrates its progress in an incomplete wave 5 of Minor degree labeled in green.
The lesser degree structure observed in the fifth wave in green shows the progression of the wave ((iii)) of Minute degree labeled in black, which simultaneously appears advancing in its internal fifth wave of Minuette degree identified in blue. The Elliott Wave textbook suggests that, currently, the common currency moves in an extended wave. In this context, once the pair completes its rally, it should start to consolidate in its wave ((iv)) in black. This corrective formation could find support in the demand zone between 1.21061 and 1.20586, which could bring the possibility to join the long-term bullish trend. The potential target for wave 5 in green is $1.2405.
In summary, the EURUSD pair moves in its third wave of Minute degree, which should complete its rally in the coming trading sessions. The next path corresponding to wave ((iv)) in black could drag the price until the demand zone between 1.21061 and 1.20586, where the common currency could start a new rally with a potential target at 1.2405. Finally, the invalidation level of the bullish scenario is $1.19201.


