
Overview
The AUDNZD cross remains moving mostly bearish in the bullish sentiment zone. It alters the price surpassing the 1.10 psychological barrier and begins a corrective sequence that remains in progress; however, this downward movement could end soon.
Market Sentiment
The AUDNZD moves mostly downward in the bullish sentiment zone, piercing July’s low area at 1.056. The Oceanic Cross advances over 1.5% (YTD).
The following figure exposes the AUDNZD cross in its daily timeframe. The chart reveals the long-term market participants’ sentiment bounded by its 52-week high and low range. The price action began a downward sequence; after that, the cross surpassed its last 52-week high of June 02nd, located on 1.08807 in a rally that elapsed six sessions in a row.
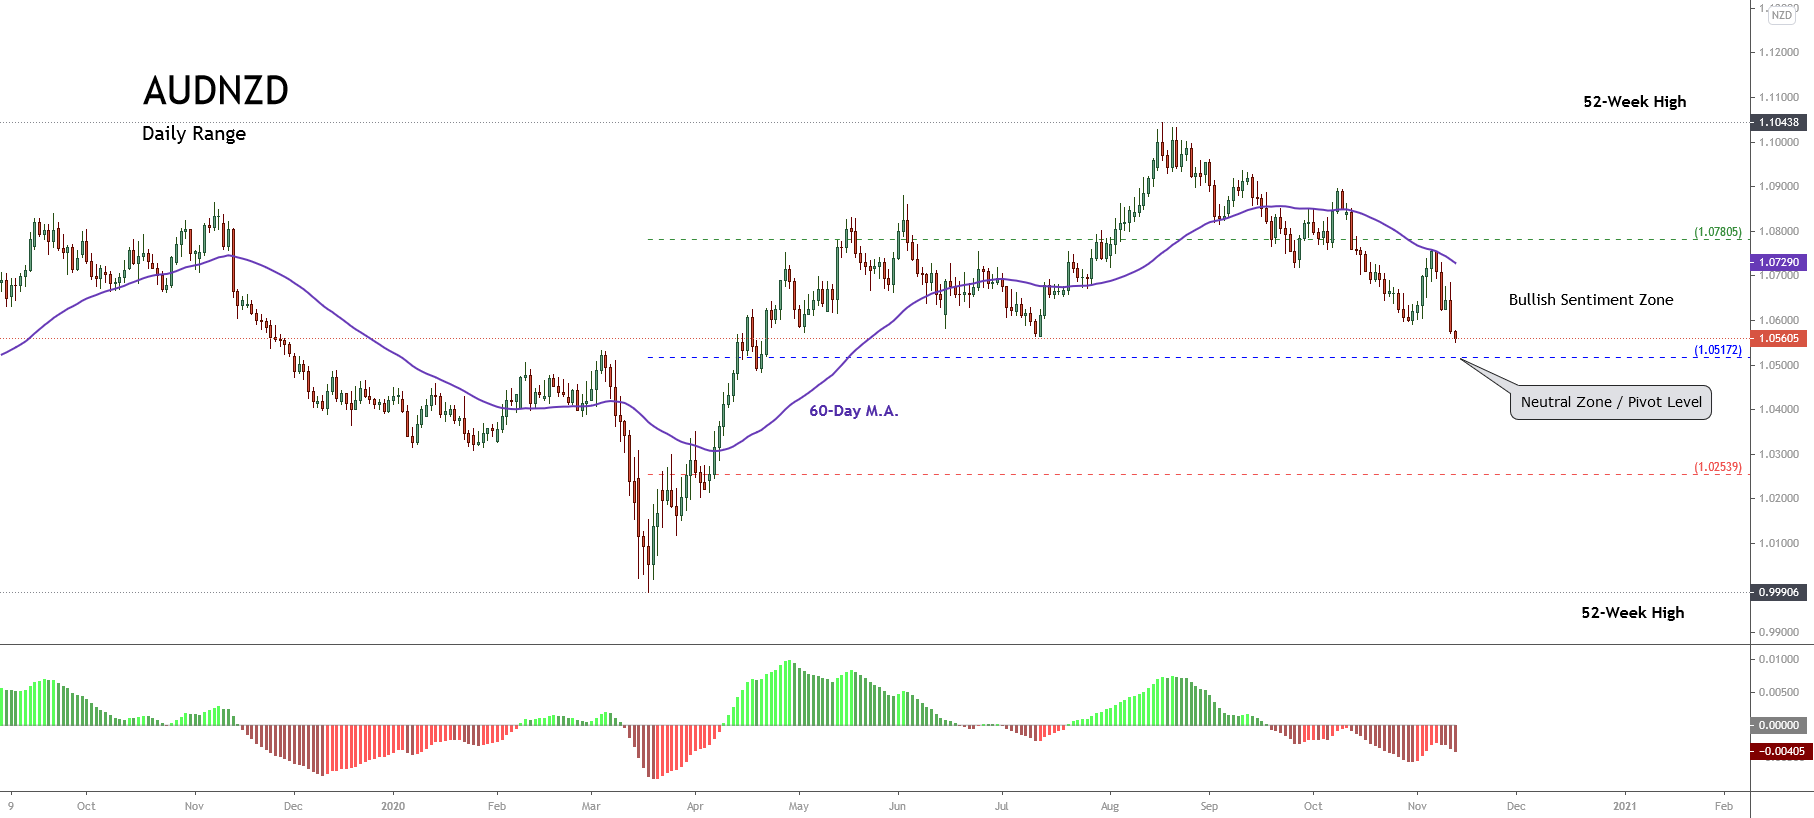
Moreover, the 60-day weighted moving average confirms the downward short-term bearish bias that favors the price action. Nevertheless, considering that the cross moves in the bullish sentiment zone, the AUDNZD cross’s decline could be a correction of the upward cycle that began last mid-March.
Technical Overview
The AUDNZD cross under the Dow Theory perspective reveals that the price has started to develop a bullish primary trend that began on March 18th when the price found fresh buyers at 0.99906.
The following chart illustrates AUDNZD in its daily timeframe. The figure exposes the demand incorporation below the parity, which carried up the price until 1.10438, from where the price started to decline in a secondary trend.
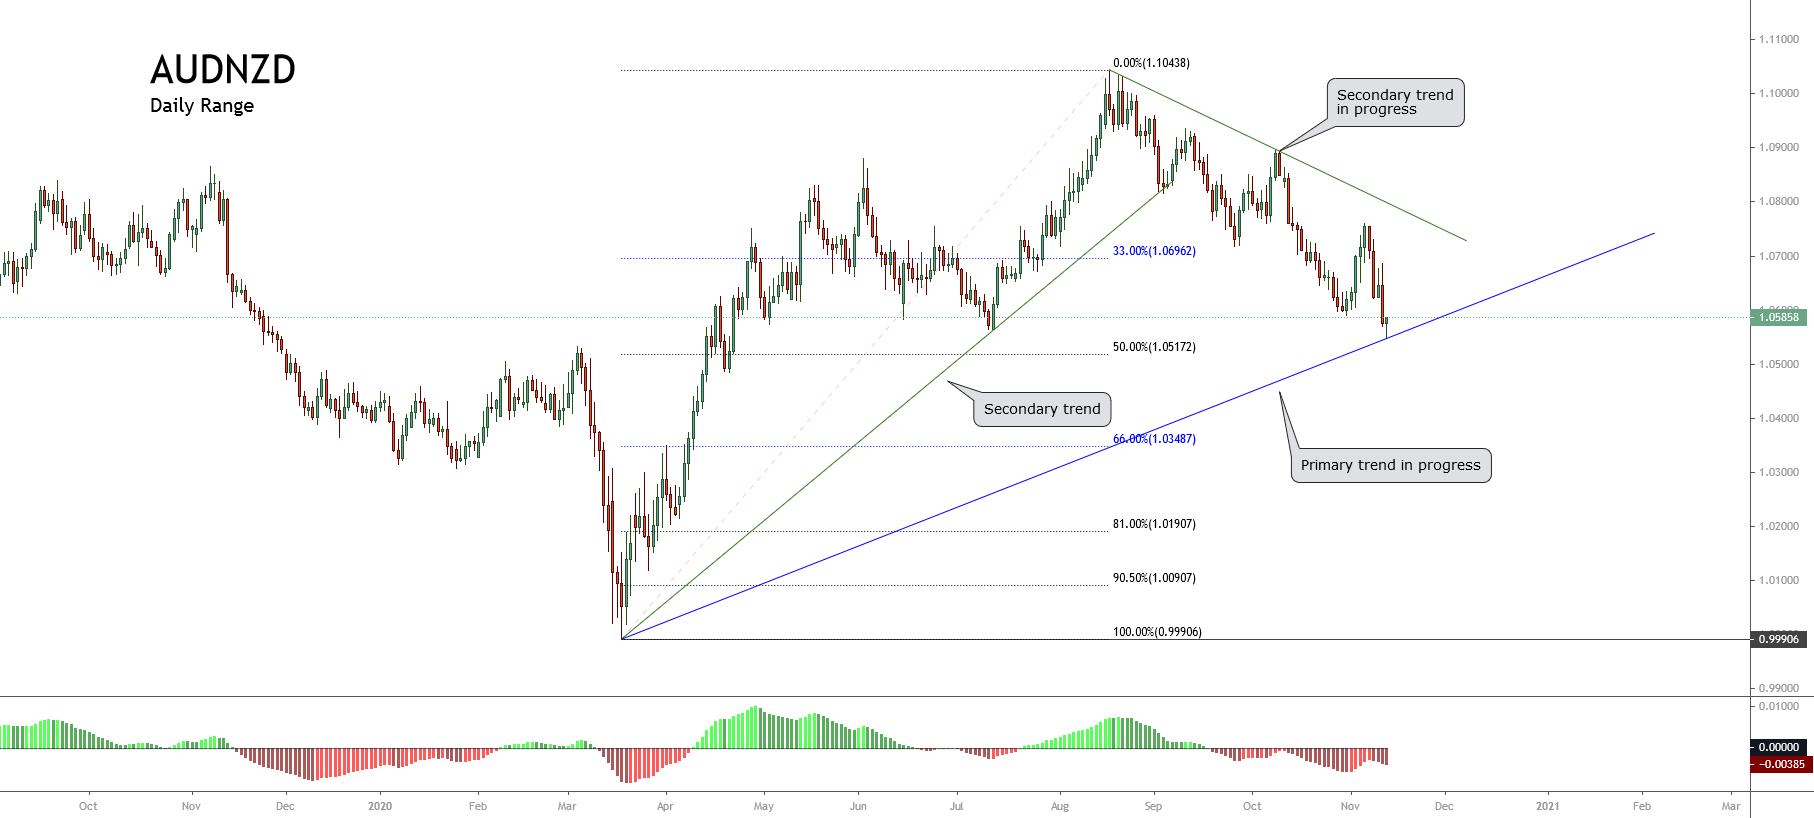
The retracement developed by the Oceanic cross beyond the 33% leads us to confirm that the latest decline in progress corresponds to the rally’s corrective movement that began on March 18th.
The mid-term Elliott wave view of the AUDNZD cross illustrates in its 12-hour chart the downward move in a complex corrective structure that looks like an incomplete double-three pattern (3-3-3).
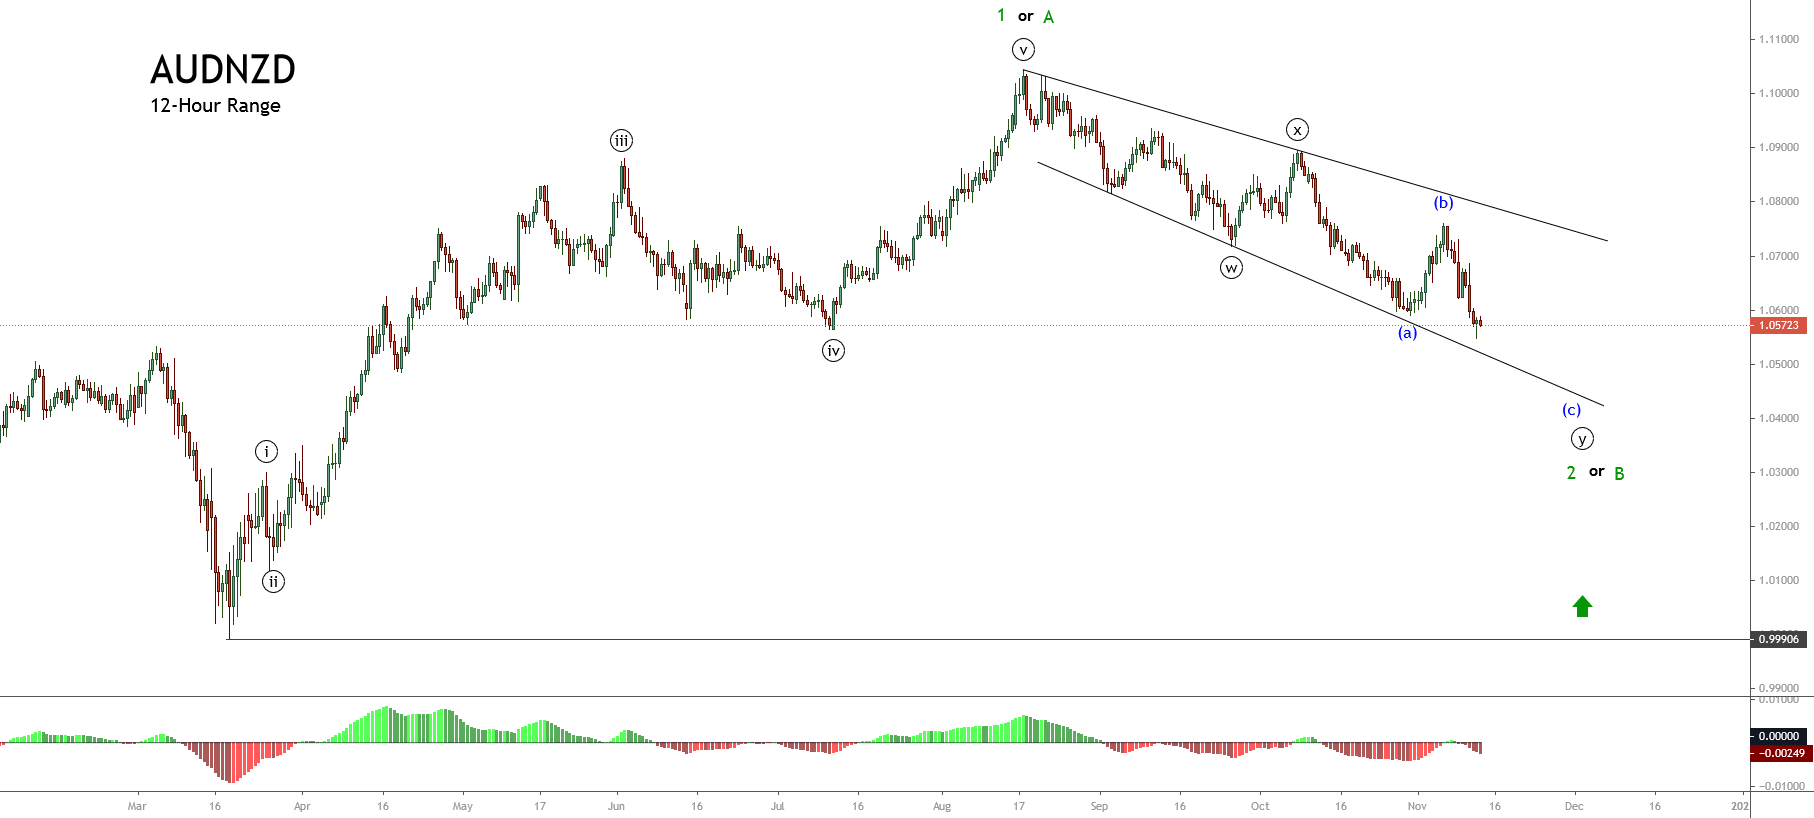
The previous chart reveals the price action is moving in its wave (c) of Minuette degree labeled in blue, which belongs to wave ((y)) of Minute degree in black. Likewise, this entire move corresponds to wave 2 or B, which retraces the upward five-wave sequence that began on March 18th at 0.99906.
Technical Outlook
Once the AUDNZD found sellers at 1.07565, the Oceanic cross began its wave (c) of Minuette degree labeled in green that remains in progress.
As illustrated in the following 8-hour chart, the price could extend its declines to the area between 1.05186 and 1.04870, where the price could find support. Likewise, if the price extends its drops below 1.03511, the next movement’s strength could be limited to a re-test of the August 18th high located on 1.103.
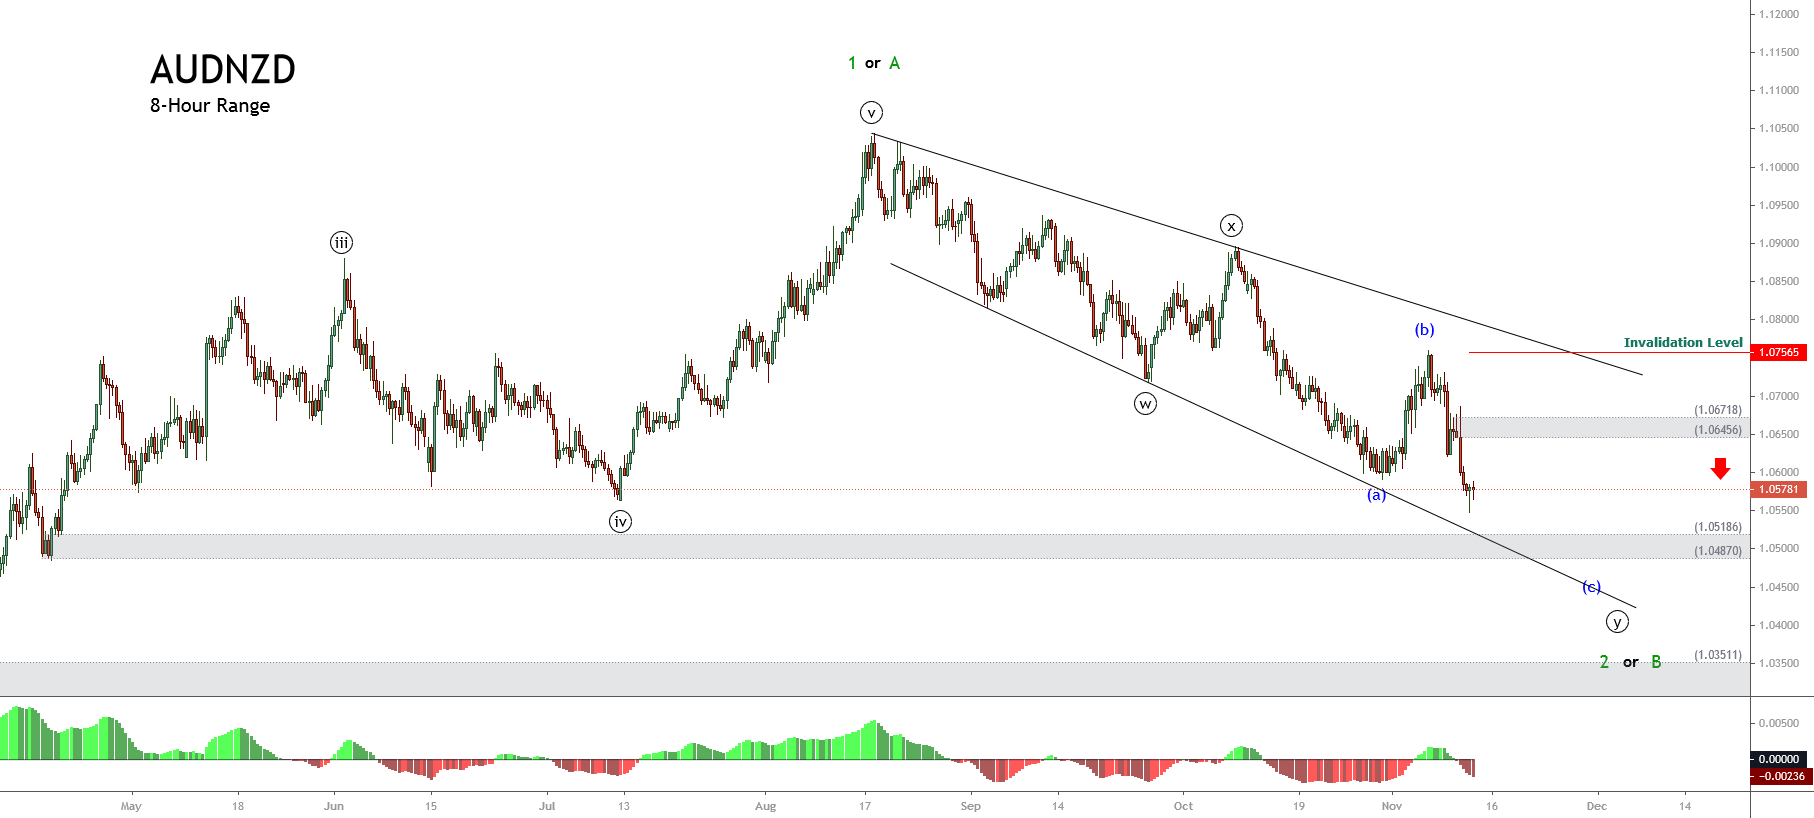
On the other hand, if the price action breaks and closes above the supply zone between 1.06456 and 1.06718, there exists the possibility of a new rally. This new bullish leg could surpass the 1.103 mark.
Finally, the invalidation level for the short-term bearish scenario is located at 1.07565.