
The USDCAD pair reveals a strong bearish movement that seems have found a short-term bottom. In this regard, the price could start a rally that could boost the price toward October’s highs zone.

Market Sentiment
The USDCAD pair continues moving in its extreme bearish sentiment zone, erasing the gains reached during the first quarter of the year when the price advanced over 13%. Currently, the Loonie gains a modest 0.67% YTD.
The next figure illustrates the USDCAD pair in its daily timeframe. The chart exposes the long-term market participants sentiment bounded by the 52-week high and low range.
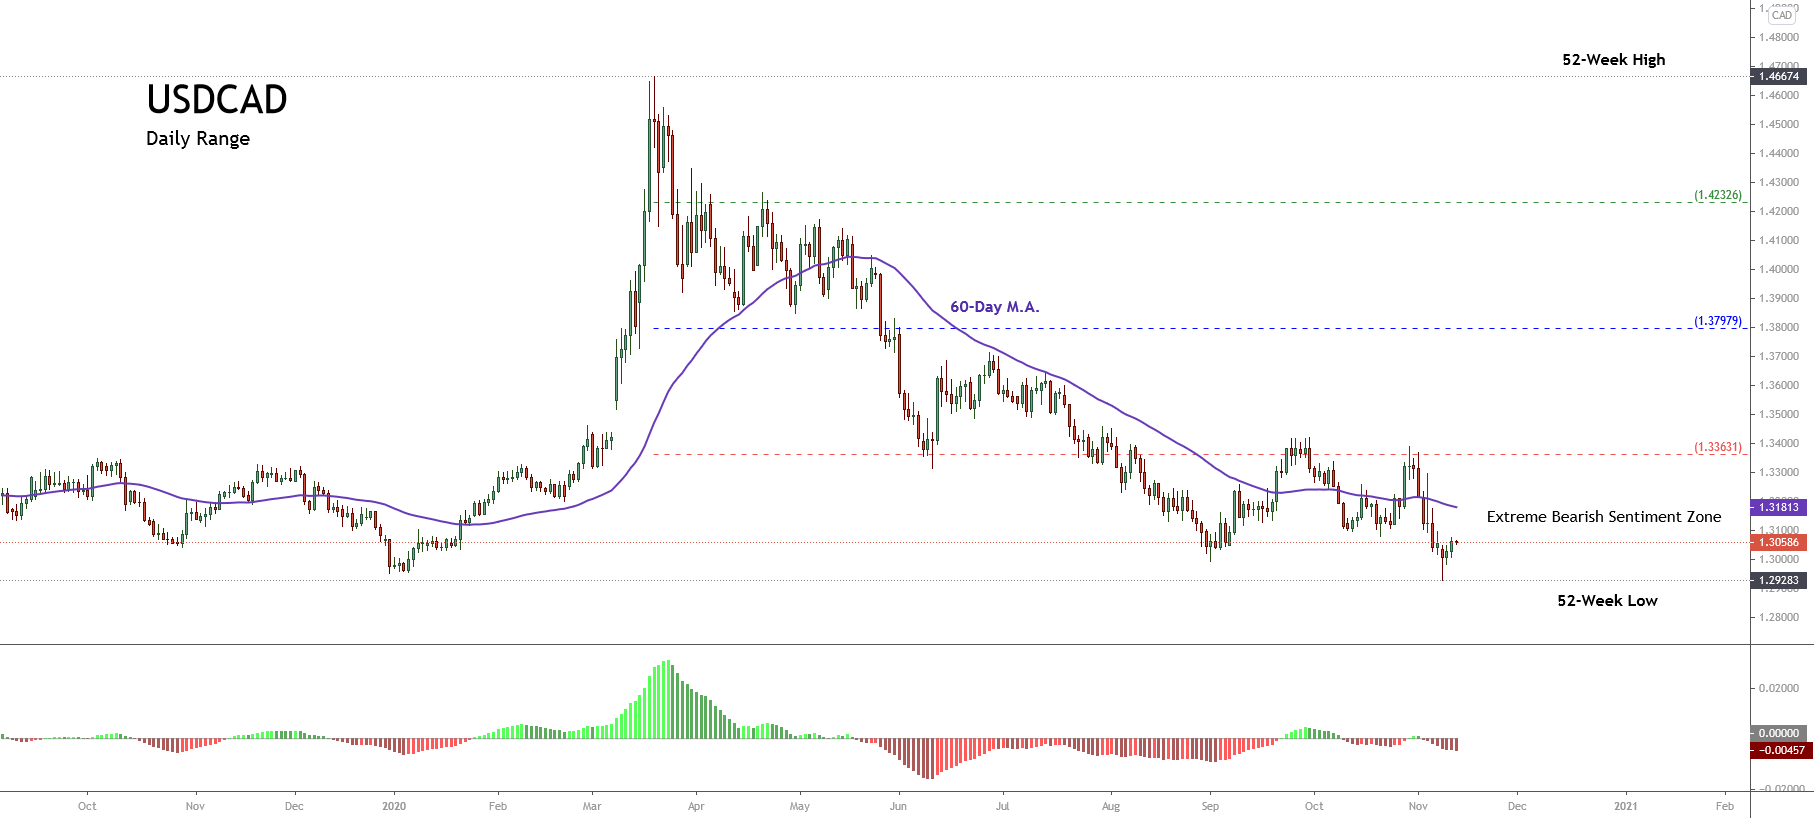
The chart reveals the price action continues developing fresh lower lows, which leads us to observe that market participants continue holding bearish positions on the pair. Furthermore, the 60-day weighted moving average continues above the price, which confirms the bearish bias that advances the price.
On the other hand, as long as the USDCAD price remains below 1.33631, the Loonie will stay under bearish pressure.
Technical Overview
The USDCAD pair exposes a bearish reversal formation that erased the progress developed during the first quarter of the year. The following weekly chart reveals a powerful bearish long-tailed candle in terms of a yearly candlestick, suggesting that the price would continue developing more declines in the long-term.
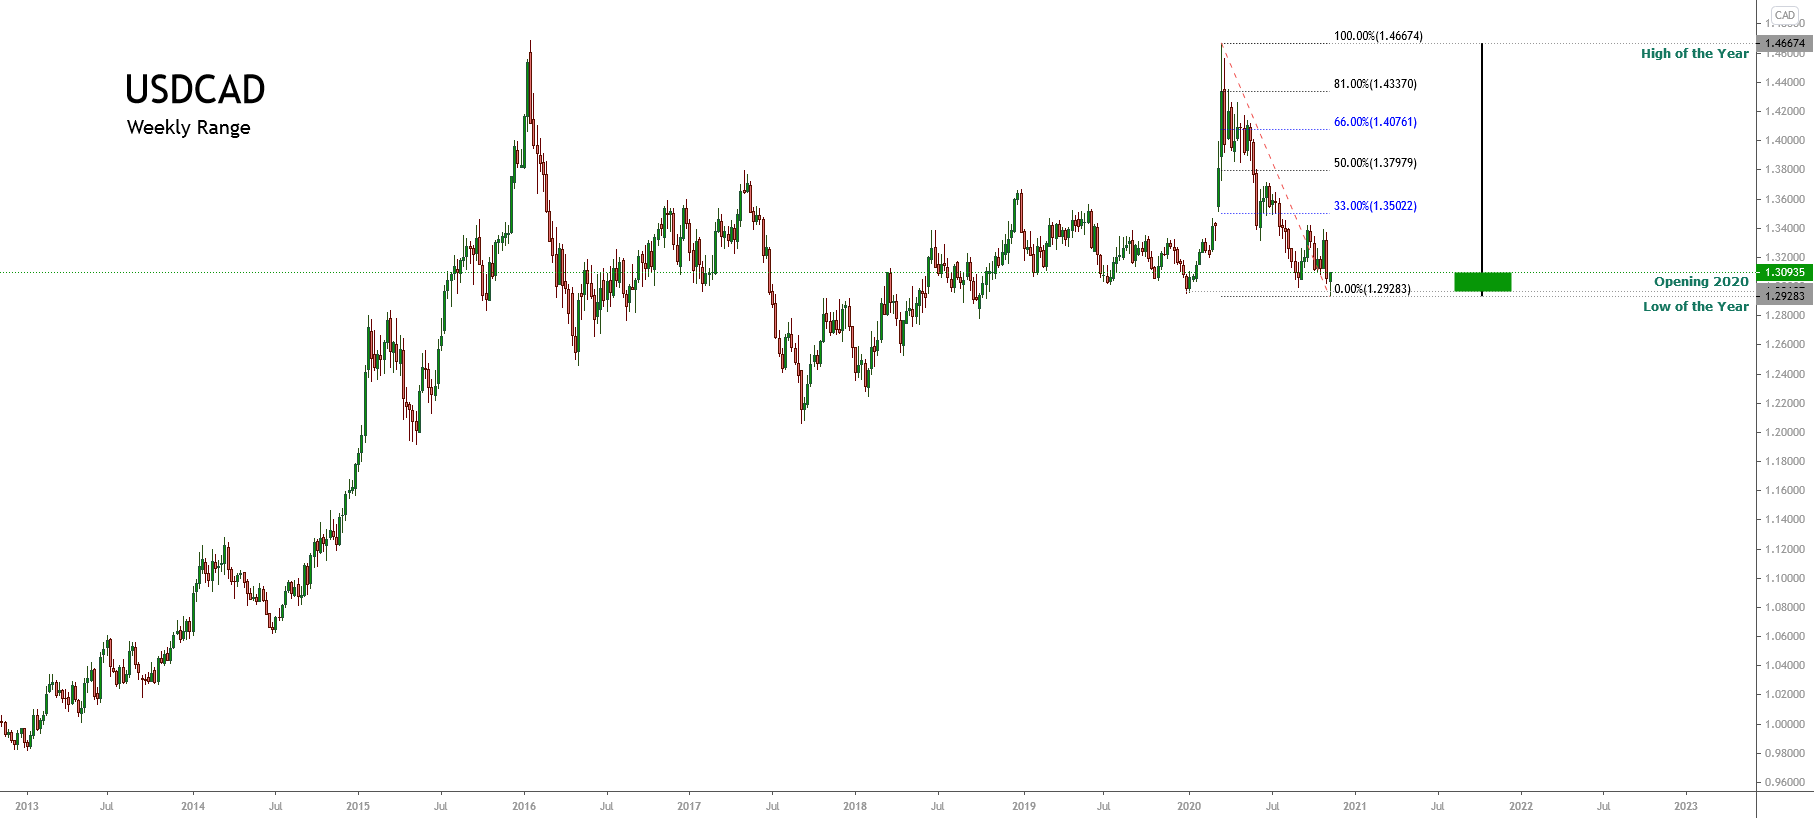
On the other hand, the big picture exposes a long-term sideways formation that persists since mid-2015. Likewise, the last downward movement that began at 1.46674 appears to have found a bottom on 1.29238 the current trading week.
In this regard, if the price starts to develop a corrective rally, according to the Dow Theory, the USDCAD pair should advance to 1.35022 and up to 1.40761; this upward sequence would correspond to a valid correction of the same degree that the last bearish move developed by the pair since last mid-March.
The mid-term Elliott wave view of USDCAD illustrated in the next 12-hour chart reveals an incomplete corrective sequence that looks like a double three pattern (3-3-3) of Minor degree labeled, in green, which began on March 18th at 1.46674.
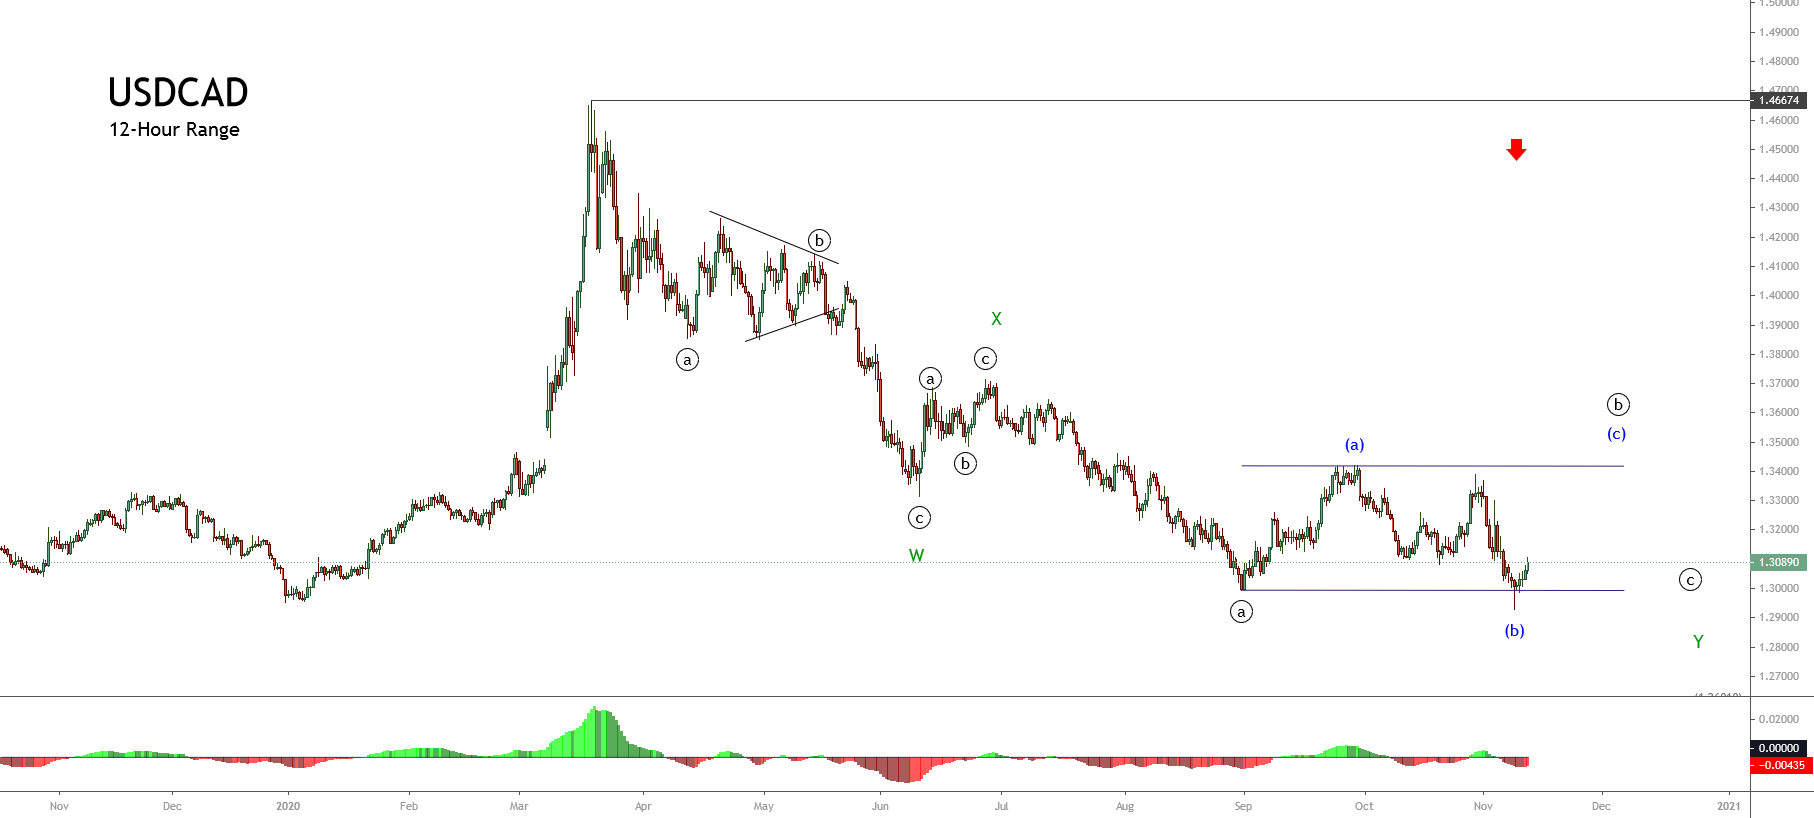
Currently, the USDCAD develops its wave ((b)) of Minute degree identified in black, which belongs to wave Y in green. In this context, the wave ((b)) looks like an incomplete flat pattern (3-3-5), which subdivides into a 3-3-5 sequence. Moreover, the actual structural series suggests that the Loonie started to develop its wave (c) of the Minuette degree labeled in blue.
Short-term Technical Outlook
The short-term Elliott wave view of the USDCAD unfolded in the following 8-hour chart, anticipates its progress in an incomplete flat pattern, which could be starting to advance on its wave (c) of Minuette degree labeled in blue.

If the Loonie find fresh buyers in a retracement to the demand zone between 1.30433 and 1.30086, and the price breaks and closes above 1.31473, then the price could confirm the potential rally that corresponds to wave (c) of Minute degree with a potential target in the supply zone between 1.33970 and 1.34592.
Lastly, the invalidation level for the intraday bullish scenario locates at 1.29283