Most traders use a horizontal line on their trading chart to mark support/resistance levels. Support and Resistance lines are the most basic trading tools, which traders use to make a trading decision. However, traders often find that the price does not react right at the drawn level. It is because of candles’ wicks and candles’ bodies. We may see that sometimes the price reacts at the level where the candles’ bodies are, and sometimes the price reacts where the wicks are. Thus, it is a good practice that we mark the support/resistance zone instead of marking the level only.

Let us demonstrate an example of that.
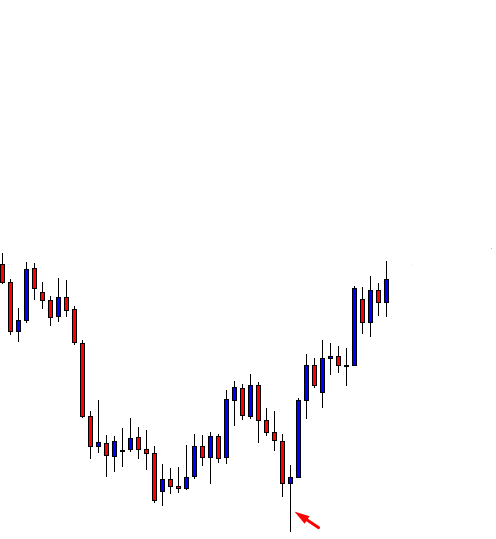
The price is being bullish after producing a Pin Bar. We know that a bullish Pin Bar has a long lower shadow. This means it reacts from a zone not only from a particular horizontal line.
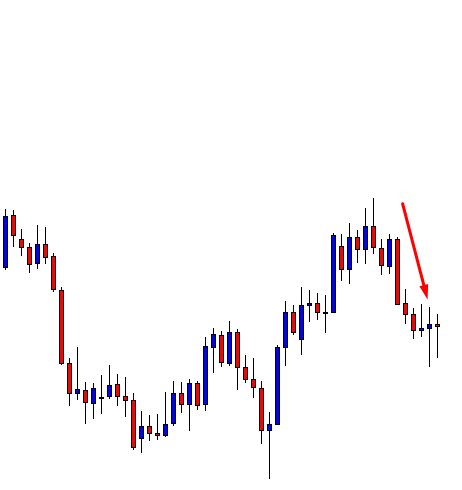
The price is on the correction. Look at those Spinning Tops with long upper and lower wicks. Do you notice that one of the flipped support holds the bodies of the candles? However, those shadows often play an essential role, especially when the price is to confirm a breakout. We will reveal that soon.
The flipped support does not hold the price at last. The price comes towards the South further to find its support. The last bullish candle suggests it finds one strong support for sure. Do you notice that this is where the price has bounced earlier and produced spikes?
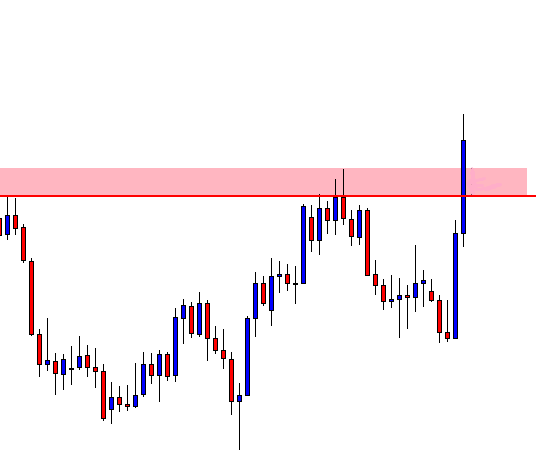
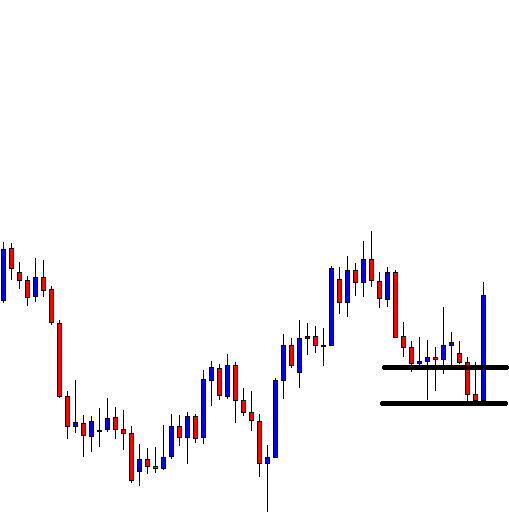
This time we have marked out the resistance zone. A bullish candle breaches the zone. The buyers need to wait for consolidation. The question is which level to hold the price as the level of support. Is it the level where the wicks are or where the bodies close or both?
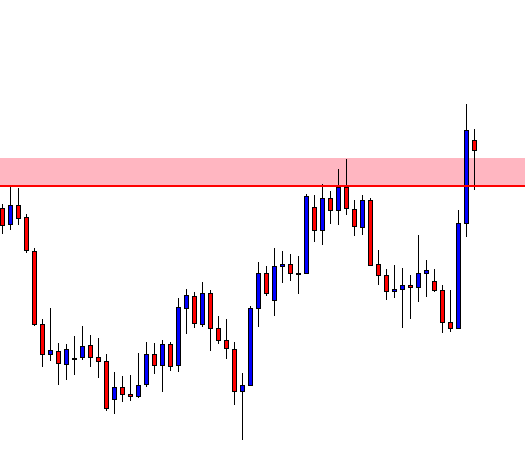
Both levels hold the price as support. On this chart, the level, which is drawn on the wicks, holds the price as the support. On its smaller time frames, the level that is drawn on candles’ bodies holds the price as support. If we draw just one level here, we may get confused. Thus, we must mark out the support/resistance zone. Since the buyers are waiting for a bullish reversal candle to go long, it may be produced where the price is now. The price may as well come down at the lower level of the support zone and create a buy signal. Both are valid signals. Let us find out where the signal is produced.
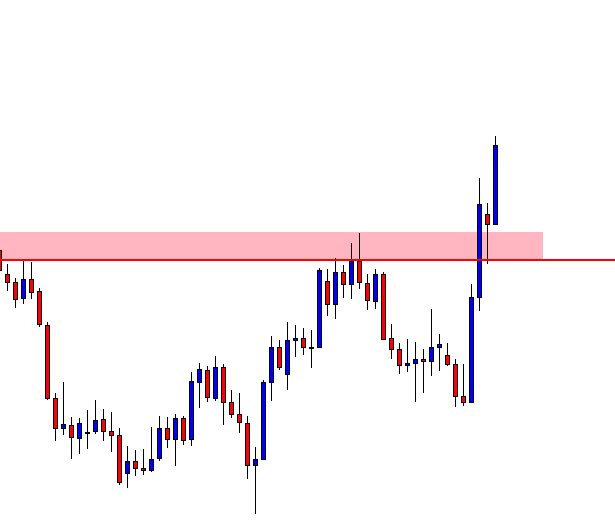
The buyers may want to trigger a long entry right after the last candle closes. Assume only the red line was drawn here. Some buyers would have been confused that the signal did not come from the right level. Thus, drawing the support/resistance zone comes out handy for the traders. Support/Resistance zone helps traders take a better trading decision.