The Double Bottom is a pattern, where the buyers eagerly wait to get a bullish reversal candle at. Typically, a Bullish Engulfing Candle, a Bullish Pin Bar, a Bullish Truck Rail are considered the strongest bullish reversal candle pattern. Usually, a Bullish Inside Bar and an Inverted Hammer are the weakest reversal pattern. In today’s lesson, we demonstrate an example of how a Daily Inverted Hammer candle offers a long entry.

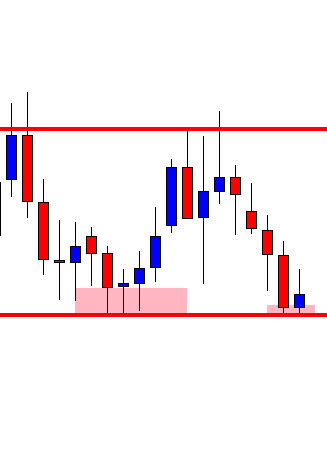
This is the daily chart. It shows that the price has been roaming around within two horizontal levels. It is at the support and produces an Inverted Hammer. An Inverted Hammer is a bullish reversal candle but not a very strong one. Look at the upper shadow. It suggests that the price has a strong rejection at a level of resistance.
To some extent, it signifies intraday buyers’ less confidence. However, it is the daily chart, and the bullish reversal candle forms right at a double bottom’s support. Thus, let us flip over to the H4 chart to find out whether it offers us an entry.
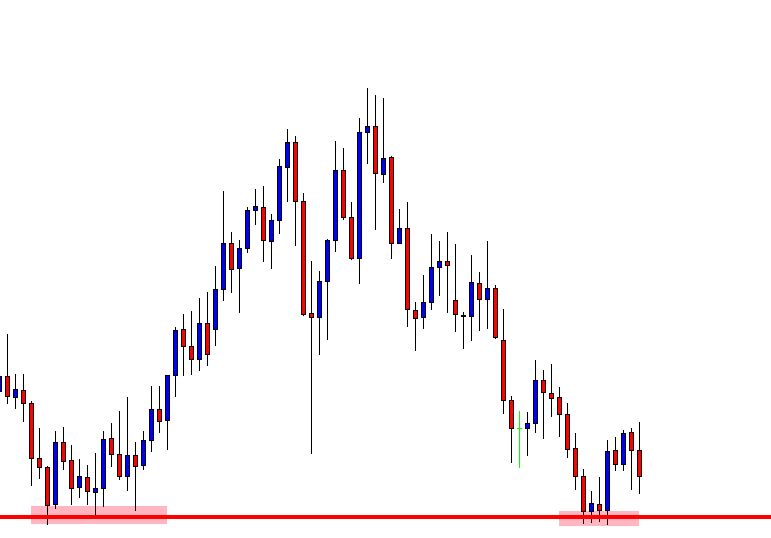
The H4 chart shows that the price is on consolidation. The last candle looks ominous for the buyers. Nevertheless, traders on this chart combination are to look for long opportunities as long as the support holds the price. Let us go to the next chart to find out what happens.
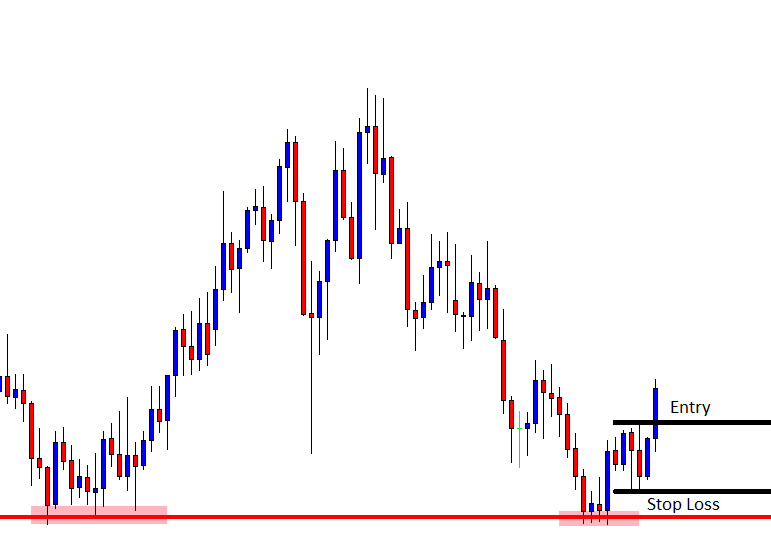
The price finds its support and produces two consecutive bullish candles. One of them breaches the resistance and closes well above the resistance. A long entry may be triggered here by setting the Stop Loss below the consolidation support.
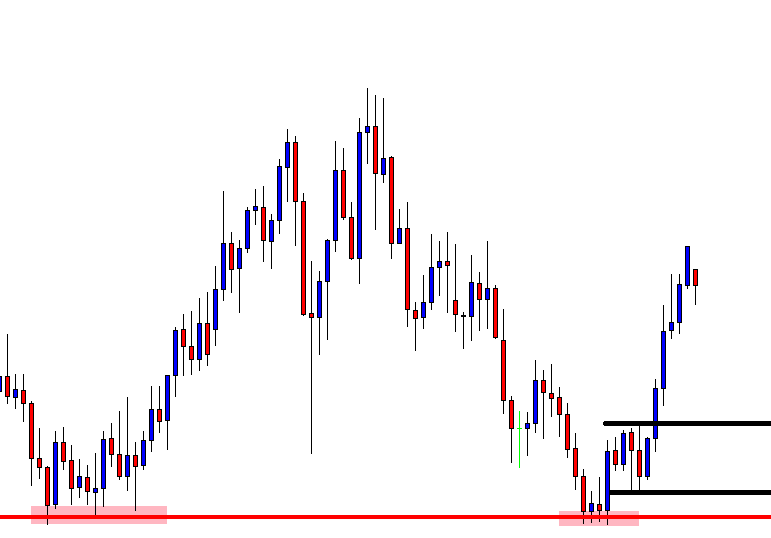
The price heads towards the North with good bullish momentum after triggering the breakout. The last candle on this chart comes out as a bearish candle with some gap. The buyers may consider closing the entry and come out with the total profit. On the other hand, some traders may want to take partial profit and ride on the wave up to the resistance. Have a look at the chart below.

The price may go up to the marked resistance level since this is the last swing high. If we consider the risk-reward, it is an amazing trade. The reward is about five times the risk. Do you remember how it started, though? It began with a Daily Inverted Hammer Candle (relatively weaker bullish reversal) at a Double Bottom’s support. Yes, this is what support of Double Bottom can do.