Where next for USDJPY – Support and Resistance areas explained
Thank you for joining this Forex academy educational video. In this session, we will be looking at a daily chart of the US dollar Japanese yen pair and looking at support and resistance lines.

It has been a tumultuous few months for the US dollar Japanese yen pair. With a high in February of 112.00 down to a low a few weeks later in March of 101.16. Many investors will have been completely caught offside, and wins and losses for those who got it right or wrong will have been substantial.
When analyzed on the daily chart adding simple support and resistance lines, we see clear patterns emerging of price action and where the exchange rate forms peaks and troughs.
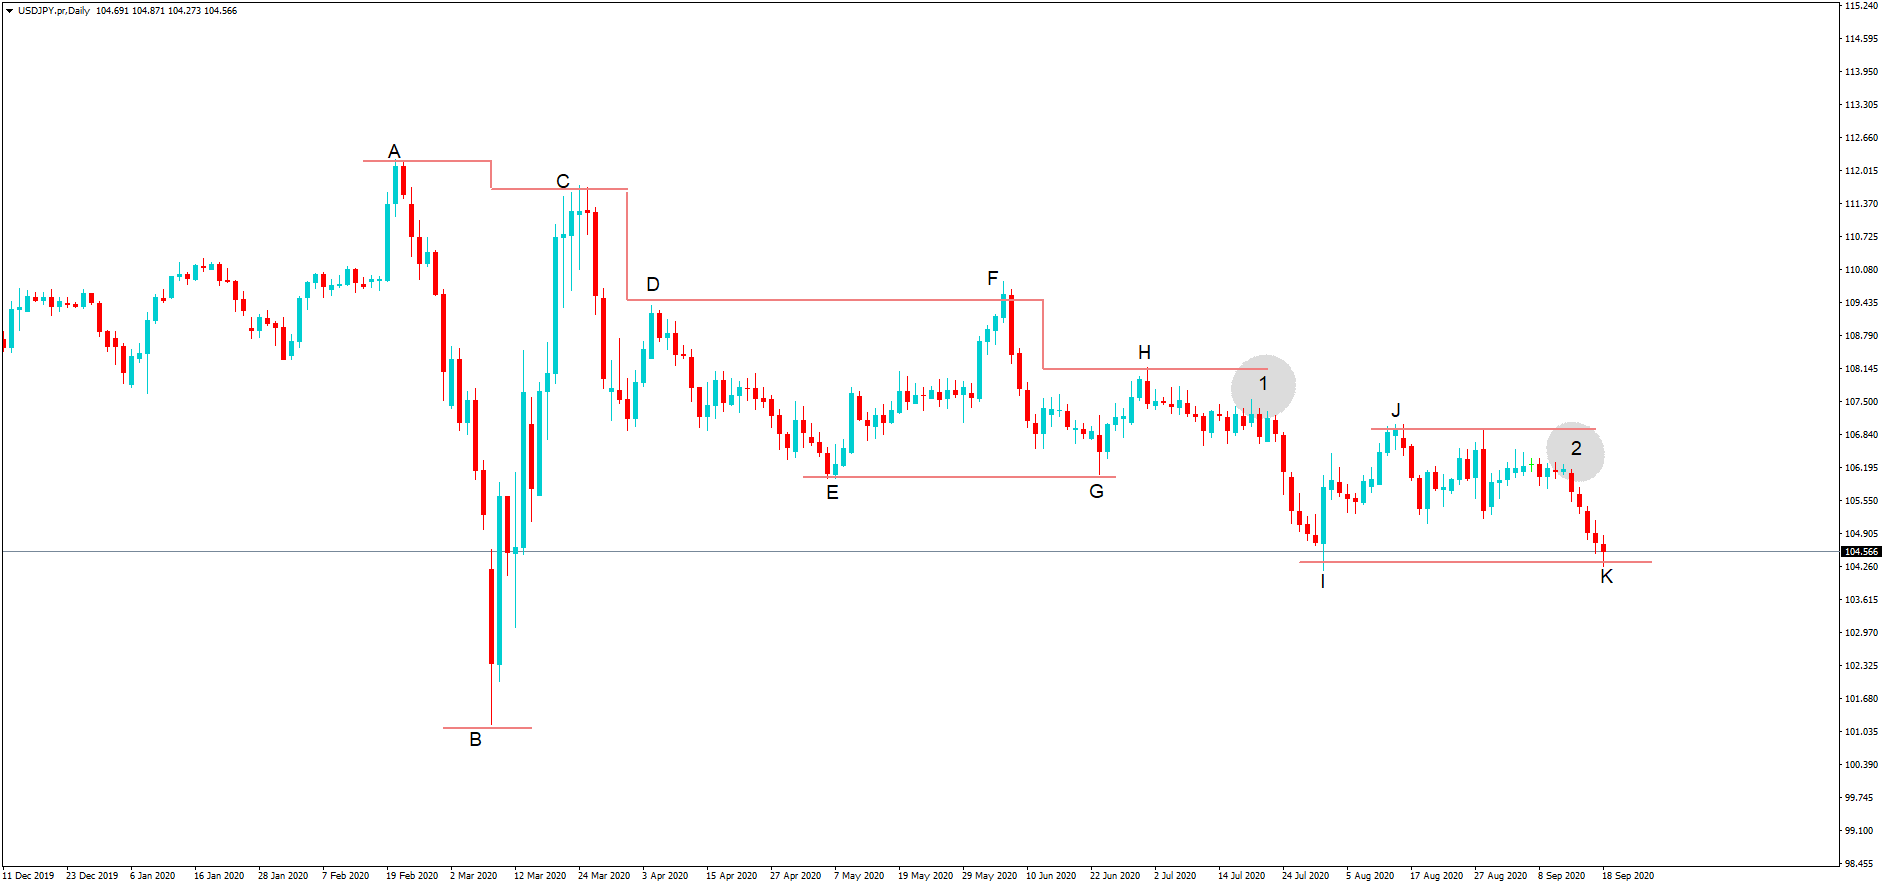
The fall in the pair from position A to position B was down to the coronavirus’s impact and where the Japanese yen is favored in times of such crisis due to its safe-haven status. However, this huge move had to become oversold, and of course, it did just above the key 101.00 level, and where we saw a rally back to position C, which incidentally is a step lower than position A. Typically, we find that institutional traders will pull out of a huge upside momentum trade slightly before a previous high, or a previous low if the situation was reversed because they fear that in this situation sellers are lurking at the previous high level, and that is proved when the pair pulls lower.

We then see a period of consolidation between positions D E and F. And a subsequent lower step to G and where the pair only manages a following high at position H, again a defined step lower than the previous high of position F.
Now things become interesting because price action fades in a tight consolidation period and at position 1 does not reach the previous high of position H and collapses down to position I. Again, we have a shift lower to position J and where we again see price not able to pull back to that resistance line at position 2, and price again begins to fade down to position K which incidentally is a double bottom formation aligned with position I.
These fading areas of price action are unable to reach previous highs, as shown by positions 1 and 2 and very strong telltale signs that price action is about to move lower. Obviously, the opposite applies. But with the USDJPY pair, we are looking for reasons to go short due to the overall fading trend and the nature of the yen being bought in times of uncertainty.

And with the market being extremely volatile right now and US elections only a few weeks, we can reasonably expect a continuation in the strength of the Japanese yen and, therefore, more movement to the downside in this pair.
Add these simple trend lines of resistance and support to your own charts and look out for fading price action to these lines, such as described in positions 1 and 2.


