Simplifying the Ichimoku Cloud indicator for trading the Japanese Yen
The Ichimoku Cloud technical indicator was developed by Goichi Hosoda, a Japanese journalist, in the late 1960s. It is favoured by Japanese traders who use it to predict areas of support and resistance and it also shows momentum. It produces its data on historical price action and is therefore considered to be a lagging indicator.
All types of traders use the indicator for various currency pairs, however it is predominantly used for trading the yen. The Ichimoku Cloud is composed of 5 lines of calculations and where clouds form on charts along with moving averages and lines showing momentum.
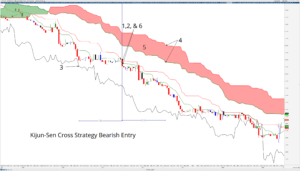
The basic principle is that if price action is going on underneath the bottom section of the cloud, it is confirming an area of resistance is above and that a downtrend is likely or happening and if price action is going on above the top section of the cloud it is confirming that the cloud is supporting price action, or that an uptrend is in progress. Another key feature of the cloud is that it should ideal be moving in the direction of the trade that you wish to take.
Example A
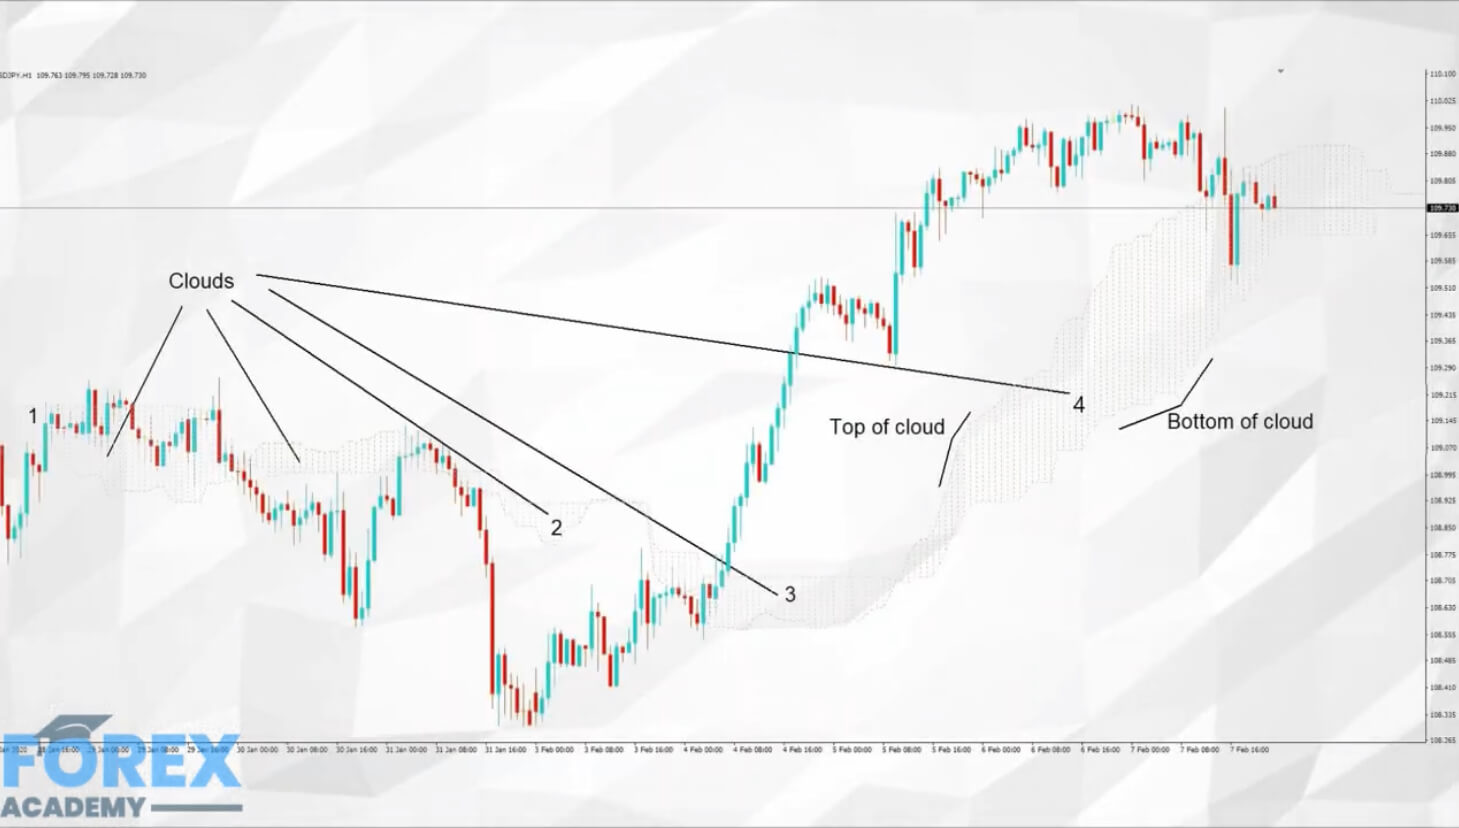
Example A, is the cloud component only on a 1-hour chart of the USDJPY pair. We can see various clouds forming on the chart in areas 1, 2, 3 and 4.
Example B
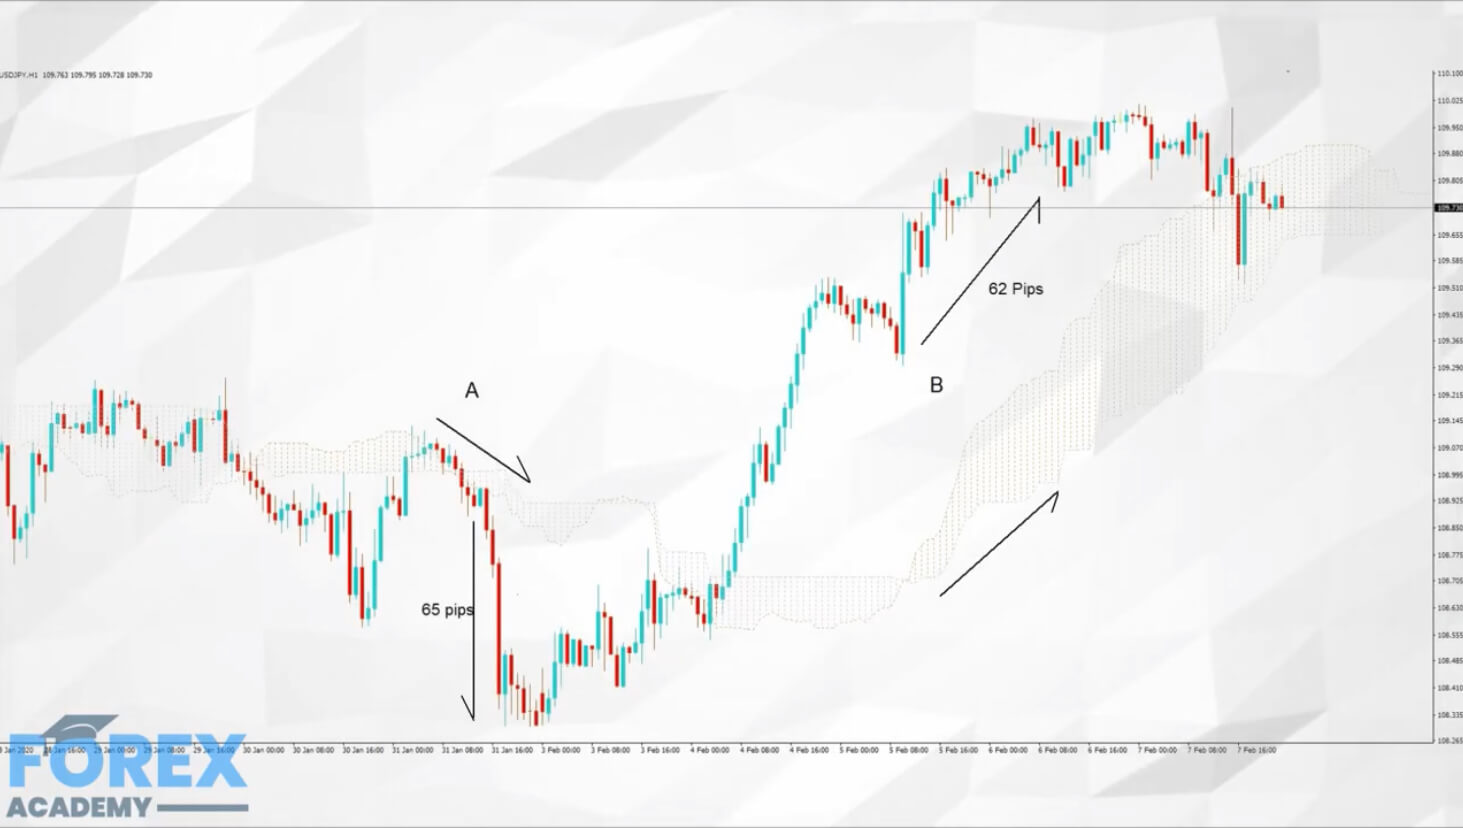
Example B shows us that if we were trading this chart and waited patiently for the above methodology to kick in we have a downwards move on the cloud at position ‘A’ which is followed by subsequent price action to the downside producing 65 pips.
While later on, at position B we have an upward moving cloud and where price action is supported by this set up producing 62 pips. This is simply using the cloud only component of the indicator.
Example C
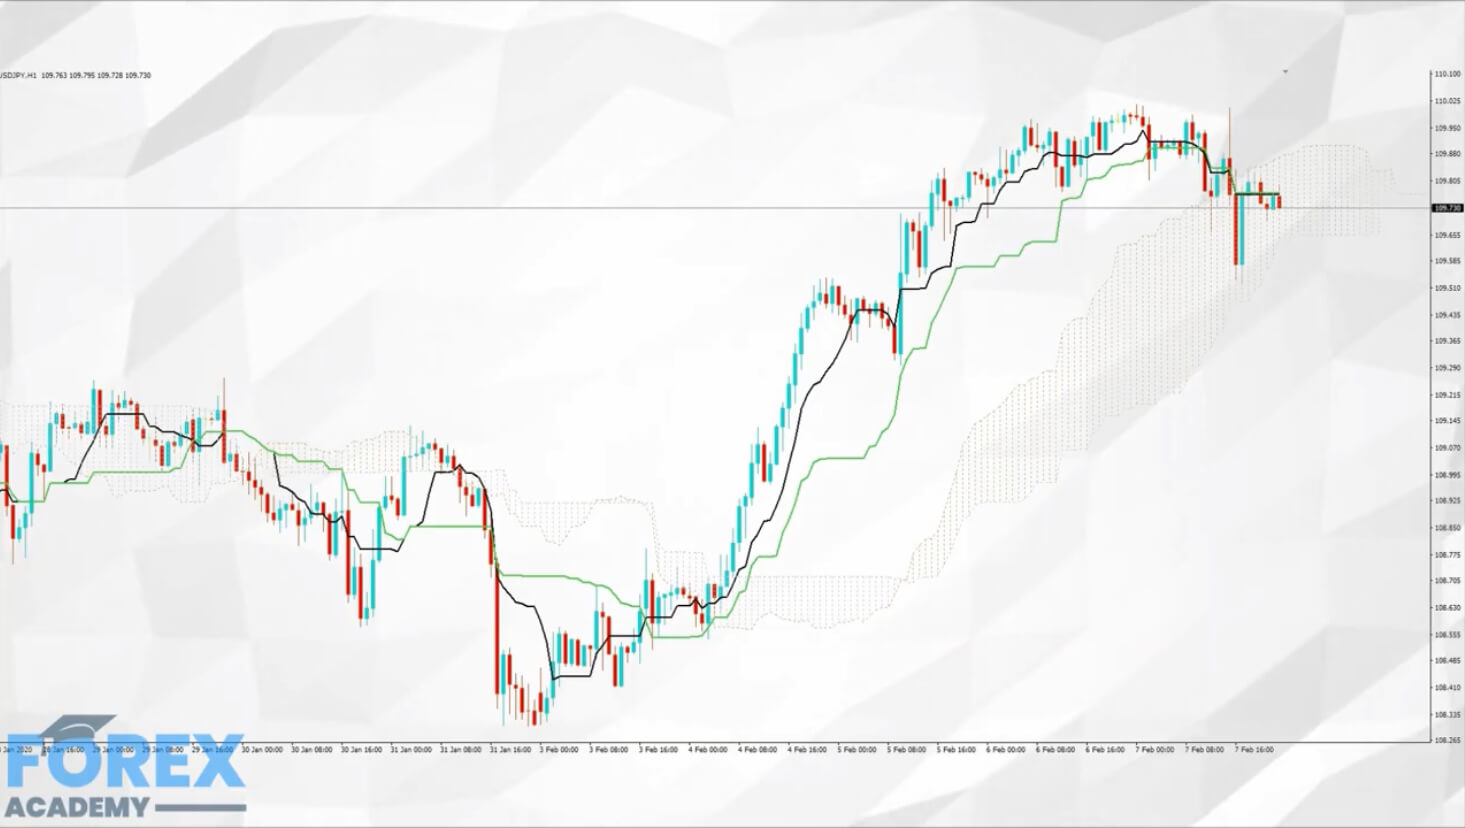
In example C we have added the moving average components and we are looking for the price action to be above the black MA, and where the black MA is above the green MA, and where our cloud must be ascending to support our buy side trade. Or we need price action to be underneath the the green moving average and where the green MA is below the black MA, and supported by a descending cloud to support our sell-side trade. It is important to note that the calculations for the MA’s in this chart are calculated differently than the usual simple moving averages. The cloud MA’s are based on highs and lows over a period, and then divided by two.
In order to keep things as simple as possible, we have elected not to use the final momentum part of the indicator, because it throws up an awful lot of noise on the chart. One of the biggest criticisms of this indicator is that there are too many components on the chart, thus making it difficult to read. The best way to identify trend is by analysing the shape and size of each candlestick. The larger the candlestick, the greater the momentum.
It is also important to point out that if the indicator is predominantly use for trading the yen currency and we would suggest that you stick to this if you decide to use the indicator because at the very least it shows you you what other yen traders are looking at on their charts. And the bottom line is we want to be trading the same way as the big guns in order to be successful.