
Trading crypto using Ichimoku Cloud – part 1/2
Ichimoku Kinko Hyo is a well-known indicator that seems complex to many traders but actually isn’t. Once you know how it works, it makes your crypto-trading decisions easier and faster. Mastering Ichimoku Cloud trading will really bring you one step closer to the main goal of trading, which is making high-probability decisions in a relatively short time span.
Ichimoku Cloud indicator – definition
Ichimoku Kinko Hyo is translated as the “one look equilibrium chart.” It was created with a specific purpose, which is to enable quicker decision making in trading. Ichimoku Cloud is one of the main indicators offered at websites such as TradingView.
Ichimoku Cloud lines – explained
The Senkou and Kumo
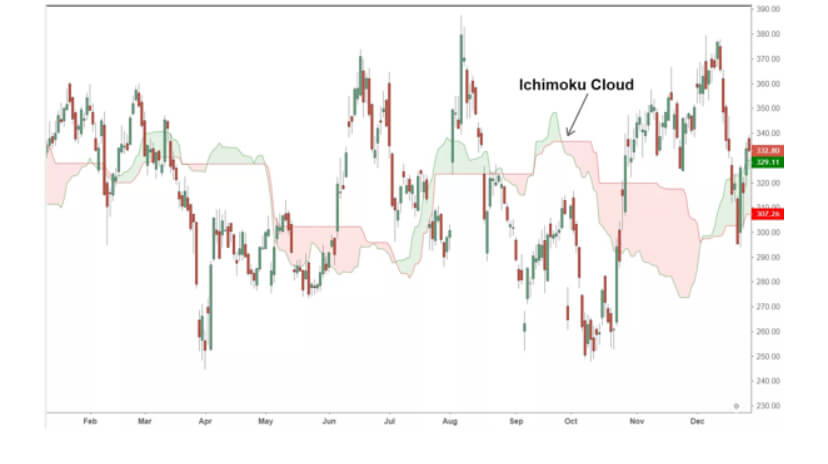
“Senkou span” represents the borders of the filled cloud, which is known as the “Kumo cloud.” This span is filled with green color when the market is bullish, while it is red in bearish markets.
Senkou lines represent major support/resistance areas, and they attract the price. Using these lines, traders set their entries, exits, and stops. However, they are mostly used as additional information alongside some other indicators.
The TK lines and Cross
The Ichimoku Cloud also consists of the Tenken and Kinjun lines, or “TK lines.” These are the balance lines, basically fast and slow MA’s.
As they are moving averages, traders will look for crosses when they search for trend reversals. Because of the names of these lines, the Cross is called “TK cross.” However, TK lines are also important, even when there is no cross in sight. They can signal that the price of a cryptocurrency is neither overpriced nor underpriced if the price sticks around them. On the other hand, if the price action happens very far from the TK lines, it shows that the price is way out of balance and that a pullback is likely. It is important to note that this indicator by itself is not a trigger to open positions expecting a pullback.
The Chinkou
The “Chinkou” span is an indicator that is a lagging one. It is used to confirm trend strength. When the Chinkou line is above the candles, it means that the market is strong. On the other hand, if the Chinkou crosses below candles, it’s a bearish market.
When there is strong action while the lagging line crosses the candles, the trend is slowly weakening and becoming undecided. This tells traders to look for a reversal.
Reading Ichimoku Cloud
Ichimoku cloud Bullish signals
In order to have a strong bullish signal, everything in this indicator must occur above the Kumo cloud, namely:
The price action has to remain above the Kumo cloud.
The Chinkou line has to stay above the Kumo
Tenken has to cross Kinjun above the Kumo – if this Cross occurs inside the Kumo, that’s only slightly bullish.
Ichimoku cloud Bearish signals
In order to have a strong bearish signal, simply reverse everything said about the bullish signals:
The price action occurs below Kumo
Tenken and Kinjun have to be crossing
The Chinoku line has to stay below the Kumo.
If none of these is happening yet, it most likely means that the market is undecided, sideways, or waiting for direction.
Check out part 2 of Trading Cryptocurrencies using the Ichimoku Cloud to learn about cryptocurrency setups using this indicator as well as to learn the popular indicators that get along with Ichimoku well.
Related posts
 Make Money In Forex Using The Ichimoku Cloud indicator!
 Forex Academy Education For Absolute Beginners Session Five – Becoming A Professional Trader
 Free Forex Signals App! – Forex Academy’s FA Signals App Now Available For Android & IOS
 Forex For Beginners – How To Trade EURGBP! Buying The Euro With A No Brexit Trade Deal!