
The Forex market can be very unpredictable. It is a game of probability. With more experience and knowledge, a trader increases the chance to be right in making a trading decision. Having immaculate risk management is another aspect that keeps a trader safe with his investment. In today’s lesson, we are going to talk about the unpredictability of the market.

Let us start with a daily chart of a Forex pair.
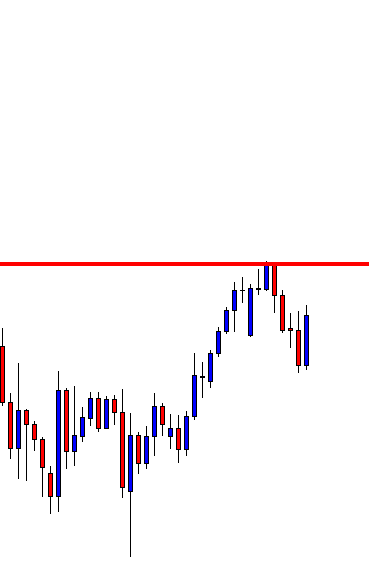
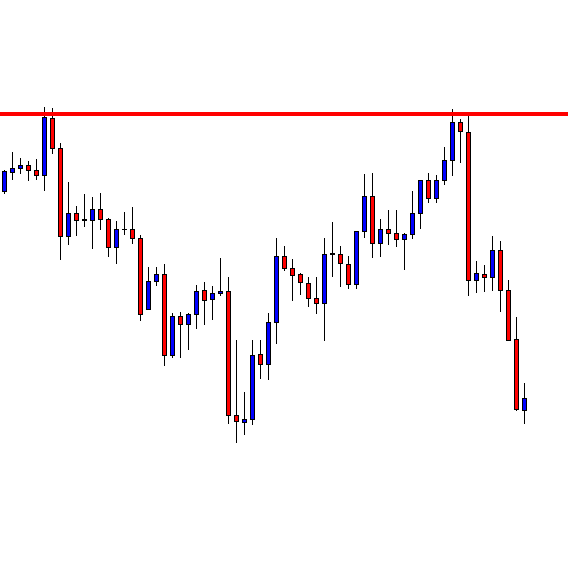
The price makes a bullish move and finds its resistance. After four daily candles, the daily chart produces a bullish engulfing daily candle. This is a powerful bullish reversal candle, which forms right at a flipped support. Have a look at the chart below.
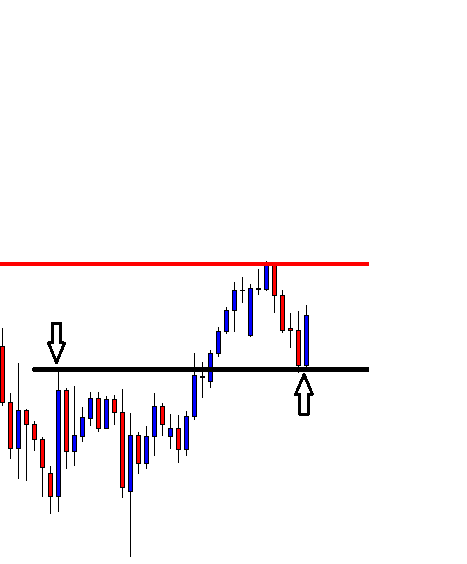
The chart above shows that the bullish engulfing candle forms at the flipped support. This means buyers on this chart are to go long on a chart pattern called ‘ABC’ or ‘123’. This is a lucrative and consistent chart pattern, which price action traders love to trade. Let us find out what happens next.
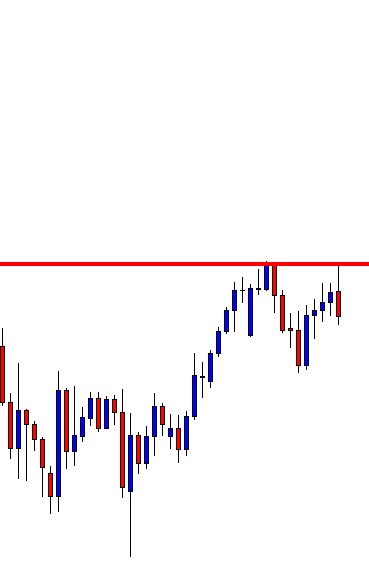
The price stalls and has a rejection at the same level. The buyers would love to get a breakout here to go long and grab some green pips. However, the chart produces a bearish engulfing candle instead. What do you think a trader should do here?
He shall start looking for short opportunities. This is the daily chart. Thus, he shall flip over to the H4 chart to find out a short opportunity.

This is how the H4 chart looks. A very strong bearish candle followed by a little Inside Bar. The trader (the seller) is to wait for consolidation and a bearish reversal candle to go short.
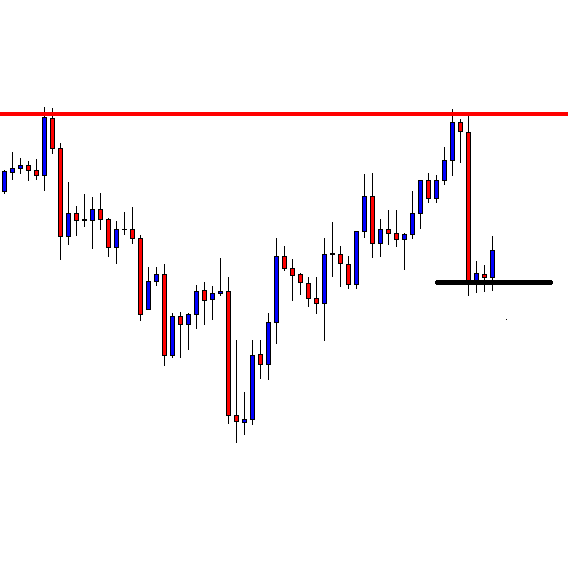
The price consolidates more. It produces a good-looking bullish candle. Let us find out how the next candle comes out. Do not forget that the sellers are waiting to get a bearish reversal candle breaching the lowest low.

This is it. A bearish engulfing candle closes below the level of support. The sellers have been waiting to get a signal candle like this. A short entry may be triggered right after the last candle closes. Let us find out what happens next.
As expected, the price heads towards the South with good bearish momentum. We see the first H4 bullish reversal candle forming at the daily support as well. This may be time to take out the profit.
The Bottom Line
Do you notice how things change within a candle? Before that bearish engulfing daily candle, the pair looks extremely good for the buyers. An upside breakout would make them go long on the pair and push the price towards the North. However, that does not happen, but the price comes down instead. This is what I call “Twist in the tale.” Forex traders often get these twists.