The price after making a strong bullish or bearish move, it makes correction/ consolidation. The price consolidates within two horizontal lines. In the financial market, this is called Rectangle. In today’s lesson, we are going to demonstrate some examples of the bullish and bearish rectangle.

Let us start with a bullish rectangle.
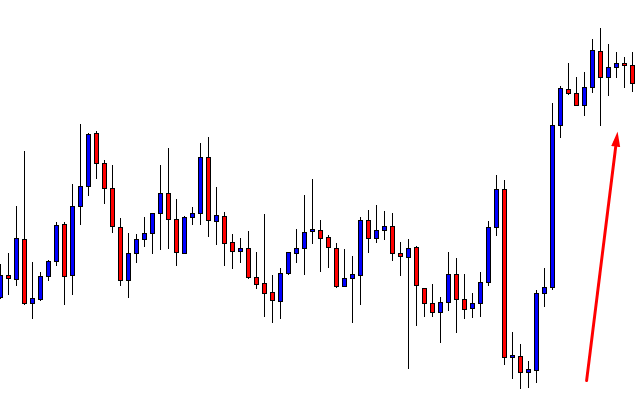
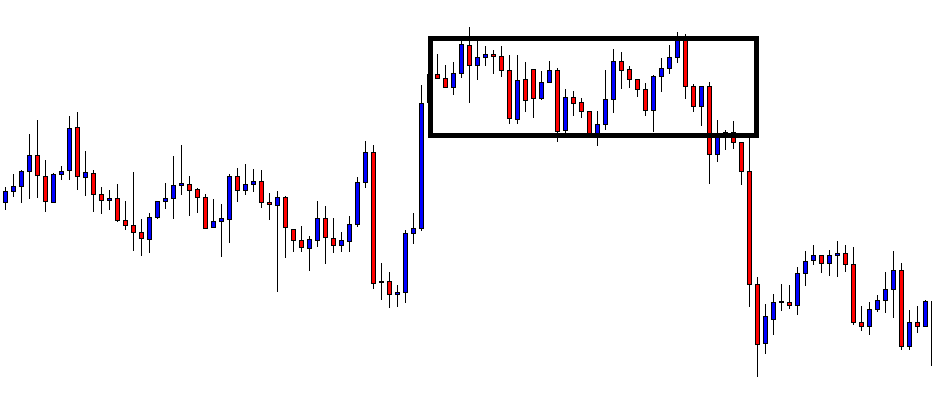
The price heads towards the upside with good bullish momentum. At the top, the price seems to start having consolidation. A buyer may want to keep an eye for an upside breakout to go long from here. However, the price continues to consolidate.
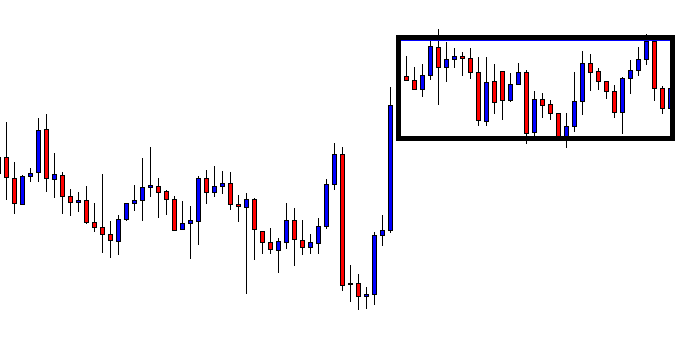
The price consolidates within two horizontal lines. We can draw a rectangle here since the price produces the rectangle after a bullish move, so it is called ‘Bullish Rectangle.’ Traders are to wait for a breakout to take an entry. A downside breakout offers a short entry, and an upside breakout offers a long entry. Let us find out which way the next breakout takes place and the price heads to.
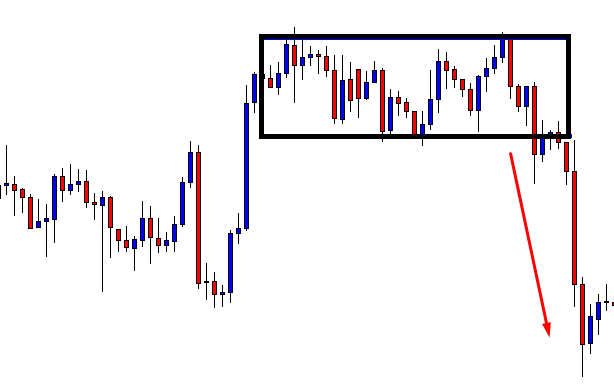
The price makes a downside breakout and heads towards the South. At rectangle breakout, the price usually travels at least the same distance of the consolidation length. It seems the price travels 1.5X distance of the consolidation length here. Let us concentrate on the next chart below.
The price consolidates getting trapped within horizontal support and resistance. Do you find anything interesting here? Yes, we find another rectangle. This time it is a bearish rectangle. Let us draw those two lines here.
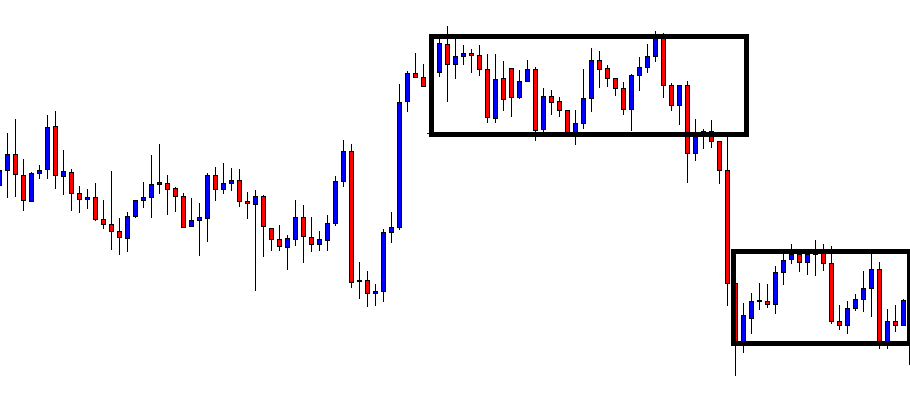
Again, traders must wait for a breakout to find out its next direction. The price has several bounces and rejections within those two horizontal lines. It is a bearish rectangle, but we know a breakout can take place either way. There is no point in guessing. Let us wait and find out.
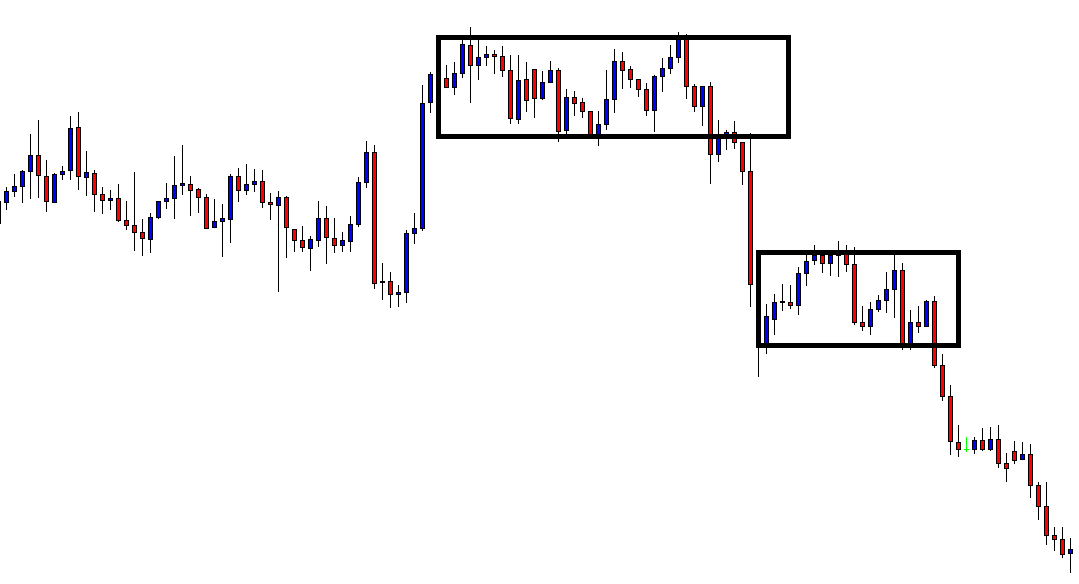
The price makes a downside breakout and heads toward the South with good enough selling momentum.
We have demonstrated two examples here. The first one is a bullish rectangle where the price makes a downside breakout. The second one is a bearish rectangle, on which the price makes a downside breakout as well. Breakout direction does not depend on the bullish or bearish rectangle. Trader’s job is to wait for the breakout and breakout confirmation. Entry is to be taken only when the breakout is confirmed. We can spot rectangles almost in all the time frames. However, it is often seen on the H1, H4, and Daily charts. Have some practice on the demo account or do some backtesting to get well acquainted with the pattern to make green pips.