
Introduction
Forex is the most liquid and volatile market in the world. The average pip movement in the major currency pairs is around 100 pips. However, as a retail trader, it is not impractical to grab 100 pips every single day. Though there are some strategies out there, it is very challenging to make 100 pips per day every day. But, there is 20 pips strategy, 30 pips strategy as well as 50 pips strategy, which is much reliable than the 100 pips strategy. So, in this lesson, we shall be discussing the 20 pips strategy.
The 20 Pips Strategy
The strategy is very simple and straightforward. According to this strategy, when the price breaks above a range in a logical area, you must go long, and when it breaks below a range in a logical area, you must go short. So, this strategy is basically a breakout strategy. However, it’s not as straightforward as it sounds. There are some criteria one must consider before trading this strategy.
❁ Considerations
✓ Currency Pair
You can trade this strategy on any currency pair. However, it is recommended to focus mainly on major and minor currency pairs.
✓ Session
Though the market is open 24 hours, it does not mean you can apply this strategy any time during the day. To keep it safe, it is advised to trade only during the times when there is high liquidity. That is, the London – New York overlap would be the best time to apply this strategy. Else, the London session or the New York session will work perfectly fine as well. And it is great if you do not trade it during the Asian session, as markets don’t usually break out during this period.
✓ Timeframe
Timeframe plays an important role when it comes to trading a strategy of this type. To make 20 pips a day, it is ideal to stay between the 1hour timeframe and the 15-minute timeframe.
✓ Indicators
This strategy does not require any technical indicators.
❁ How to trade the 20 pips strategy
Below is a step by step process to trade this strategy.
- Open the candlestick chart of any currency pair, preferably, a major or minor currency pair.
- Firstly, go to the 1-hour timeframe in the chart and see if the market is in a logical area to buy or sell (Ex: Support and resistance).
- If yes, then wait for the price to break above or below the consolidation area.
- Check the strength of the breakout on the lower timeframe (15 minutes). Based on the strength, prepare to hit the buy or sell.
❁ Trading the 20 pips strategy on the live charts
• Buy example
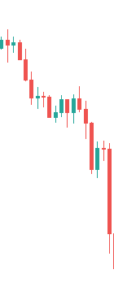
Below is the chart of AUDUSD on the 1-hour timeframe. We can see that the market has been bouncing off from the purple line. So, this becomes a logical area to buy. At present, the market is holding at the purple support line. And it was in a tiny range for like ten candles. Now, to apply the strategy, we need the market to break above this range.
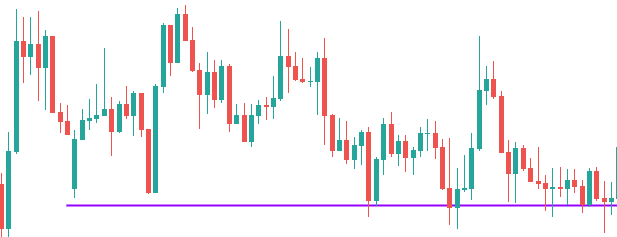
In the below image, we can see that the market breaks above the range with a big green candle. But, before hitting the buy, we must switch to the lower timeframe and see if the momentum of the candle that broke the range was strong or not.
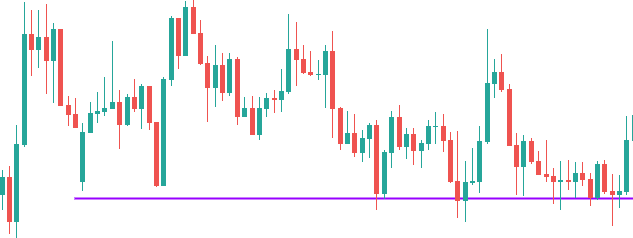
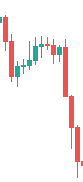
In the below 15 min chart, we can clearly see that the broke above the range in just two green candles. This is an indication that the buyers have come up strong. Hence, now we can prepare to go long.
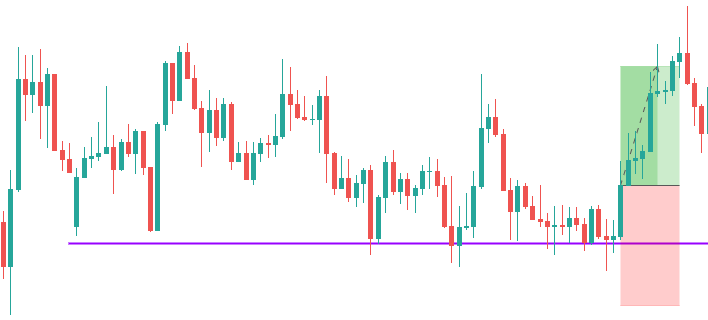
Coming to the take profit and stop loss, the take profit would, of course, be 20 pips, and the stop loss can be kept a few pips below the support area. Alternatively, you can even go for a 1:1 RR by keeping a stop loss of pips.
• Sell example
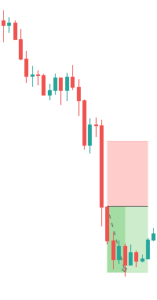
Note that this strategy can be applied when the market is in a trending state as well. Below is the chart of EUR/USD on the 1-hour timeframe, and we can see that the market is in a downtrend. The market keeps making lower lows and lower highs. At present, it can be seen that the market is pulling back, and a green candle has appeared. Now, all we need is the price to break below the pullback to give us a heads up that the downtrend is still active.
In the below chart, we can see that, in the very next candle, the market broke below the pullback area. Hence, we can prepare to go short after getting confirmation of the strength from the lower timeframe.
In the below 15-minute timeframe chart, we can see that the momentum of the candle was sufficiently robust during the breakout. Hence, we can consider shorting in now.
As far as the take profit and stop loss are concerned, it remains the same as the previous example. That is, 20 pips take profit with 20 pips stop loss.
Bottom line
A great feature to consider about this strategy is that it can be used in any state of the market. However, all the criteria mentioned above must be met for the strategy to work. If you’re a beginner in trading, then this could be an ideal strategy to get started with. And if you have experience in trading, you can try enhancing the strategy by applying some indicators and patterns.
Note that this strategy, just like other strategies, does not provide 100% accuracy. There are times when this strategy fails, as well. Hence, it is recommended to use this strategy in conjunction with other strategies to have a better winning probability. Happy Trading!


One reply on “Heard Of The Amazing ’20 Pips Per Day’ Strategy?”
Thank you