Introduction
The CAD/TWD is an exotic currency pair where CAD is the Canadian Dollar, and the TWD is referred to as the Taiwan New Dollar. In this pair, CAD is the base currency, and the TWD is the quote currency, which means that the exchange rate for the pair shows the quantity of TWD that can be bought by 1 CAD. In this case, if the exchange rate for the pair is 21.864, then 1 CAD buys 21.864 TWD.
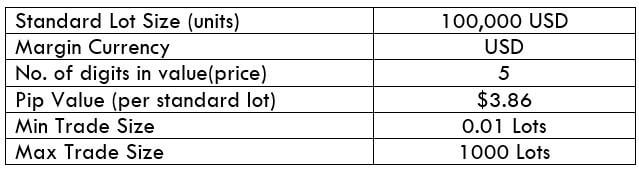
CAD/TWD Specification
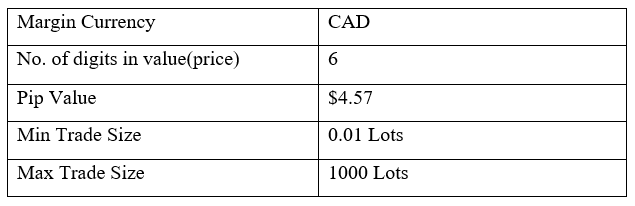
Spread
In the forex market, the spread is considered a cost to the trader. It is the difference between the ‘bid’ and the ‘ask’ price. Here are the spread charges for ECN and STP brokers for CAD/TWD pair.
ECN: 29 pips | STP: 34 pips
Slippage
When trading forex, slippage occurs when the execution price is below or above the price at opening the trade. The primary causes of slippage are the brokers’ speed of execution and market volatility.
Trading Range in the CAD/TWD Pair
The trading range in forex is used to analyze the volatility of a currency pair across different timeframes. This analysis gives the trader a rough estimate of how much they stand to gain or lose by trading that pair over a given timeframe. For example, say the volatility of the CAD/TWD pair at the 1-hour timeframe is 20 pips. Then, a trader can anticipate to either profit or lose $91.4
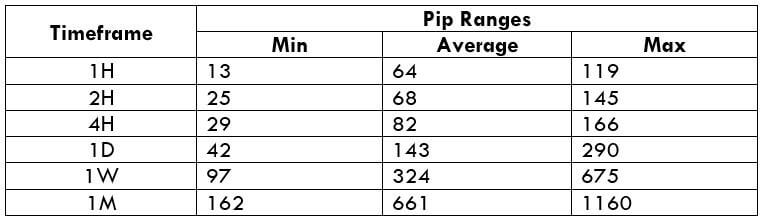
The trading range for the CAD/TWD pair is shown below.

The Procedure to assess Pip Ranges
- Add the ATR indicator to your chart
- Set the period to 1
- Add a 200-period SMA to this indicator
- Shrink the chart so you can determine a larger period
- Select your desired timeframe
- Measure the floor level and set this value as the min
- Measure the level of the 200-period SMA and set this as the average
- Measure the peak levels and set this as Max.
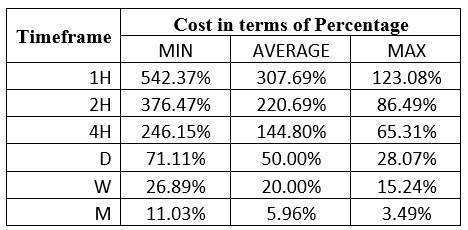
CAD/TWD Cost as a Percentage of the Trading Range
For us to understand the trading costs associated with the volatility, we will determine the total cost for both ECN and STP accounts as a ratio of the above volatility.
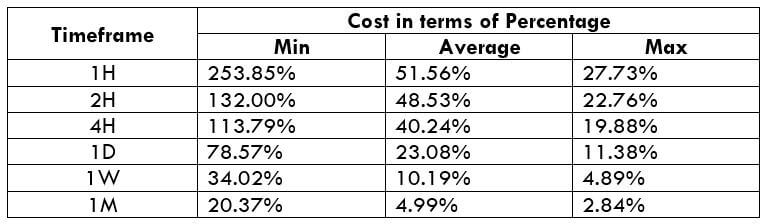
ECN Model Account
Spread = 29 | Slippage = 2 | Trading fee = 1
Total cost = 32
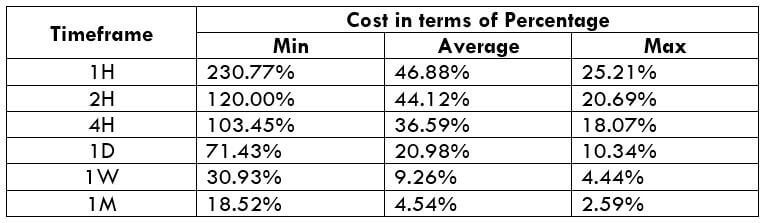
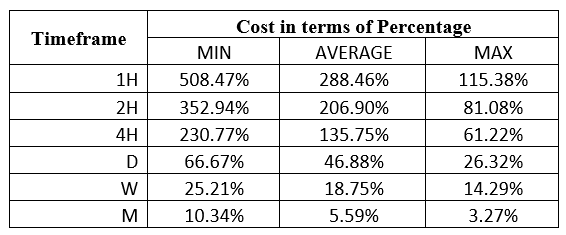
STP Model Account
Spread = 34 | Slippage = 2 | Trading fee = 0
Total cost = 36

The Ideal Timeframe to Trade CAD/TWD
From the above analyses, we can conclude that it is costlier trading the CAD/TWD pair on shorter timeframes when volatility is low. Longer timeframes, i.e., the weekly and the monthly timeframes, have lesser trading costs. Therefore, it would be more profitable trading the CAD/TWD pair over longer timeframes.
However, for intraday traders, opening positions when the volatility is above the average will reduce the trading costs. More so, using forex limit orders instead of market orders will reduce the trading costs by eliminating the costs associated with slippage. Here’s an example.
ECN Account Using Limit Model Account
Total cost = Slippage + Spread + Trading fee
= 0 + 29 + 1 = 30
You can notice that using the limit orders significantly reduces the cost as a percentage of the trading range.