Categories
Forex Assets

Costs Involved While Trading The ‘CAD/TWD’ Forex Exotic Currency Pair

Introduction

The CAD/TWD is an exotic currency pair where CAD is the Canadian Dollar, and the TWD is referred to as the Taiwan New Dollar. In this pair, CAD is the base currency, and the TWD is the quote currency, which means that the exchange rate for the pair shows the quantity of TWD that can be bought by 1 CAD. In this case, if the exchange rate for the pair is 21.864, then 1 CAD buys 21.864 TWD.

CAD/TWD Specification

Spread

In the forex market, the spread is considered a cost to the trader. It is the difference between the ‘bid’ and the ‘ask’ price. Here are the spread charges for ECN and STP brokers for CAD/TWD pair.

ECN: 29 pips | STP: 34 pips

Slippage

When trading forex, slippage occurs when the execution price is below or above the price at opening the trade. The primary causes of slippage are the brokers’ speed of execution and market volatility.

Trading Range in the CAD/TWD Pair

The trading range in forex is used to analyze the volatility of a currency pair across different timeframes. This analysis gives the trader a rough estimate of how much they stand to gain or lose by trading that pair over a given timeframe. For example, say the volatility of the CAD/TWD pair at the 1-hour timeframe is 20 pips. Then, a trader can anticipate to either profit or lose $91.4

The trading range for the CAD/TWD pair is shown below.

The Procedure to assess Pip Ranges

  1. Add the ATR indicator to your chart
  2. Set the period to 1
  3. Add a 200-period SMA to this indicator
  4. Shrink the chart so you can determine a larger period
  5. Select your desired timeframe
  6. Measure the floor level and set this value as the min
  7. Measure the level of the 200-period SMA and set this as the average
  8. Measure the peak levels and set this as Max.

CAD/TWD Cost as a Percentage of the Trading Range

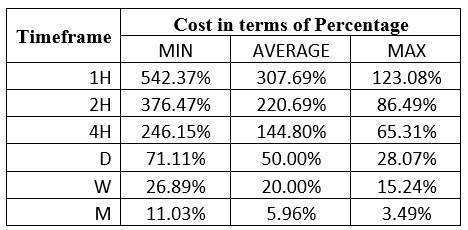
For us to understand the trading costs associated with the volatility, we will determine the total cost for both ECN and STP accounts as a ratio of the above volatility.

ECN Model Account

Spread = 29 | Slippage = 2 | Trading fee = 1

Total cost = 32

STP Model Account

Spread = 34 | Slippage = 2 | Trading fee = 0

Total cost = 36

The Ideal Timeframe to Trade CAD/TWD

From the above analyses, we can conclude that it is costlier trading the CAD/TWD pair on shorter timeframes when volatility is low. Longer timeframes, i.e., the weekly and the monthly timeframes, have lesser trading costs. Therefore, it would be more profitable trading the CAD/TWD pair over longer timeframes.

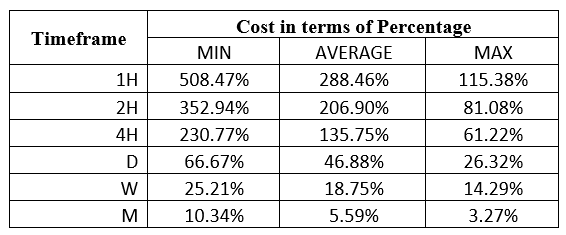
However, for intraday traders, opening positions when the volatility is above the average will reduce the trading costs. More so, using forex limit orders instead of market orders will reduce the trading costs by eliminating the costs associated with slippage. Here’s an example.

ECN Account Using Limit Model Account

Total cost = Slippage + Spread + Trading fee

= 0 + 29 + 1 = 30

You can notice that using the limit orders significantly reduces the cost as a percentage of the trading range.

Categories
Forex Market Analysis

Analysts Expect Raises on Inflation and Retail Sales Data – Forex and Indices – Daily Update – 21.08.18


Fundamental Overview


Analysts expect raises on inflation and retail sales data.

The Canadian Dollar will be the driver currency of this Friday 22nd trading session, with the release of Inflation and Core Retail Sales data. Analysts expect the Consumer Price Index (CPI) for the month of May to rise to 0.4%, driven mainly by the increase in fuel and food prices; with this increase, the CPI (YoY) estimated should reach 2.5%, being higher than the 2.2% reported in April.

On the other hand, analysts foresee that core retail sales (MoM) would rise to 0.5% during the month of April, which represents an optimistic scenario since the contraction of 0.2% reported in March.

This data could contribute to the scenario of a possible hike in the interest rate by the Bank of Canada (BoC), being in line with what was commented by the BoC Governor Stephen Poloz, who stated that he expects an increase in the interest rate soon.


Technical Analysis


EURUSD

EURUSD bounced from the lowest level in three weeks from 1.1507 to 1.1633. Our vision is that the common currency could make a limited recovery to the 1.17 area before we see fresh lows likely in the 1.1425 zone. Invalidation level of the mid-term bearish cycle is 1.1852.


GBPUSD

GBPUSD bounced from the PRZ forecasted at 1.3109 aided by the Bank of England (BoE) monetary policy decision. Now we should see fresh higher highs and lower highs to validate the change in bias. The short-term resistance level is at 1.3298.


USDCHF

The USDCHF pair broke down the short-term ascending trendline. Now we expect that the price tests the long-term ascending trendline. Our main vision for USDCHF is that it could make a new bearish leg with first support at the 0.98 level, and 0.9788 as the second support.


EURCAD

EURCAD could make a new higher high in the upper line of the ascending channel with a target in the 1.5533 area. After this move, if the price breaks down the short-term ascending trendline, we should see a flag pattern as a continuation of the previous movement.


GBPCAD

GBPCAD is developing in an ascending wedge, which could see fresh highs at the 1.7732 level, as a false breakout before it falls to the long-term ascending trendline. The first support level to watch out for is 1.7455.


FTSE 100

FTSE 100 continued falling for the fifth consecutive week. In the current session, it tested support at 7,548, the low reached on June 18th. Our vision for the British index is that it could complete the corrective sequence in the 7,400 area, from where FTSE could build a new bullish connector.


DAX 30

As was commented in our previous Daily Update, the DAX 30 is moving bearish, developing a Dead Cat Bounce Pattern. In the current trading session, the German index has fallen below the May 31st low at 12,547.6. The next support level is in the 12,300 area, from where we foresee the DAX should start to bounce.


Categories
Forex Market Analysis

Daily Market Update: Canadian CPI


News Commentary


Canadian Inflation and retail sales numbers on Friday could fuel expectations of a rate hike if they point to strong readings. Inflation in Canada has been higher in recent months and rose to 2.3% in March.

Economic CPI forecast to reach 0.3% with core retail sales to be 0.5%.

However, Negotiations about the North American Free Trade Agreement (NAFTA) have reached a dilemma with no meetings scheduled among the top leaders, ahead of the month-end.

Trump’s economic adviser Kudlow linked between NAFTA and China, indicating that an agreement on NAFTA would show that the US can avoid a trade conflict with China. The NAFTA agreement would also show Trump’s tactics, and if there is trade conflict with China, then it is China’s fault.


On the other side, inflation fell faster than the BoE forecasted in February.

Policymakers think the effects of sterling’s Brexit are likely to ease a slightly faster than expected, so they now plan that inflation will return to the 2 percent target in two years, despite the delay of the next rate rise.


The Australian Employment Change for April was better than expected with 22.6K, which crossed over the 19.8K estimate.

On the other hand, the Unemployment Rate rose for the fifth time since July 2017, reaching 5.6%.


Charts Analysis


AUD/USD

On the daily chart, the price had a false break beneath the support zone 0.75-0.7535. That enhances the harmonic pattern AB=CD. The pair had made a price action (pin bar) in this false break to boost the bullish bias. The pair is moving onto the support zone now. Along with divergence in RSI and breaking the lower trend line as shown, the price is ready for the next move up to 0.7635 then 0.7715.


USD/CAD

On the daily chart, the price had made its way into the resistance zone of 1.2925-1.3, with an approach from the descending trend line starting from the high of 2015. The price reversed from these levels, breaking beneath the key 1.28 support level and returning to it. If the daily candle closes under this level again, it will prompt the price to be bearish to the support zone 1.252-1.243.


AUD/JPY

On the daily chart, we can see that the price bounced from the support area of 80.35-81.2.

A well-noticed head & shoulders reversal pattern is shaped. The price is on the second shoulder with a breaking of the lower trend line as shown.

Followed by oversold on RSI and the breaking of the lower trend line, the price is expected to get back up again to the resistance area 84-84.35.