Categories
Forex Assets

Trading The ‘CAD/MYR’ Forex Exotic Currency Pair

Introduction

The CAD/MYR is an exotic Forex currency pair where CAD is the Canadian Dollar, and the MYR is the Malaysian Ringgit. In this pair, CAD is the base currency, while the MYR is the quote currency. The price associated with this pair represents the amount of MYR that can be traded for 1 CAD. For example, if the price of the CAD/MYR is 3.1163, it means that 1 CAD can purchase 3.1163 MYR.

CAD/MYR Specification

Spread

When trading a currency pair, the ‘bid’ price and the ‘ask’ price are different. This difference constitutes the revenues that brokers earn, and is called the spread. Below is the spread charges for ECN and STP brokers for CAD/MYR pair.

ECN: 4 pips | STP: 9 pips

Fees

Fees represent the charges that brokers impose on forex traders when opening a position. These charges vary on the ECN account, depending on your forex broker. STP accounts usually do not charge fees for trading.

Slippage

Sometimes we intend to complete a trade with a prevailing price, but instead, the trade is executed at a different price. The difference between the two prices is slippage, and it is a result of market volatility and your broker’s speed of execution.

Trading Range in the CAD/MYR Pair

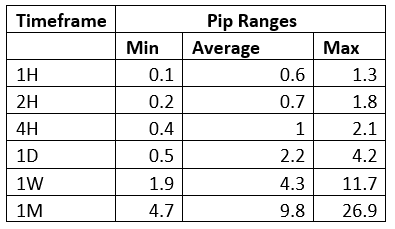
The trading range shows the volatility of a currency pair across different timeframes from minimum to the maximum expected volatility. The knowledge of market volatility can help a trader estimate possible gains or losses for different timeframes. Let’s say that the maximum volatility for the CAD/MYR pair at the 1-hour timeframe is 20 pips. A forex trader trading one standard lot of this pair can expect to gain or lose $64.2

Below is the trading range for the CAD/MYR pair.

The Procedure to assess Pip Ranges

  1. Add the ATR indicator to your chart
  2. Set the period to 1
  3. Add a 200-period SMA to this indicator
  4. Shrink the chart so you can determine a larger period
  5. Select your desired timeframe
  6. Measure the floor level and set this value as the min
  7. Measure the level of the 200-period SMA and set this as the average
  8. Measure the peak levels and set this as Max.

CAD/MYR Cost as a Percentage of the Trading Range

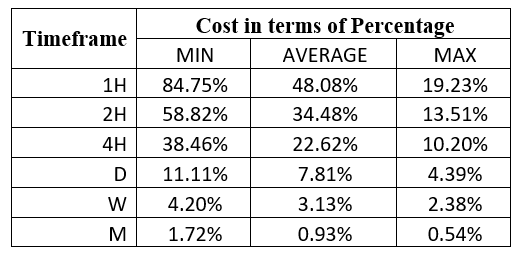
When the cost of trading is expressed as a percentage of the trading range, it can help a forex trader implement proper risk management measures. Below are cost analyses of the CAD/MYR pair for both the ECN and the STP accounts.

ECN Model Account

Spread = 4 | Slippage = 2 | Trading fee = 1

Total cost = 7

STP Model Account

Spread = 9 | Slippage = 2 | Trading fee = 0

Total cost = 11

The Ideal Timeframe to Trade CAD/MYR

In both the ECN and STP accounts, the 1-hour timeframe during minimum volatility of 0.1 pips has the highest trading cost. Generally, the 1H, 2H, 4H, and daily timeframes have higher trading costs compared to the weekly and the monthly timeframes. Therefore, longer-term traders of the CAD/MYR pair enjoy lesser trading costs.

However, the intraday traders can reduce their trading costs by initiating trades when the volatility for the 1H, 2H, 4H, and daily timeframes is above average. They can further lower these costs by using the forex limit orders, which eliminates the slippage costs. Here’s an example with the ECN account.

ECN Account Using Limit Model Account

Total cost = Slippage + Spread + Trading fee

= 0 + 4 + 1 = 5

You can notice that the overall trading costs have reduced when the limit orders are used. For example, the highest trading cost has been lowered from 118.64% to 84.75% of the trading range. Cheers.

Categories
Forex Assets

Analyzing The CAD/DKK Forex Exotic Currency Pair

Understanding CADDKK

CADDKK is an exotic currency pair where CAD is the major currency Canada and DKK is the currency of Denmark. In this currency pair, CAD is the first currency, and DKK is the quote currency.

The price of CADDKK determines the value of DKK that is equivalent to one CAD. We can term it as 1 CAD per X amount of DKK. For example, if the CADDKK pair’s value is at 4.7712, we need almost 4.7712 DKK to buy one CAD.

CADDKK Specification

Spread

When we subtract the Bid price and the Ask price, we will find the Spread. Spread is a trading cost that is controlled by the broker. Therefore, traders don’t have to do anything with this. This value changes with the change in execution.

Spread on ECN: 19 pips | Spread on STP: 24 pips

Fees

Trading fees in the forex market is the cost that the broker takes from traders. It is automatically deducted from traders’ trading account. Note that a few pips charges on ECN accounts but there is no fee on STP.

Slippage

Spread is the difference between the execution level and the open price level when it is an excessive level of volatility in the price. Market volatility and execution speed of your broker mainly contributes to the degree of slippage.

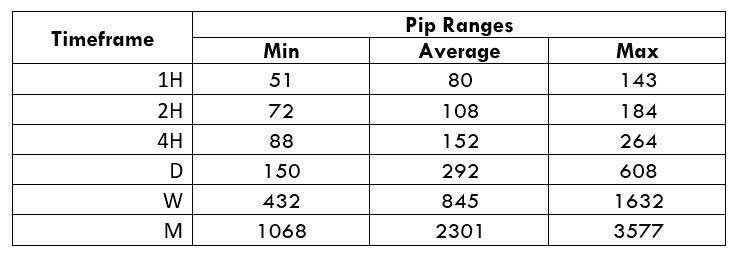
Trading Range in CADDKK

Procedure to assess Pip Ranges

  1. Add the ATR indicator to your chart
  2. Set the period to 1
  3. Add a 200-period SMA to this indicator
  4. Shrink the chart so you can assess a large time period
  5. Select your desired timeframe
  6. Measure the floor level and set this value as the min
  7. Measure the level of the 200-period SMA and set this as the average
  8. Measure the peak levels and set this as Max.

CADDKK Cost as a Percent of the Trading Range

With the volatility, values provide an indication of how the cost varies with the change of volatility. We got the ratio between the cost and volatility and converted into percentages.

ECN Model Account 

Spread = 19 | Slippage = 5 | Trading fee = 8

Total cost = Spread + Slippage + Trading Fee

= 19 + 5 + 8

Total cost = 32

STP Model Account

Spread = 19 | Slippage = 5 | Trading fee = 0

Total cost = Spread + Slippage + Trading Fee

= 19 + 5 + 0

Total cost = 24

The Ideal way to trade the CADDKK

The CADDK is an exotic currency pair with stable volatility in the price. Therefore, it may provide a decent movement even in intraday trading. The percentage of values did not move above 64%. Therefore, we can say that that CADDKK is nicely tradeable even if in the lower timeframe. However, the trading risk is an essential factor that most of the traders should consider while making a trading decision.

Overall all traders should trade when the cost is at an average value. The increase in volatility is risky for the possibility of unwanted stop loss hit, while the decrease in volatility might make trading worthless. To reduce the cost, furthermore, you can place either a ‘limit’ or ‘stop’ order. In this case, there will be no slippage, and in this example, our total cost will be reduced by five pips.

STP Model Account (Using Limit Orders)

Spread = 19 | Slippage = 0 | Trading fee = 0

Total cost = Spread + Slippage + Trading Fee

= 19 + 0 + 0

Total cost = 19

Categories
Forex Market Analysis

Business survey of the Bank of Canada is optimistic


Hot Topics:

  • Business survey of the Bank of Canada is optimistic.
  • How much could it cost to Facebook, the loss of users confidence?
  • Dollar Index the weakness remains..

Business survey of the Bank of Canada is optimistic.

The results shown by the survey of the Spring Business Outlook published yesterday by the Bank of Canada (BoC) reflects the confidence of the business sector, which is supported by good prospects for sales in most regions and sectors. Considering the credit conditions that remain intact, respondents continue to maintain their intentions in the increase of investments, however, expect a slight adjustment in conditions.

On the technical side, the loonie is within a bearish wedge formation. The price is testing 50% of the entire previous bullish cycle. Added to this, it has also reached and broken the psychological level of the 1.27, which is acting as support at this time. Our vision is that between the 50% and 61.8% zone, it should begin to develop a bullish movement up to the area of 1.29 – 1.30. In the short term, the dominant trend is bearish. Bullish positions are valued above 1.2745.

How much could it cost to Facebook the loss of users confidence?

The social network created by Mark Zuckerberg is still in the midst of criticism. The Facebook scandal that began with Cambridge Analytica, where it was revealed that the private data of 87 million users were sold and used with the aim of manipulating the decisions of the users and that it was later shown that the private data of the most of 2 billion users are vulnerable. It has led his CEO to have to testify in front of the United States Congress. Senator John Neely Kennedy mentioned that he agrees to regulate Facebook. Senator John Thrune, meanwhile, said that “the biggest question that Mark Zuckerberg should answer is what Facebook is responsible for what happens on its platform, how it will protect users’ data and how it intends to stop harmful behaviours instead of being forced proactively.”

The problems for the social network are not limited to the attempt to regulate their activity and control of the privacy of information, or to the campaign with the hashtag #DeleteFacebook that has been promoted since the scandal was announced. The price is developing a bearish corrective structure that is testing the long-term trend line. On the other hand, the stock has been below the 200-day exponential moving average, changing the market sentiment to bearish. Structurally, we expect the price to reach $ 149 and could fall between $ 129 to $ 121 as the target level. The closest resistances are $ 162 and $ 167, while the most relevant supports are $ 149 and $ 145.

Dollar Index the weakness remains.

The index of the green ticket continues in a lateral range, with a clear resistance in 90.3, which has not yet been overcome. The key control areas are 89.5 and 89.1, levels that could act as pivots in the medium term. Our long-term vision remains bearish with pending objectives in the area of 87.6 – 86.5.

©Forex.Academy