Categories
Forex Course

163. Trading Currency Crosses Using Fundamentals

Introduction

In fundamental analysis, we can interpret two countries’ economic data of a cross-currency to predict the upcoming price movement. On the other hand, even if we ignore the US dollar, it has some shadow effect on a currency cross.

How to Trade Fundamentals with Currency Crosses

Let’s say Australia’s economic condition is good, and the Reserve Bank of Australia increased the interest rate. As a result, the primary expectation is that the AUD will be stronger against other currencies. On the other hand, we can find other currencies that are facing economic difficulties. Let’s say Eurozone is struggling, and ECB provided some dovish tone to provide an outlook of the current economic condition.

In this situation, we can evaluate the Eurozone’s economic condition and Australia to determine which country is doing well. If Australia shows a better than expected employment report, our first aim would be to buy AUDUSD. However, what happens if the USA showed a strong employment report?

Yes, AUDUSD might consolidate, and the difference between supply and demand would not change. In this situation, it is better to find other currencies that are weaker than in Australia.

Is Fundamental Trading Profitable for Currency Crosses?

In Forex trading, we predict a currency pair’s upcoming movement based on the technical and fundamental analysis. When we see that one currency has reason to become stronger than other currencies, we anticipate the price towards the stronger currency. The fundamental analysis is a process to find a stronger or weaker currency in a currency pair.

Due to having a lot of equity and market participants’ involvement, any fundamental news works well in USD related currency pairs. However, it does not mean trading currency crosses with fundamental analysis is not profitable.

We can quickly evaluate the UK and Japan’s economic conditions to identify the price direction of GBPJPY. Therefore, we can apply the same theory to every currency cross, like AUDJPY, AUDCHF, NZDCAD, or AUDNZD.

Concussion

Fundamental analysis is a process to anticipate the movement of a currency pair based on the two countries’ economic conditions. However, making an analysis ideally is the primary tool to make a profit from the forex market. Therefore, we should focus on money management, risk management, and trade management to get the ultimate trading result.

[wp_quiz id=”86506″]
Categories
Forex Assets

Analysing The CAD/HUF Forex Currency Pair & Determining The Costs Involved

Introduction

The CAD/HUF is an exotic currency pair where CAD represents the Canadian Dollar, and HUF – the Hungarian Forint. In this article, let’s understand some of the basic concepts you should familiarise with before trading the CAD/HUF pair.

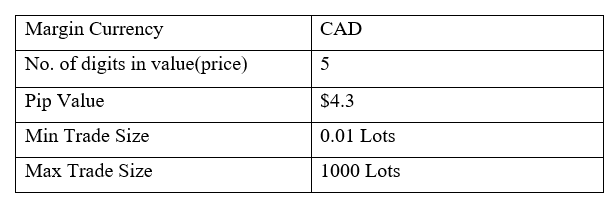
For this currency pair, the CAD is the base currency and the HUF the quote currency. In this case, the price associated with the CAD/HUF pair shows the amount of HUF that 1 CAD can buy. For example, if the price of CAD/HUF is 232.97, it means that 1 CAD can buy 232.97 HUF.

Spread

Spread in the forex market is the difference between buying price, i.e. ‘bid’ and the selling price, i.e. ‘ask.’ The spread for the CAD/HUF is – ECN: 50 pips | STP: 55 pips

Fees

The trading fees you are charged depends on the type of forex account you have. STP accounts carry no trading fee, while for the ECN accounts, the trading fees are determined by your forex broker.

Slippage

In highly volatile trading sessions, sometimes the price at which you trade is different than the price at which that trade will be executed. This difference is called slippage and is usually determined by your broker’s speed of execution.

Trading Range in the CAD/HUF Pair

In the forex market, a currency pair will fluctuate differently across different timeframes. Trading range helps a forex trader analyze how a given pair moves (in terms of pips) over a given timeframe, which is an important risk management tool.

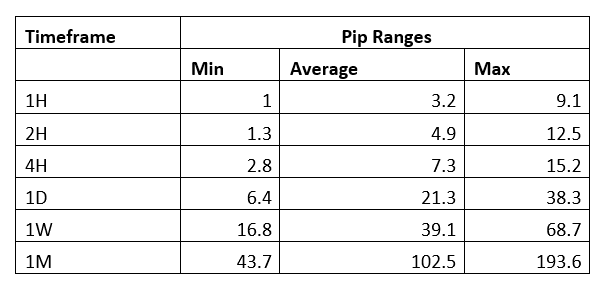
For example, let’s say that during a 1-hour timeframe, the CAD/HUF pair has a trading range of 10 pips. A forex trader trading this pair can expect to gain or lose $43 since the value of 1 pip is $4.3

The table below shows the minimum, average, and maximum volatility of CAD/HUF across different timeframes.

The Procedure to assess Pip Ranges

  1. Add the ATR indicator to your chart.
  2. Set the period to 1
  3. Add a 200-period SMA to this indicator.
  4. Shrink the chart so you can determine a larger period
  5. Select your desired timeframe
  6. Measure the floor level and set this value as the min
  7. Measure the level of the 200-period SMA and set this as the average
  8. Measure the peak levels and set this as Max.

CAD/HUF Cost as a Percentage of the Trading Range

Trading costs that can be expected in forex include slippage, spread, and brokers’ fees. Thus, Total cost = Slippage + Spread + Trading Fee.

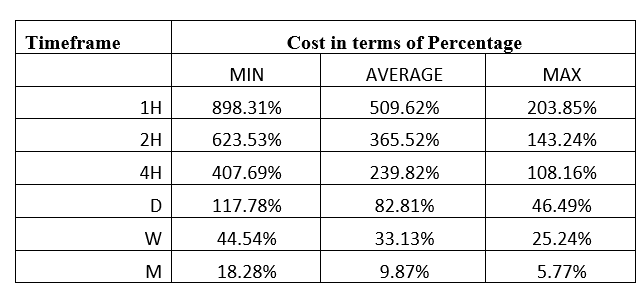
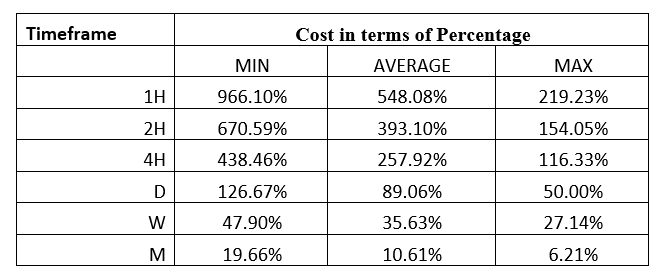
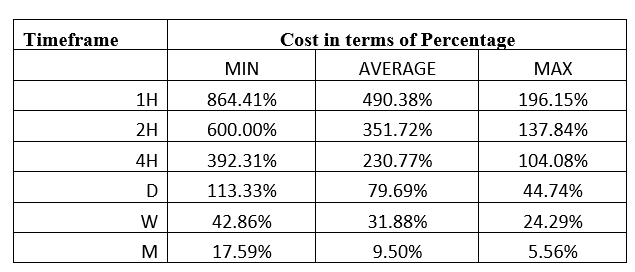
Forex traders should learn how these costs change across different timeframes as the currency pair price fluctuates. The tables below show the percentage costs (in pips) that can be expected when trading the CAD/HUF pair.

ECN Model Account

Spread = 50 | Slippage = 2 | Trading fee = 1

Total cost = 53

STP Model Account

Spread = 55 | Slippage = 2 | Trading fee = 0

Total cost = 57

The Ideal Timeframe to Trade CAD/HUF

With both the ECN and the STP forex trading accounts, the 1-hour timeframes have the highest costs. Therefore, for short-term traders, using the timeframes with minimum volatilities increases the trading costs they will incur. For the 1H, 2H, 4H, and the 1D timeframes, you will incur lower trading costs by trading the CAD/HUF pair when the volatility is above average.

For both types of trading accounts, longer time frames, i.e., the weekly and the 1-month, offer lesser trading costs for the pair. It is worth noting that forex traders can minimize their costs by using limit order types, which eradicate the risks of slippage. Here’s an example with the ECN account.

Total cost = Slippage + Spread + Trading fee

= 0 + 50 + 1 =51

You can notice that when the cost associated with slippage is removed, the overall costs for trading the CAD/HUF pair significantly drops. The highest cost reduces from 898.31% to 864.41%.