Description
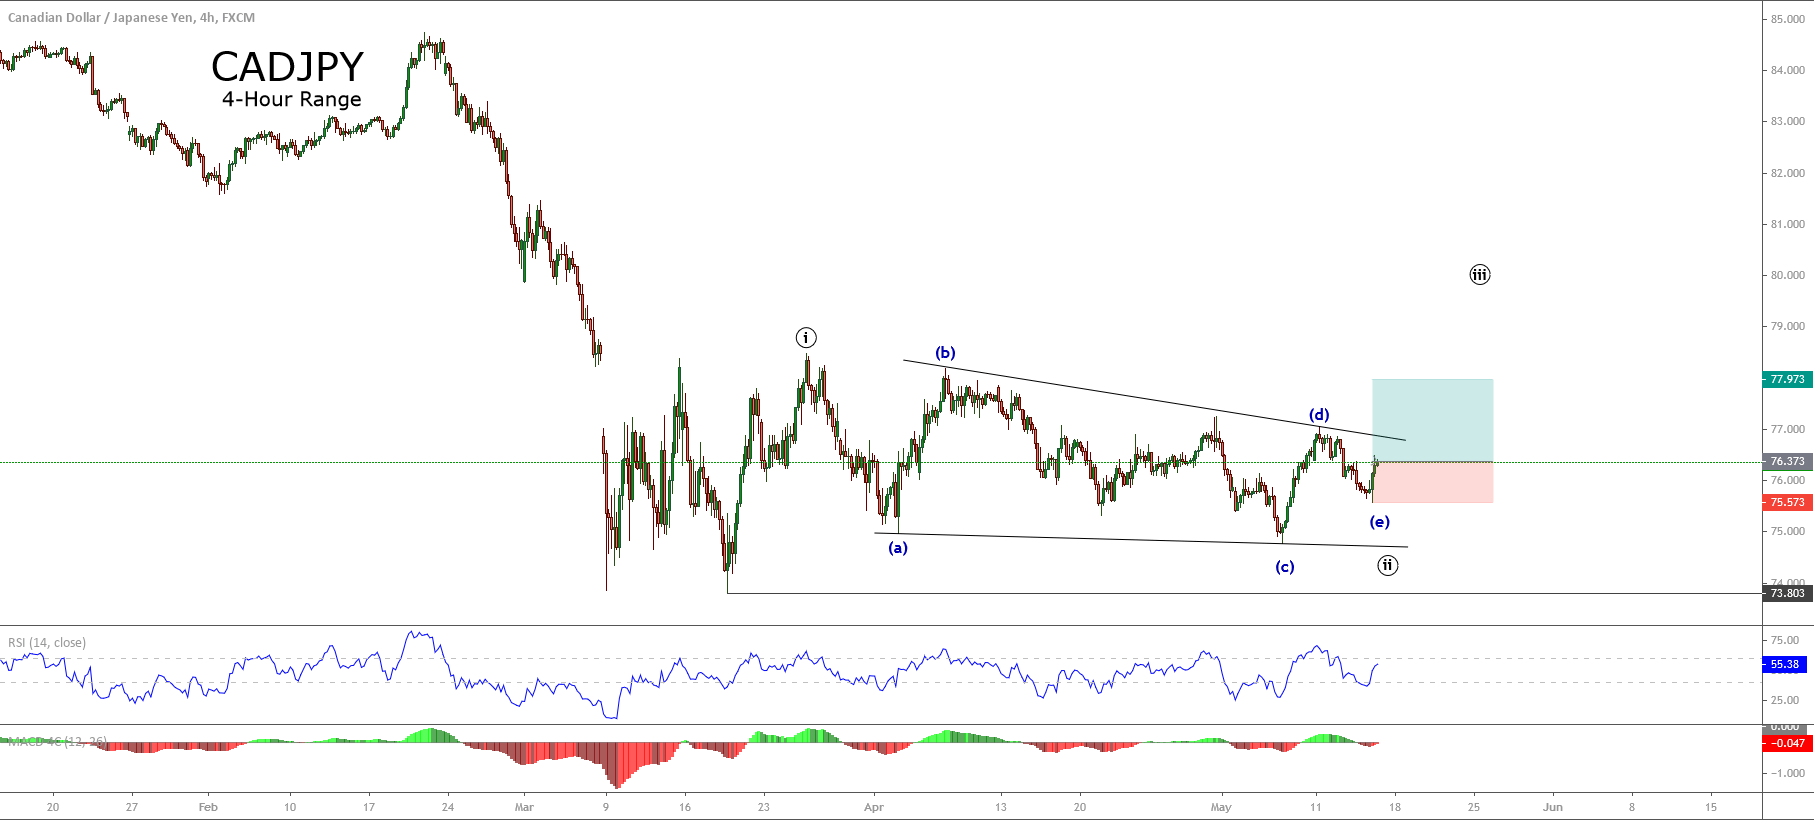
The CADJPY cross, in its 4-hour chart, shows a triangle pattern that should continue the upward movement of the previous impulsive move in the following trading sessions.
The Elliott wave perspective of CADJPY reveals the price action is running in a descending triangle, which could be ended its wave (e) of the Minuette degree labeled in blue. At the same time, CADJPY should be ending its wave ((ii)) of Minute degree in black.
The upward movement developed in the Thursday trading session, warns us that CADJPY could resume its advances in a wave ((iii)) of Minor degree.
Our bullish scenario considers an upside entry from the current zone at 76.373. In a conservative outlook, we expect a potential profit target at 77.973.3
Finally, the upward scenario will be invalid if the price action declines below 75.573.
Chart
Trading Plan Summary
- Entry Level: 76.373
- Protective Stop: 75.573
- Profit Target: 77.973
- Risk/Reward Ratio: 2
- Position Size: 0.01 lot per $1,000 in trading account.