Introduction
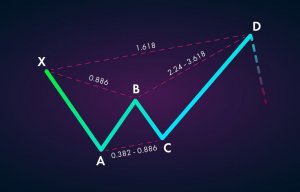
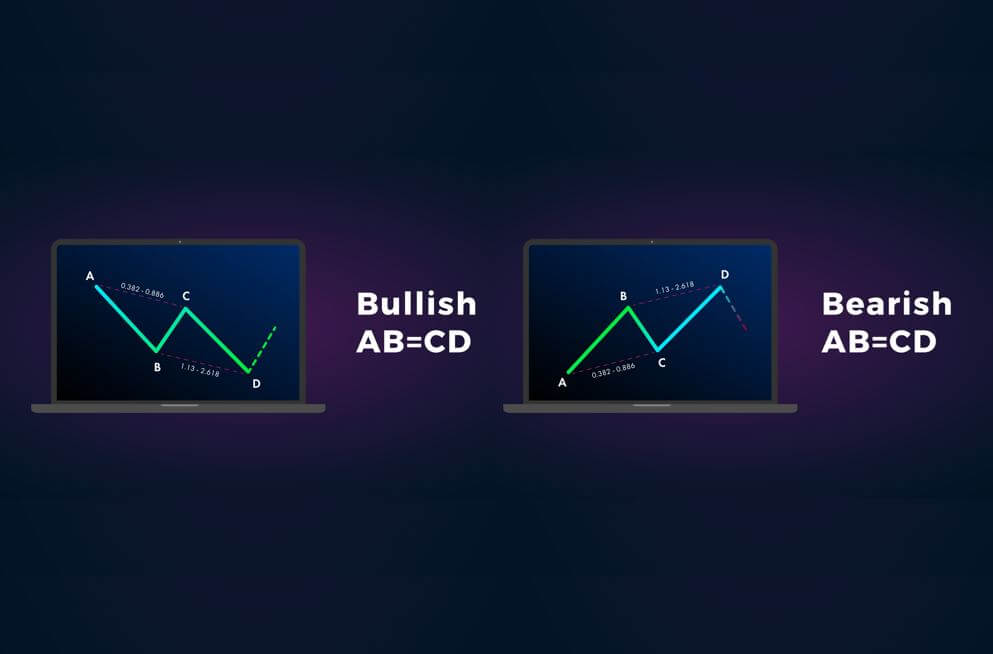
The ABCD is one of the most straightforward patterns in the Harmonic lot. There are two types of ABCD patterns – Bullish AB=CD & Bearish AB=CD. For both the bearish and bullish versions, the AB and CD lines are the legs, whereas the BC line is considered the Retracement or correction. To confirm the formation of this pattern, we use Fibonacci levels that we have discussed in the previous course lessons.

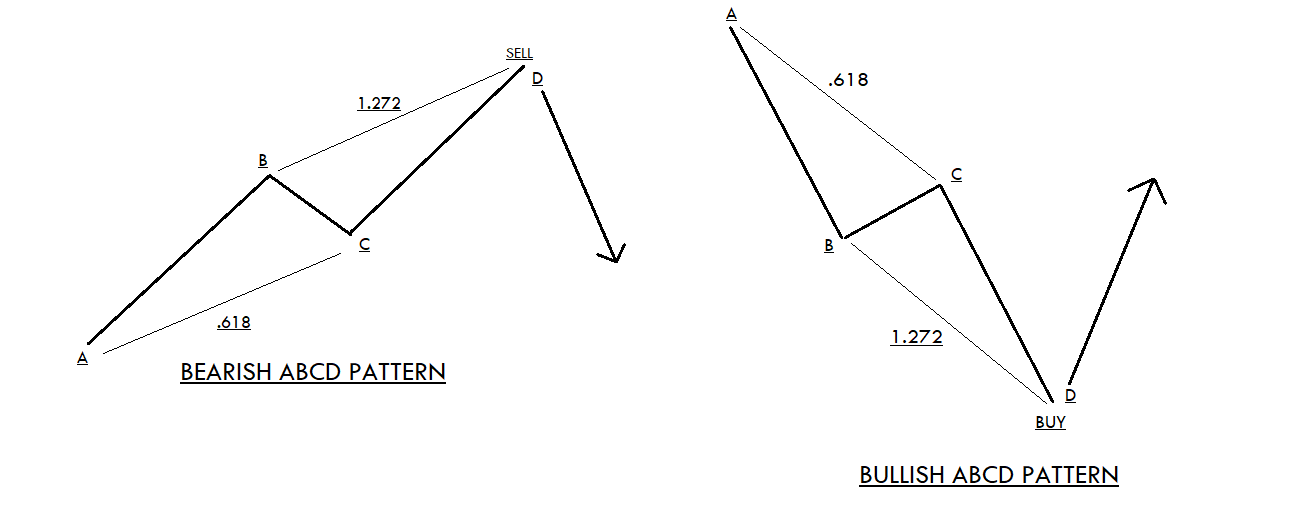
By using the Fibonacci tool on leg AB, see if the BC retracement is reaching the 0.618 level. Next, the line CD should be the extension of 1.272 Fibonacci extensions of BC. This rule applies to both bearish and bullish AB=CD patterns. We go long or short when the price action reaches the point D of the corresponding pattern formed.
How To Trade The ABCD Harmonic Pattern
Bullish ABCD Pattern
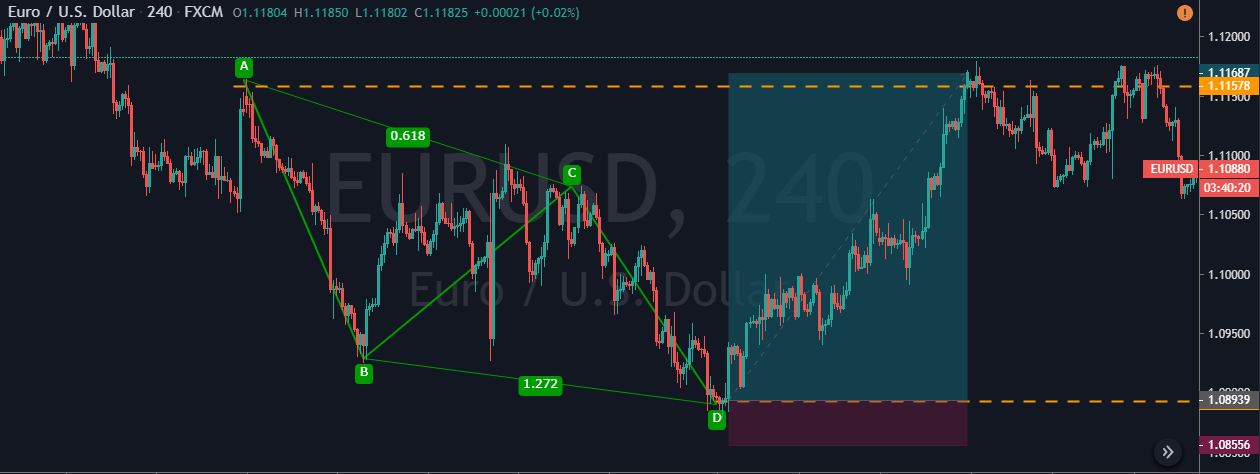
The chart that you see below represents the formation of a bullish AB=CD pattern. The CD leg of the pattern is equal to the size of the AB leg. The BC move, which is a pullback, is 61.8% retracement of the AB move. Likewise, the CD move is the 127% retracement, which confirms the formation of a bullish AB=CD pattern on the EUR/USD Forex pair.
We have entered the market at point D, and the stop-loss is placed just below the D point. As you can see, we went for smaller stops, and there is a reason behind it. If the price action goes below point D, the pattern automatically gets invalid.
There are two take-profit areas in the pair. The first one is at point C, and the second is at point A. It all depends on at what point you desire to close your position. It is always advisable to close your positions at higher targets because the end goal for us is to milk the market as much as we can.
Bearish ABCD Pattern
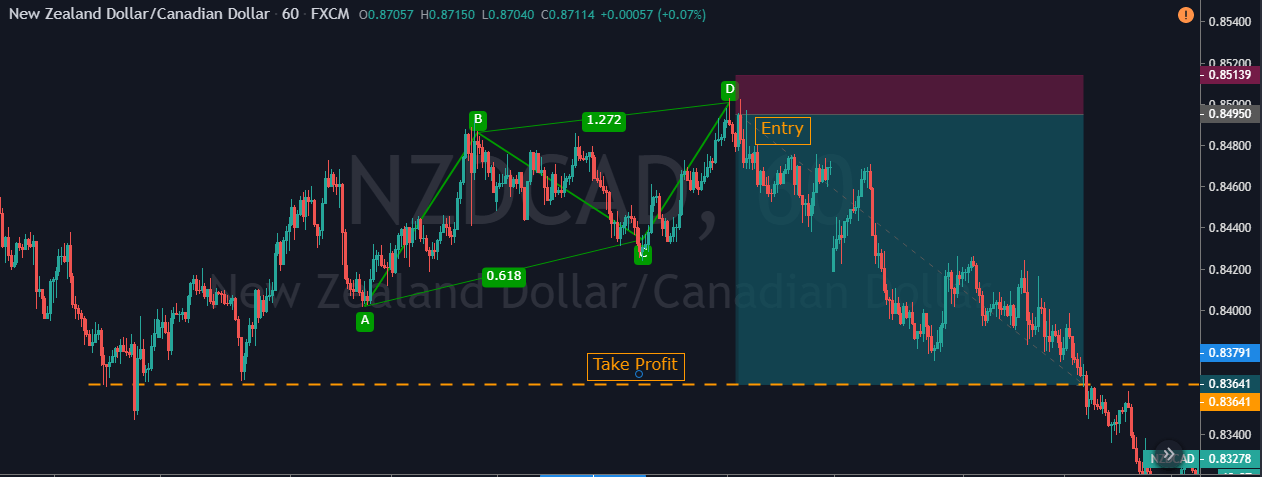
The below NZD/CAD Forex pair represents the formation of a bearish AB=CD pattern. The AB leg of the pattern is equal to the CD leg. Furthermore, the BC is respecting the 61.8% retracement of the AB move, and the CD move was close to 127% extension of the BC move. We have gone short at point D as the price breakout happened.
In this example, we went for deeper targets. If the momentum of the prevailing trend is strong enough, going for a new lower low will be a good idea. The key to winning in trading is to follow the rules and think according to the market situation. These Harmonic patterns require a lot of patience and effort to trade. So it is strongly recommended to master this pattern in a demo account than to trade it in a live market.
Conclusion
The AB=CD is a reversal pattern that indicates the market trend reversal. The AB=CD pattern consists of three legs, and they form the zig-zag shape. This pattern is also known as a lightning bolt, as it looks like one. The AB=CD pattern can be used in any financial market and also in any trading timeframe. Follow the rules, no matter what, to make consistent profits from this pattern. Always execute your trade at point D and ride for the brand new higher high/lower low. Cheers. [wp_quiz id=”76393″]