pattern trading in cryptocurrencies (Head and Shoulders, Triangles, Wedges) – part 2/2
This part of the guide will cover various triangle formations as well as wedges.
Triangles
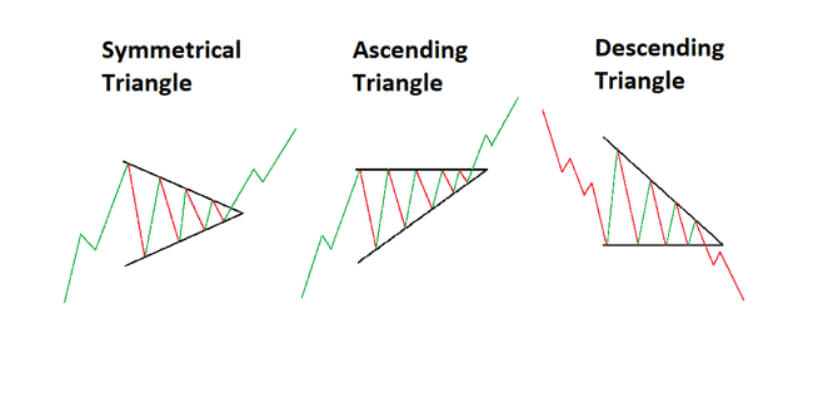
Triangles come in three formations:
Ascending triangle
Descending triangle
Symmetrical triangle
Ascending triangle
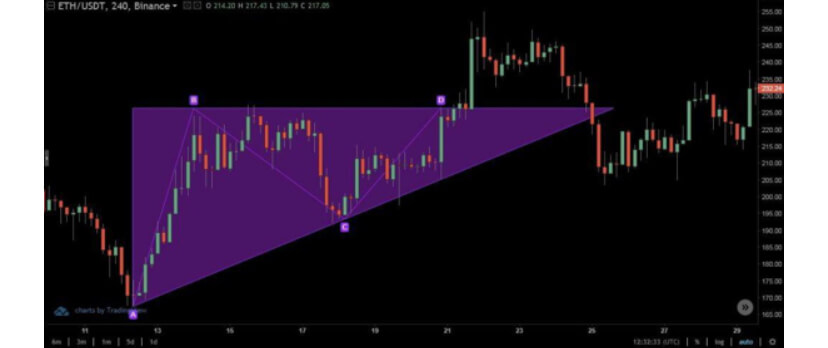
Traders can spot an ascending triangle by the price going up and down between the constant line of resistance and the rising support.
The ascending triangle is widely considered to be a bullish formation, which leads to massive profits if approached the right way.
However, those not careful enough might consider taking a position near the support line in hopes of enhancing their gains, only to end up with a loss as formation didn’t complete, and the price movement turns to be a double or triple top bearish formation.
Targeted prices are measured by the widest distance between the highs and the lows, and applied up from the point of the breakout.
Experienced traders will wait for a confirmation of the upward breakout accompanied by a much bigger volume before taking a position, as breakouts without an increase in volume can catch traders in a bull-trap (as we showed on the chart).
Descending Triangle
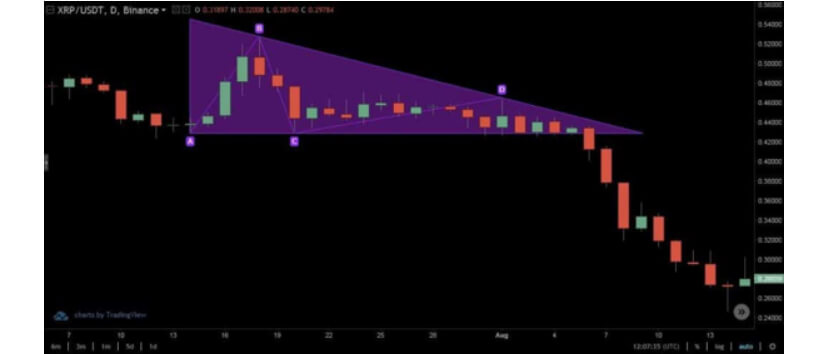
A descending triangle is considered a typical bearish formation. For it to form, the price action needs to flow between a steady support line and descending resistance.
The pattern is confirmed only once a downward breakout with increased volume happens. Only then can a trader expect the continuation of the price movement to the downside.
Just like with ascending triangles, the price target is equal to the widest swing inside the triangle transferred from the breakout point to the downside.
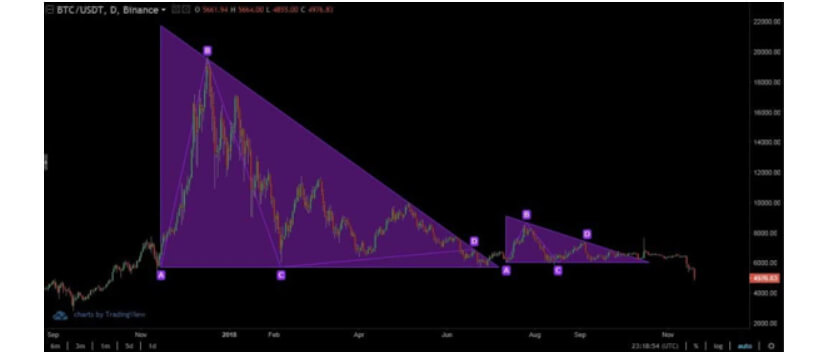
One of the most famous descending triangles in cryptocurrencies is the one that formed on the 2018 Bitcoin chart.
Symmetrical triangle
These triangles are probably the most common formations in cryptocurrency trading. However, at the same time, they are the most unpredictable.
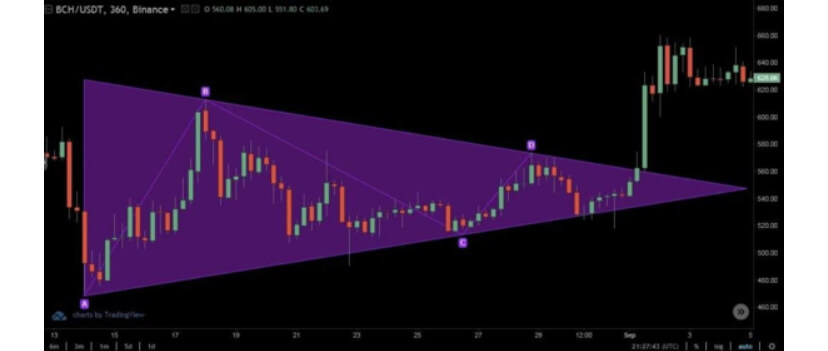
As the symmetrical triangle approaches its closure, the trading volume drops as traders are often indecisive about whether the price will unfold to the upside or downside. When the war between the bulls and the bears resolves, we get two outcomes: positive and negative.
Any of these breakout movements will be followed by an increase in volume, which will be even more visible due to the reduced trading volume before the breakout.
Once the breakout happens, traders can expect the target price to be the same distance as the distance between the breakout side and the base of the triangle.
Wedges
Wedges are very common formations in crypto trading as well. They are considered a multiple price wave reversal patterns.
The price action in a wedge swings from highs to lows multiple times before breaking out of the pattern.
Wedge formations come in two forms:
Rising wedges
Falling wedges
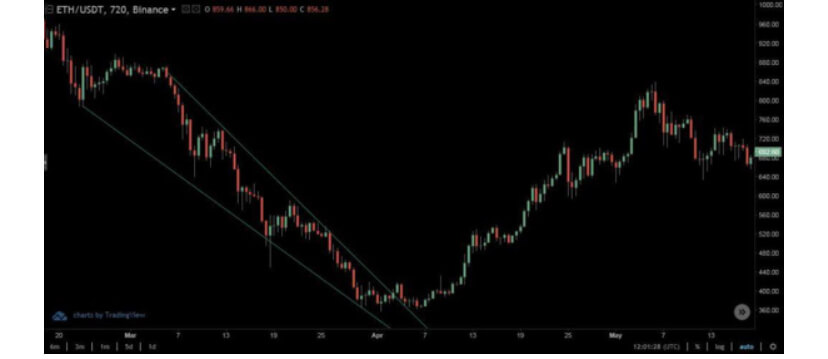
Rising wedge
As opposed to the ascending triangle formation, the rising wedge has price swings that travel through highs and lows, but both the highs and lows are getting higher. This formation announces a bullish trend reversal into a strong bearish sentiment.
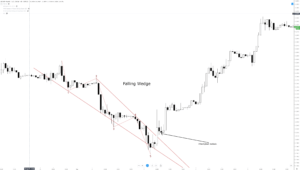
Falling wedge
The falling wedge formation, on the other hand, looks like a mirror image of the rising wedge and announces a trend reversal from bearish to bullish.
As with other patterns, it is advisable for traders to get the confirmation of the breakout before taking a position.
The minimum targeted price for the falling wedge is the exact opposite of the ascending wedge.
One thing to notice is that, in the cryptocurrency market, peaks do not necessarily follow highs and lows in an exact straight line. They are rather just close enough in the price range to mark the formation.