Description
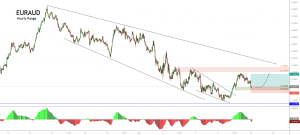
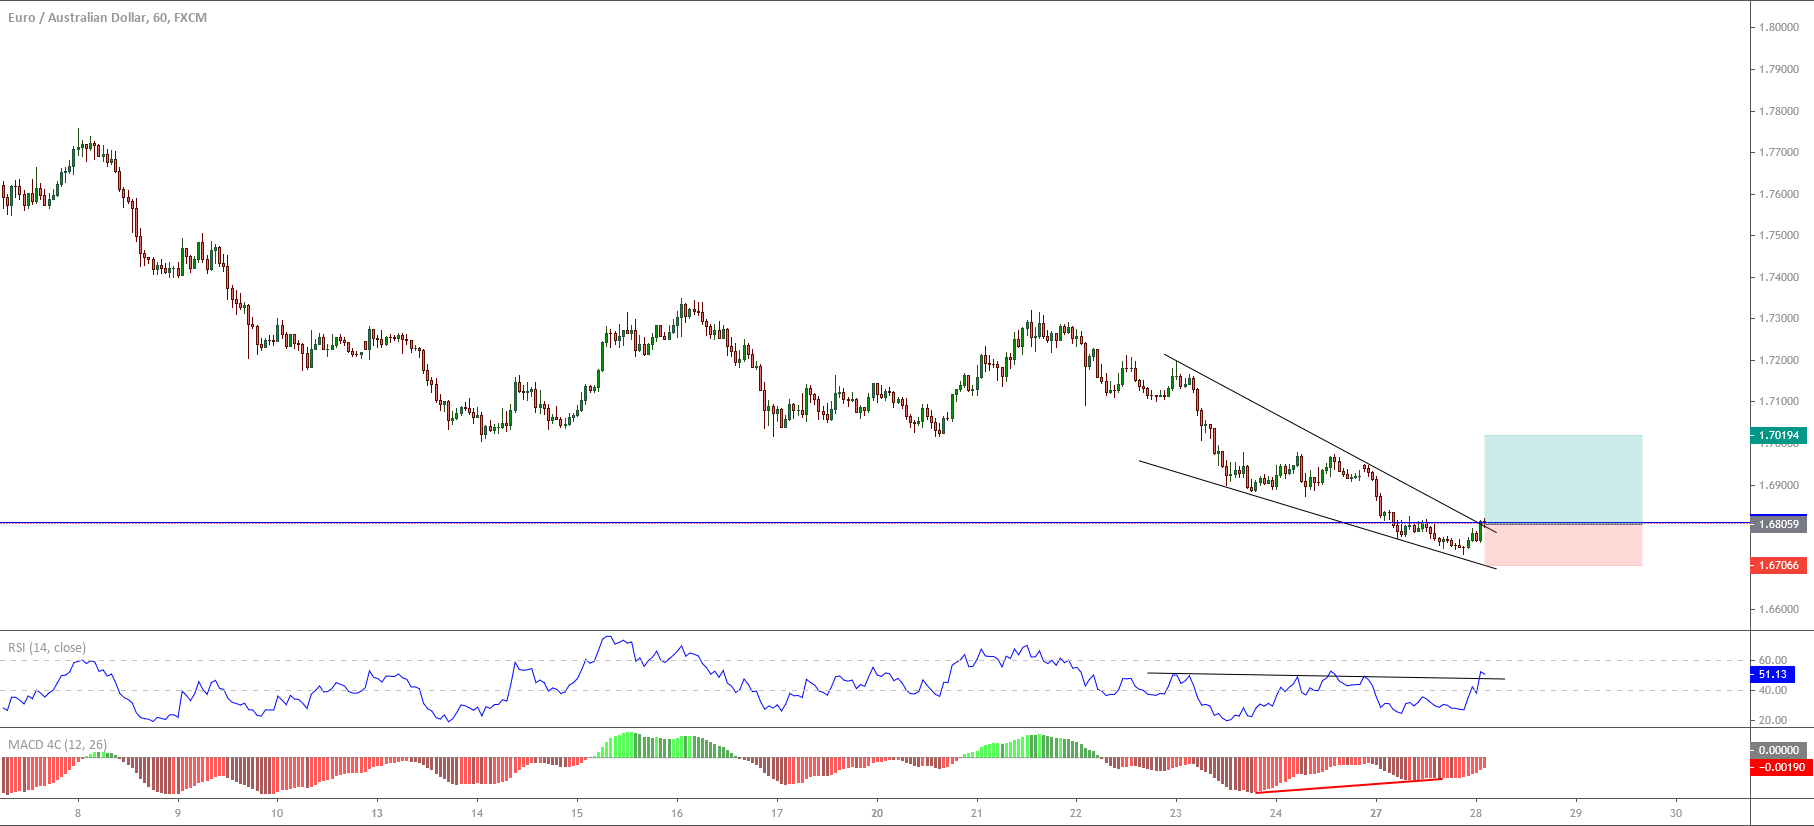
The EURAUD cross, in its hourly chart, shows a falling wedge chartist pattern, which could be ending due to the price action soars above the upper line of the descending formation.
The falling wedge is a terminal formation that suggests the end of the trend, and in consequence, the possibility of the change of the market bias.
On the other hand, the oscillators RSI and MACD shows exhaustion signals of the bearish trend in progress. In the same way, RSI exposes a breakout signal, suggesting the probability of a new bullish movement.
If the price action confirms the bullish breakout, the EURAUD cross may soar until level 1.7019. The level that invalidates our bearish scenario locates at 1.6706.
Chart
Trading Plan Summary
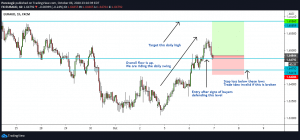
- Entry Level: 1.6805
- Protective Stop: 1.6710
- Profit Target: 1.7018
- Risk/Reward Ratio: 2.24
- Position Size: 0.01 lot per $1,000 in account.