Description
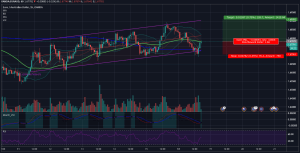
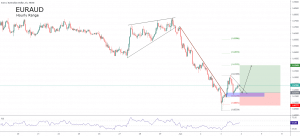
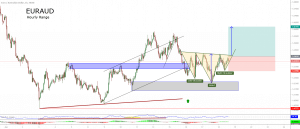
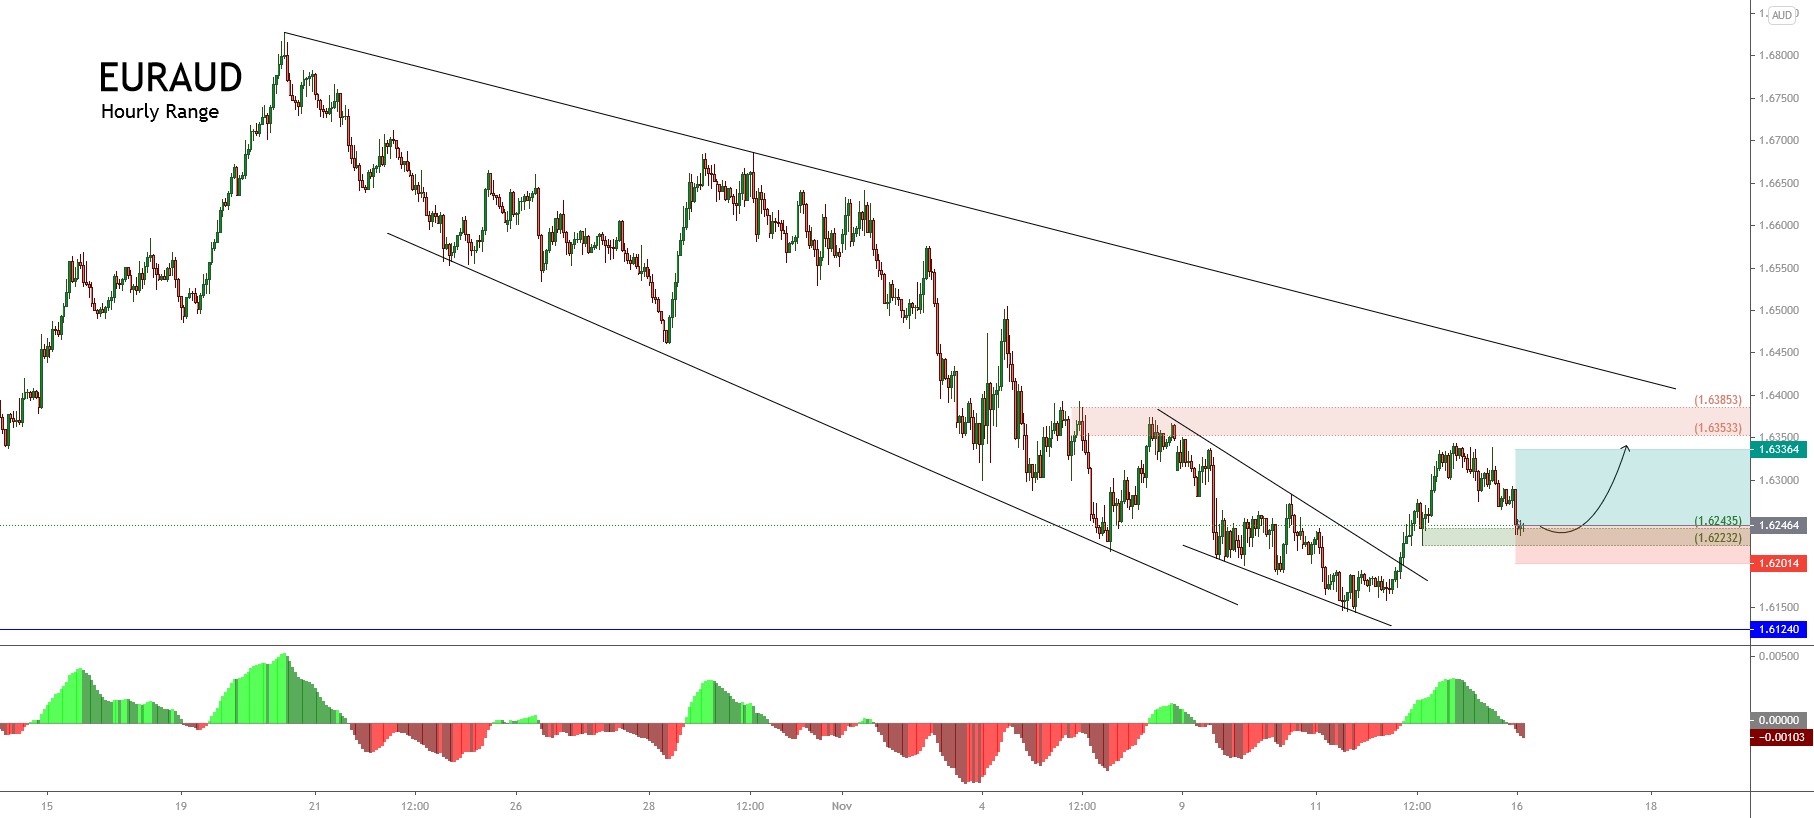
The EURAUD cross in its hourly chart exposes the corrective movement after the intraday descending wedge pattern breakout occurred during the past week. In this context, the upward move looks like a bullish impulsive move, which retraced until the demand zone is located between 1.62435 and 1.62232.
According to the classic technical analysis, a descending wedge’s bullish breakout tends to imply a bullish reversal move.
In this context, the bullish scenario foresees the bullish continuation, at least at the top of the previous impulsive move located at 1.63364. Nevertheless, the price could extend its gains to the next supply zone, situated between 1.63533 until 1.63853.
The invalidation level of the bearish scenario locates at 1.62014. In this regard, if the price extends its drops below 1.62014, it could be indicative of further declines, which could visit the level 1.60.
Chart
Trading Plan Summary
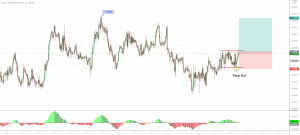
- Entry Level: 1.62464
- Protective Stop: 1.62014
- Profit Target: 1.63364
- Risk/Reward Ratio: 2.0
- Position Size: 0.01 lot per $1,000 in trading account.
Check out the latest trading signals on the Forex Academy App for your mobile phone from the Android and iOS App Store.