Description
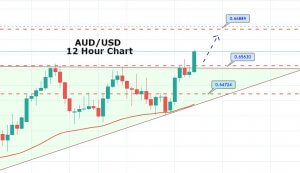
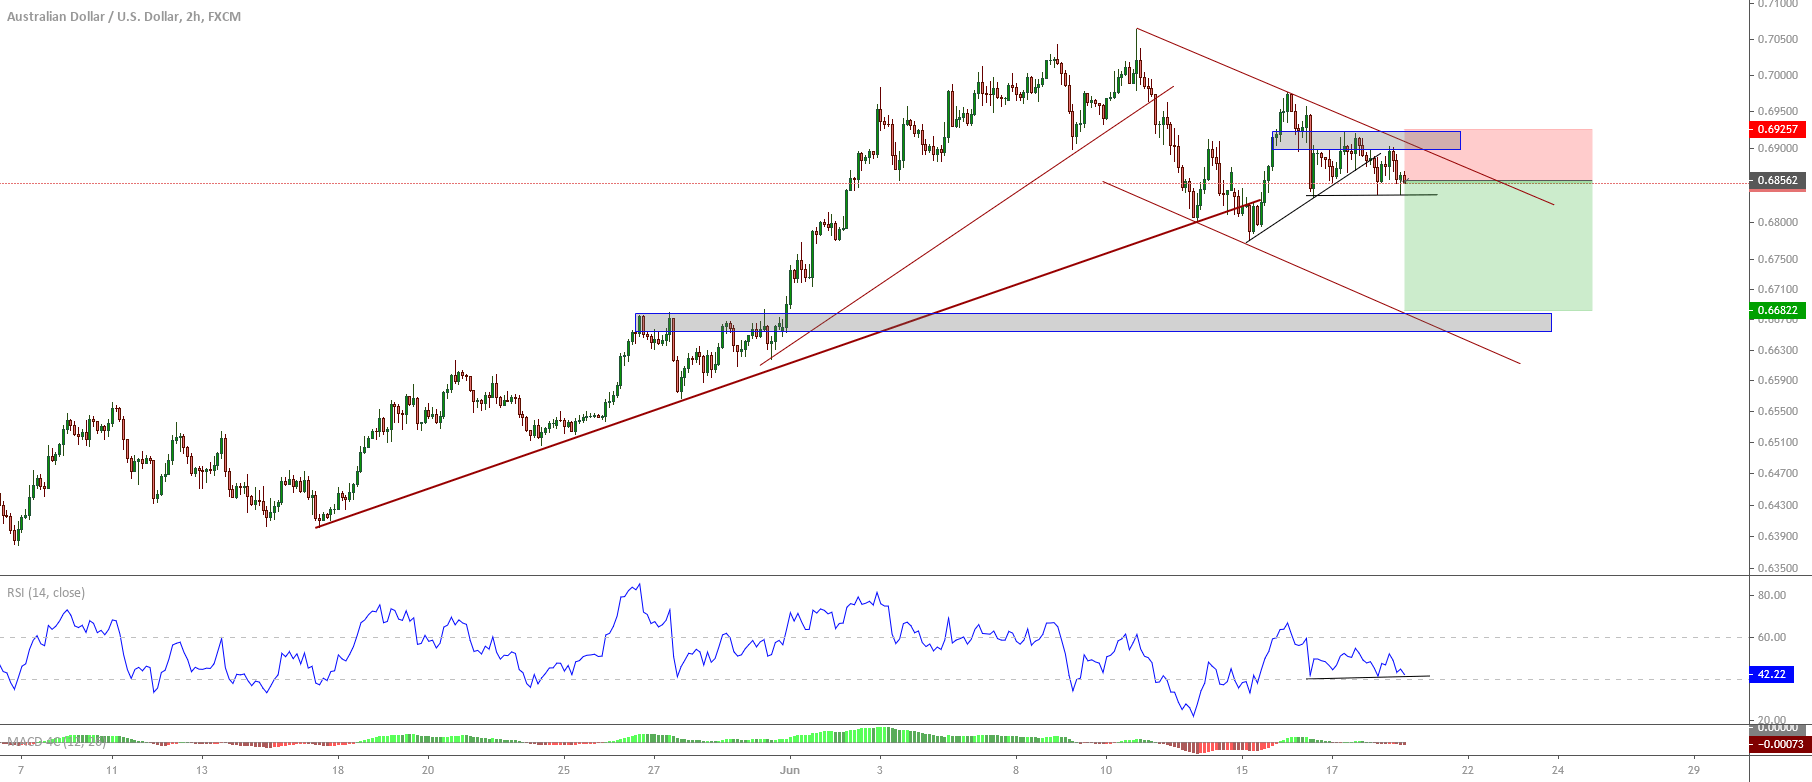
The AUDUSD pair in its 2-hour chart exposes a corrective descending structure, which began once the Aussie topped at 0.7064 on June 18th.

The Aussie Dollar started a rally on May 15th when the price found fresh buyers at 0.6402. The accelerated movement experienced by the pair looks like an extended wave. Once the price action topped at 0.7064, the AUDUSD pair started to move mostly downward, breaking below the accelerated trendline and fell until the mid-term trendline. After this decline, the recovery realized a lower high, which carries us to project a descending trendline.
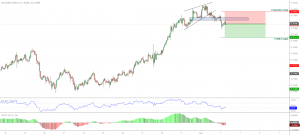
On the other hand, the RSI oscillator reflects a drop until level 22.18, corresponding to the breakdown that the Aussie developed once topped at 0.7064. The RSI reading leads us to observe that the price should be entering on a bearish cycle.
For the following trading sessions, we expect further declines, which could visit the area of 0.6682, corresponding to the next swing high developed by the AUDUSD pair. The invalidation level of our bearish scenario locates at 0.6927.
Chart
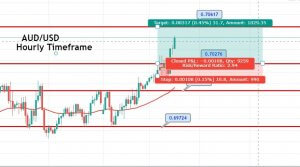
Trading Plan Summary
- Entry Level: 0.6858
- Protective Stop: 0.6927
- Profit Target: 0.6683
- Risk/Reward Ratio: 2.5
- Position Size: 0.01 lot per $1,000 in trading account.