Categories
Forex Daily Topic Forex Fundamental Analysis

Everything You Need To Know About The ‘Jobs to Applications Ratio’

Introduction

For any economy, one of the best indicators of health in the labor market is how quickly the unemployed get absorbed into the job industry. This would indicate if the current economy is expanding at par with the growing number of job seekers. Apart from showing the absorption rate in the job market, it can also be used as a coincident economic indicator.

Understanding Jobs to Applications Ratio

The jobs to applications ratio help to put into perspective the number of job vacancies available vs. the number of job applications made during a particular time.

The job vacancies, in this case, represents the totality of the existing Job Vacancies from the previous reporting period that haven’t been filled and the new vacancies in the current period. For example, the total job vacancies for October 2020 would include the unfilled vacancies from the previous months in 2020 and the vacancies that became available in October 2020. The number of job applications does not necessarily need to be those that directly applied for these vacancies. This number is the totality of job seekers who have registered with employment bureaus across the country seeking employment.

Therefore, the formula of the jobs to applications ratio is 

When the number of active job openings is higher than that of active job seekers, the jobs to applications ratio will be higher than 1. Furthermore, the jobs to applications ratio will increase if the number of job openings increases faster than that of active job seekers. Conversely, if the number of active job seekers is higher than that of active openings, the jobs to applications ratio will be lower. Similarly, when the number of active job seekers grows at a faster pace than that of active job openings, the jobs to applications ratio will decrease at a rapid rate.

In most countries, the number of graduates from tertiary academic institutions is usually high. For this reason, most jobs to applications ratio reports usually exclude new school graduates and part-time job seekers. The primary reason for doing this is to smoothen the data since it is not expected that the labor market will absorb all graduates.

Using Jobs to Applications Ratio in Analysis

The Jobs to Applications Ratio shows the health of the labor market and is also a coincident indicator of economic growth. The best way to use the jobs to applications ratio in the analysis is by viewing it as a time series. It will enable you to compare the change in the economy over time easily.

To understand the implication of the Jobs to Application Ratio, we must first understand how job openings and unemployment come about. When the economy is expanding, the unemployment levels go down. An expanding economy is mainly driven by an increase in demand in the economy. Usually, household demand is the primary driver of the increase in aggregate demand.

When the aggregate demand rises, producers of goods and services must also scale up their operations to take advantage of the increasing demand and to avoid distortion of equilibrium price. When they expand their operations, they will need to hire more workers; this is where the unemployment levels go down. Also, note that when the unemployment rate reduces, it means that households’ expenditure increases, which also leads to the expansion of the economy. It is a feedback loop.

It also means that when the economy is contracting, it is a sign of a decrease in aggregate demand. This decrease force producers of consumer goods and services to cut back their production, which results in fewer job openings and increased unemployment.

Now let’s see what jobs to application ratio has to do with all this. When the Jobs to Applications Ratio is increasing over time, it implies that the number of active job openings is growing faster than that of the active job seekers. If, for example, the jobs to applications ratio has been increasing steadily over the past couple of months or years, it would mean the economy has been expanding. This increase shows that increasingly more jobs have been created in the economy.

Alternatively, it could mean that the rate of job retention in the economy is higher since fewer people lose their jobs and begin seeking employment all over again. Conversely, when the Jobs to Applications Ratio is continually decreasing, it means that the economy is contracting and the economy is creating fewer jobs. It could also mean that more jobs are lost in the economy hence the higher number of new job seekers.

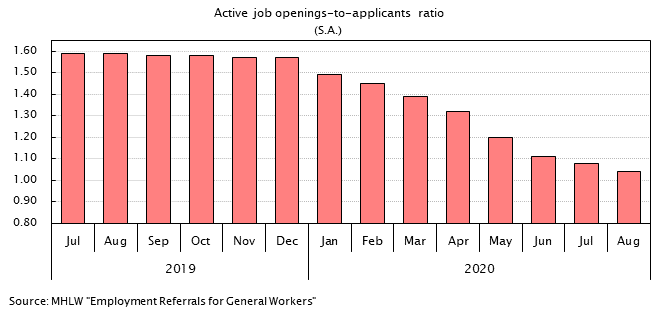
The Jobs to Applications Ratio can also show the business cycles and periods of recession and expansion in the economy. When the Jobs to Applications Ratio continually drops, it implies that the economy has been contracting over an extended period with a growing number of unemployed in the economy. This is a clear sign of economic recession. In Japan, for example, the persistent drop in the job to application ratio coincided with the coronavirus-induced recession of the first half of 2020.

Source: Japan Institute for Labour Policy and Training

In times of economic recovery, businesses are presumed to gradually increase their operations, which means that the jobs to applications ratio will steadily increase.

Impact of Jobs to Applications Ratio on Currency

The value of the currency fluctuates depending on the perceived economic growth. Thus, the direct impact that jobs to applications ration has on currency is its inherent ability to show economic expansions and contractions.

The domestic currency will be expected to appreciate when the jobs to applications ratio increases. The increase in the jobs to applications ratio shows that the economy has been growing hence improved living standards.

Conversely, the domestic currency will depreciate when the jobs to application ratio are steadily decreasing. The continual decrease shows that the domestic economy has been contracting.

Sources of Data

In Japan, the Japan Institute for Labour Policy and Training is responsible for conducting surveys of the Japanese labor market. The institute publishes the data on Jobs to Applications Ratio monthly.

Trading Economics has a historical review of the Japanese jobs to applications ratio.

How Jobs to Applications Ratio Release Affects The Forex Price Charts

The Japan Institute for Labour Policy and Training published the latest jobs to applications ratio on October 2, 2020, at 8.30 AM JST. The release is accessed from Investing.com. Moderate volatility is expected on the JPY when the data is published.

In August 2020, the jobs/applications ratio was 1.04 compared to the 1.08 recorded in July 2020. Furthermore, the August ratio was less than the analysts’ expectations of 1.05.

Let’s see how this release impacted the JPY.

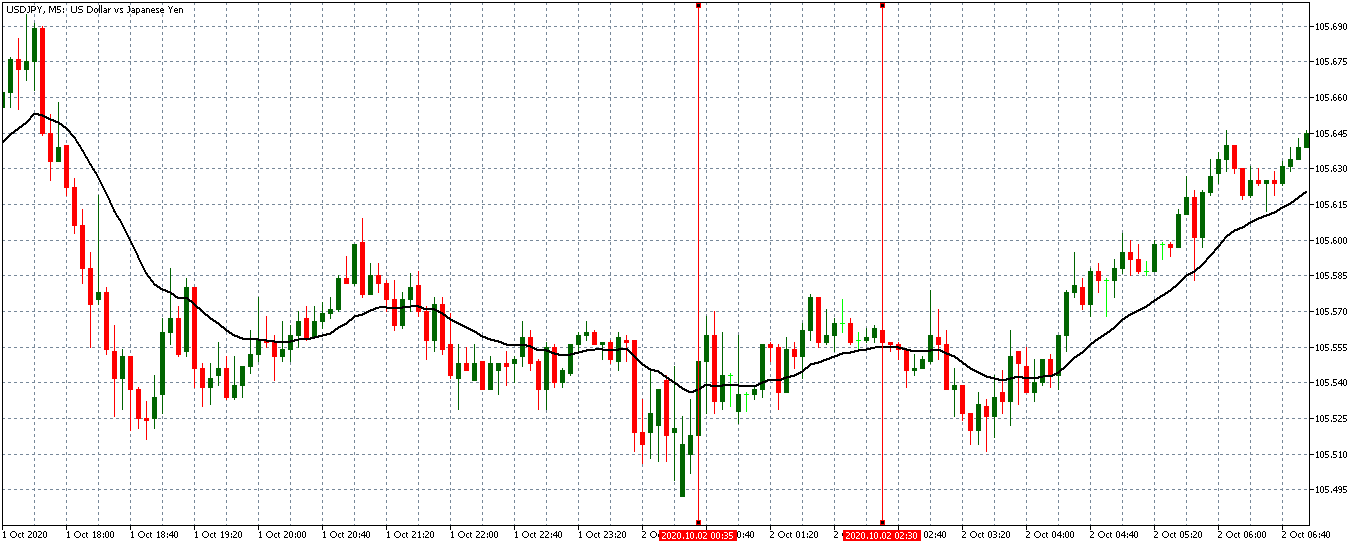
USD/JPY: Before Jobs to Applications Ratio Release on October 2, 2020, 
just before 8.30 AM JST

Before the release of the ratio, the USD/JPY pair was trading in a subdued uptrend. The 20-period MA was only slightly rising.

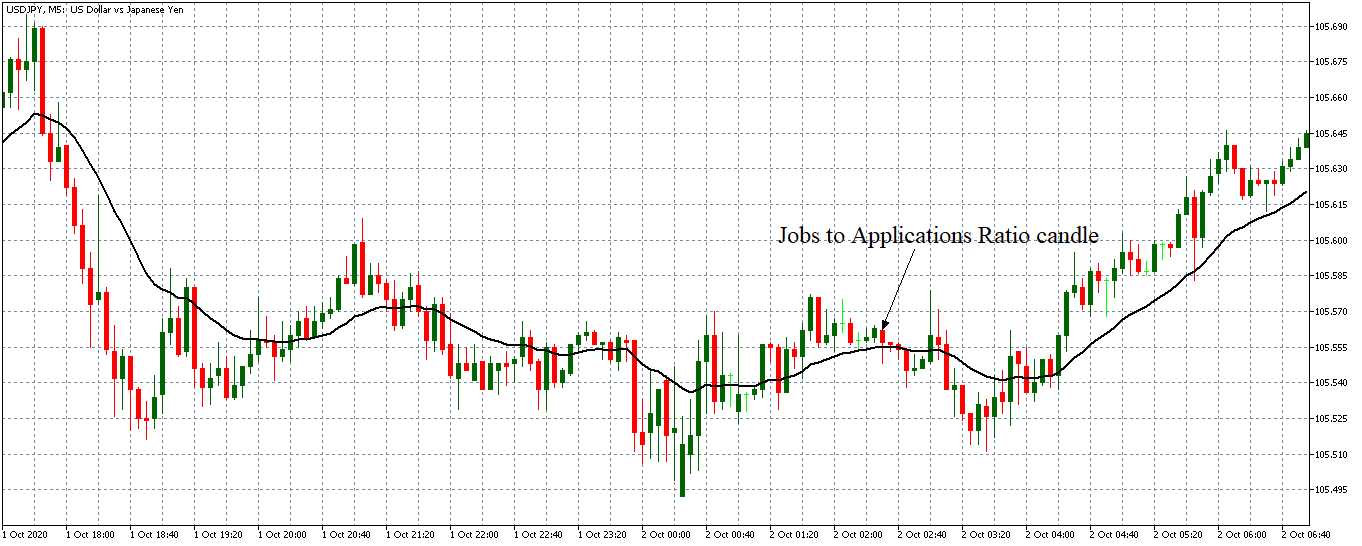
USD/JPY: After Jobs to Applications Ratio Release on October 2, 2020, 
at 8.30 AM JST

The pair formed a 5-minute bearish “hammer” candle immediately after the release of the ratio. Subsequently, it traded in a neutral pattern before adopting a bullish trend.

Bottom Line

The Jobs to Applications Ratio plays a significant role in establishing the health of the labor market. However, in the forex market, the unemployment rate is the most-watched economic indicator when it comes to the health of the labor market.

Categories
Forex Fundamental Analysis

Impact of ‘Employment Rate’ Economic Indicator On The Forex Market

Introduction

Employment is crucial for consumer spending, which makes more than two-thirds of the GDP for many countries. Understanding the employment rate and the cascading effect it has on the economy is paramount for fundamental analysis. The factors affecting the employment rate and business cycle patterns all inherently impact economic growth and currency valuation. Hence, understanding employment as an economic indicator will strengthen our analysis.

What is Employment Rate?

Employment Rate:  It is defined as the ratio of employed to the total available labour force. Here the labour force is defined as the sum of employed and unemployed persons. It is also considered as a measure of the extent to which the labour force is being used.

Unemployment is a state where an individual is actively searching for employment but cannot find work.

Unemployment Rate: It is defined as the percentage of unemployed people to the available labour force. It is the other half of the employment rate. Employment and unemployment rate combined should yield results as 100% as it equals the total available labour force.

How can the Employment Rate numbers be used for analysis?

Employment and unemployment can be considered as the two sides of the same coin. We can derive our fundamental conclusions from either direction. Employment Rate is essential for our analysis because it has a direct and cascading impact on consumer spending. In the US, consumer spending accounts for about 70% of the total GDP.

A high employment rate indicates that more people in the labour force have income that they can spend on purchasing goods and services. When consumer spending is on the rise, businesses flourish, leading to better wages, or even more employment. Overall, employment in one sector has an indirect positive effect on dependent sectors and a direct positive effect on the economy.

The Government is also politically committed to ensuring a low unemployment rate; otherwise, citizens will not favour them in the next elections. By providing proper support to local businesses, the Government can increase employment in the short run.

A high unemployment rate is very damaging to the economy. As more people are unemployed, there is a direct negative effect on consumer spending. In this scenario, also the cascading effect works and makes the situation worse. It also hurts the employed people.

Increased unemployment in the economy can bring down the employed morale, making them feel guilty for being employed while their colleagues are unemployed. It can also make employed people feel less secured and discourage their spending habits, and they may end up saving for a rainy day. Employed people may feel lucky enough to have a job that inhibits them from applying for better opportunities amid high unemployment.

Employment and Unemployment rates can also help investors to keep a pulse on the health of the economy. Overall it is essential to make sure the employment rate is always high and does not take a dip. Even when the unemployment rate rises linearly, it has an exponential impact on economic growth, and hence the central authorities try to avoid it at all times.

It is also essential to understand that employment rates are sensitive to business cycles in the short run. Hence, seasonally adjusted versions of the same are more useful for analysis. In the long run, the employment rates are significantly affected by government policies on higher education and income support. Policies that focus on the employment of women and disadvantaged groups also help increase the employment rate.

Both developing and underdeveloped countries’ governments have to focus on education policies and employment opportunities for their labour force if economic growth is the primary concern. Literacy and higher education in underdeveloped and developing nations have helped the economies grow stronger year-on-year.

Employment rates are coincident indicators and can also be used to predict or confirm oncoming recessionary or recovery periods, if any. The onset of a recession is accompanied by a massive unemployment rate or decreased employment rates. Hence, despite the propaganda of the media and Government, we can use employment data actually to confirm whether the economy is growing or stagnating. Accordingly, during recovery periods, employment rates start on a recovery trajectory back to its previous normal.

Impact on Currency

As an increase in employment rate points towards a growing economy, a high employment rate is good for the GDP and the currency. Hence, the employment rate is a proportional coincident indicator. An increase or decrease in employment rate is suggestive of improving or deteriorating the economy, respectively.

The forex market watches the unemployment rate more closely than the employment rate itself. Significant changes in the employment rate or the unemployment rate tend to have a considerable impact on market volatility. Still, generally employment rate in itself is a low impact indicator compared to the unemployment rate.

Employment change, initial jobless claims also precede unemployment rates, and the desired effects are already factored into the market before the employment rates are released. Hence, overall it is a low impact indicator.

Economic Reports

In the United States, the BLS surveys and tracks monthly employment and unemployment within the country. It classifies them based on geography, sex, race, industry, etc. The Employment Situation report is also published by the BLS, and it goes as far back as the 1940s. It is released by BLS on the first Friday at 8:30 AM Eastern Standard Time every month.

Sources of Employment Rate

The US BLS publishes monthly employment and unemployment reports on its official website. We can also find the same indexes and statistics of various categories on the St. Louis FRED. We can also find employment rate statistics published by the OECD countries here. Consolidated reports of employment rates of most countries can also be found in Trading Economics.

How Employment Rate News Release Affects The Price Charts

As we have already established, an increase or decrease in the employment rate can be used to gauge whether the economy is performing well or poorly. For forex traders, it is therefore imperative to understand how the news release of this macroeconomic indicator will impact the price action on various currency pairs.

In the US, employment reports are released monthly, usually on the first Friday after the month ends. The latest, expected, and all historical figures are published on the Forex Factory website. We can find the most recent release here. Below is a screengrab of the US unemployment rate from the Forex Factory website. On the right, we can see a legend that indicates the level of impact the Fundamental Indicator has on the corresponding currency.

As shown, the unemployment rate is a high impact indicator. The snapshot below shows the change in the US unemployment rate as released on August 7, 2020, at 1230GMT. For July 2020, the unemployment rate declined from 11.1% to 10.2%, beating the 10.5% decline forecasted by analysts.

Now, let’s see how this news release made an impact on the Forex price charts.

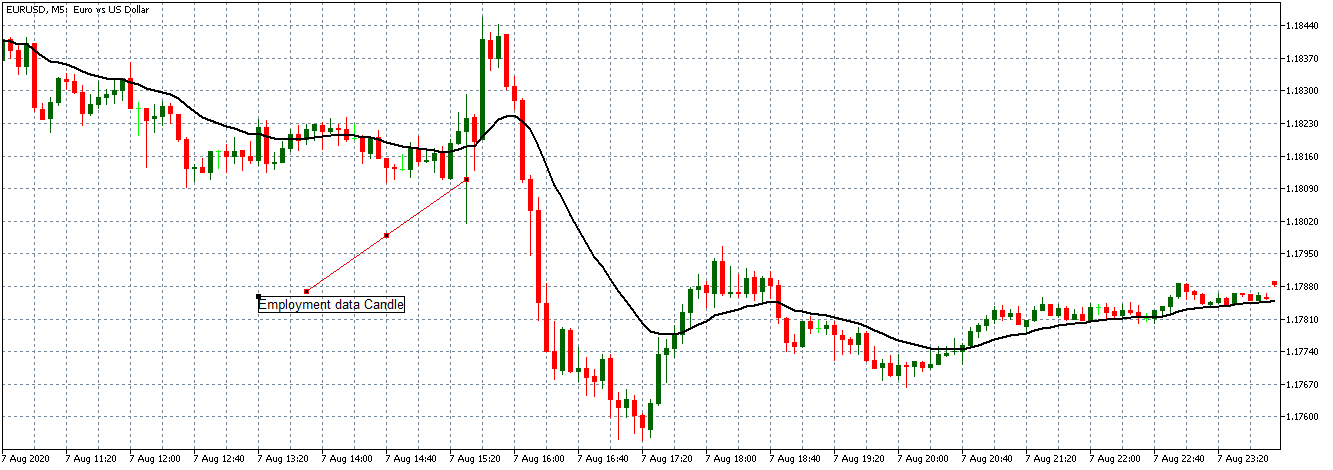
EUR/USD: Before Employment Data Release August 7, 2020, Just Before 1230GMT

The 30-minute EUR/USD chart above shows the market is on a downtrend from 0200 to 1200 GMT with the candles forming below the 20-period Moving Average. More so, the market was trading within a narrow price channel of between 1.1850 and 1.1810, indicating a calm market with traders waiting for the latest employment data to gauge the economic recovery.

EUR/USD: After Employment Data Release August 7, 2020, 1230GMT

As can be shown on the chart above, immediately after the news release, we can observe a sudden downward spike with a retraction. This spike indicates the market is having mixed reactions to the positive employment news hence the strong USD.

After the initial spike, the market can be seen to ‘absorb’ the positive news. The pair adopted a bearish outlook with the price breaking and staying below the earlier observed 1.1810 resistance level.

Since the pair had not shown any unexpected sudden swings before and after the new release, trading the news would have been profitable. For such a high impact economic indicator, it is advisable to open positions after the news release to avoid being caught on the losing end of the trend.

Now, let’s quickly see how this new release has impacted some of the other major Forex currency pairs.

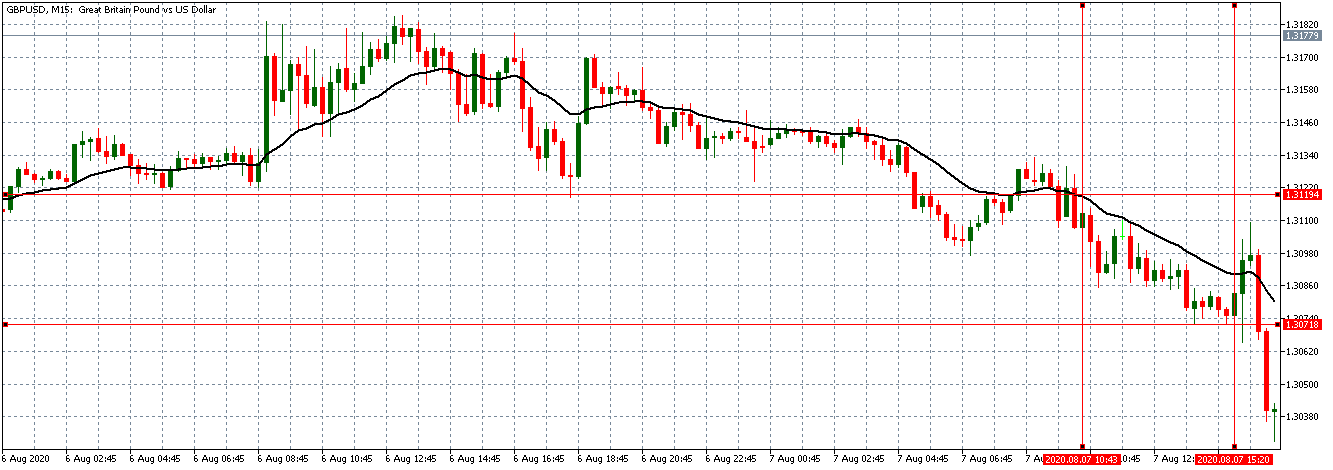
GBP/USD: Before Employment Data Release August 7, 2020, Just Before 1230GMT

GBP/USD: After Employment Data Release August 7, 2020, 1230GMT

The GBP/USD pair showed a similar trend as the one observed with EUR/USD. The pair can be seen to have traded within a narrow price channel of 1.3122 and 1.3071 from 0700 to 1200 GMT. After the economic data release, the pair similarly had a sudden spike. It later adopted the same bullish stand as the EUR/USD pair, with price breaking and trading below the observed resistance level.

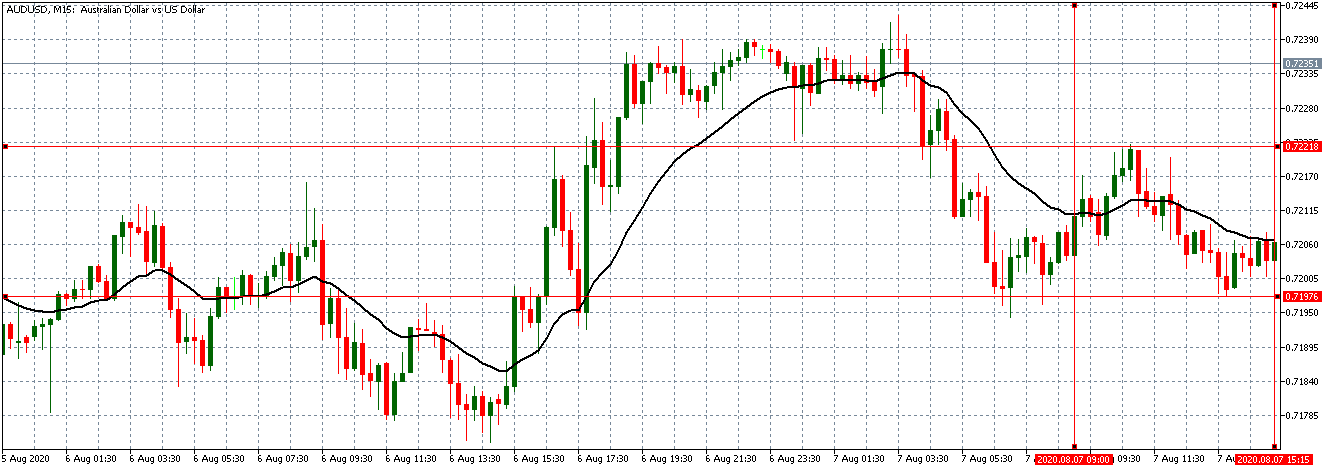
AUD/USD: Before Employment Data Release August 7, 2020, Just Before 1230GMT

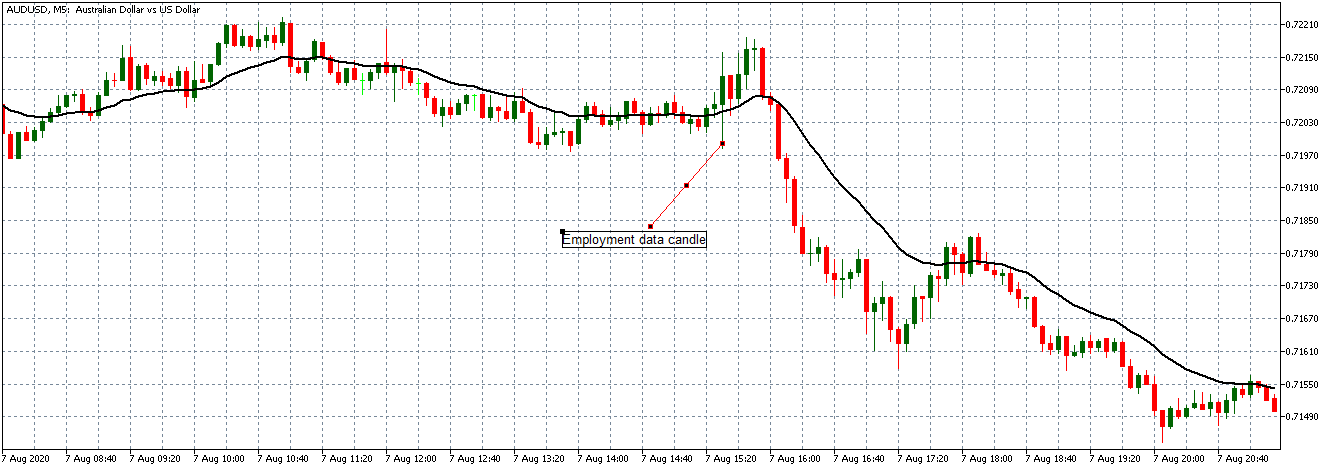
GBP/USD: After Employment Data Release August 7, 2020, 1230GMT

Similar to the EUR/USD and the GBP/USD pairs, the AUD/USD traded within a price channel of 0.7221 and 0.7196 and no unexpected spikes before the news release. After the news release, a sudden spike can be observed with an accompanying retraction, and later the pair adopted a bullish stance breaking below the observed resistance level.

From the above analysis, the subdued market volatility before the release of the employment data and the subsequent volatility, it is evident that the employment rate is high impact indicator anticipated by forex traders.

Categories
Forex Daily Topic Forex Fundamental Analysis

Understanding ‘Full-Time Employment’ Fundamental Forex Driver

Introduction

Full-Time Employment statistical figures are a good measure for long term economic growth. Understanding the difference between part-time and  Full-Time employment and its economic impact can help us better understand the long-term trends in economic growth.

What is a Full-Time Employment?

Employment

It is the state of having paid work. A person is considered employed if they do any work for pay or profit. People who are eligible for employment are between the age of 15 and 64 and are called the working-age population.

Full-Time Employment

As such, there is no fixed law defining and differentiating full and part-time employment. Conventionally 40 hours a week has been considered as Full-Time employment, but lately, deviations from this have been observed.

For instance, the United States Bureau of Labor Statistics (BLS) describes 35 hours or more per week as Full-Time employment. Conversely, 1 to 34 hours of work per week is considered part-time employment. The Affordable Care Act (ACA) explains Full-Time employees as those who are working for 30 or more hours a week.

How can the Full-Time Employment numbers be used for analysis?

Distinguishing between the part and Full-Time employment has benefits. Full-Time employment generally has the following benefits over part-time or contract-based employment:

Paid leaves: Full-Time employees are eligible to take leaves or vacation for which there would be no loss of pay. It is generally not applicable to part-time employees. Most part-time employees have a per hour payment. They are paid for the number of hours worked.

Healthcare plans: When an employee spends most of his life working for an organization, it is the company’s responsibility to take care of his health and well being. Full-Time employees enjoy the benefits of healthcare insurance for themselves and their family members as well. Health insurances secure employees against heavy financial losses during health emergencies. Part-time employees don’t generally have those benefits.

Pension plans: Full-Time employees are also given the benefits of retirement plans through pension funds or any other retirement scheme. It financially secures the employee in his/her old age, which is essential. Part-time employees generally do not have any such benefits and usually have to save for retirement themselves.

Job Security: During times of economic slowdown or even worse a recession, companies generally lay off their part-time and contract workforce first. Full-Time employees are their prime assets and generally are managers or professionals in the organization. Hence, Full-Time employees are generally less vulnerable to business and economic cycles.

Part-time employees could also be seasonal and find it hard to get work during off-seasons and are more vulnerable to business cycles.

It is easy to infer that the standard of living of Full-Time employees is generally better than that of their counterparts. As employees feel more financially secure in a Full-Time job, their spending habits would reflect the same. Credit eligibility also is more for Full-Time employees over part-time ones. Hence, in the long run, much of the consumer spending would likely be coming from Full-Time employees.

No one seeks part-time employment voluntarily, and no one wants to sit idle during certain quarters of a year. When companies are making long term progress in their profits rather than short-term gains during particular business cycles, a growth in Full-Time employment could be observed. When businesses are fully established in their sector and are marginally well-off, they opt to hire and retain Full-Time employees more. Otherwise, companies would rely on seasonal hiring and firing strategy only to keep the business running.

Policymakers giving the necessary support and means in terms of infrastructure, financial support, ease of doing business could help organizations to grow faster and offer better employment benefits. As more people from the labor force go into the full-time employment category, fewer people are working as part-time employees overall. When the majority of the labor force is full-time employed, we can expect a robust economy and steady economic growth that is immune to both domestic and international business and economic cycles.

Impact on Currency

Full-Time employment and its other half part-time employment only come into picture when we are trying to assess long-term economic growth and improvements in the citizens’ living standards. Hence, Full-Time employment statistics are more useful to policymakers who are committed to bringing wellbeing to their citizens through meaningful policies.

The currency markets are more concerned with the overall picture and the current business cycle’s impact on the currencies. Hence, Full-Time employment statistics, which are only part of the total labor force, do not move the markets like other employment indicators.

Full-Time employment is a low impact coincident indicator that is more useful for measuring long-term improvements in the quality of people’s lives for investors and policymakers only.

Economic Reports

In the United States, the Bureau of Labor Statistics (BLS) publishes monthly, quarterly, semi-annually, and yearly Employment Situation Reports on its website. The labor force statistics from the Current Population Survey details the nominal values of the full and part-time workers classifying them based on age, sex, race, and ethnicity. Full-Time employment reports are available monthly, quarterly, and annually.

Sources of Full-Time Employment

The United States Bureau of Labor Statistics Current Population Survey details Full and Part-time employment statistics in detail. The United States Bureau of Labor Statistics publishes monthly employment and unemployment reports that are very useful for market analysis. We can also find the same indexes and many others with a comprehensive summary and statistics of various categories on the St. Louis FRED that are relevant for our study. Consolidated reports of Full-Time employment for most countries can be found in Trading Economics.

Full-Time Employment Announcement – Impact due to news release

Full-time employment refers to the number of people working a specified number of hours or more per week at their main job or only job. The number of hours is fixed by the government, who later classify employees in different categories.

Traders and investors worldwide watch the indicator value closely as it tells about a country’s employment situation. For example, in Canada, if a person works 30 hours or more per week, he is considered a full-time Employee. One should expect high volatility in the currency during and after the news release.

The below image shows the employment change in Canada during May. We see that full-time employment increased in Canada by 219.40, which should be positive for the currency. Let us witness the impact of this news release on the Canadian dollar by considering various currency pairs.

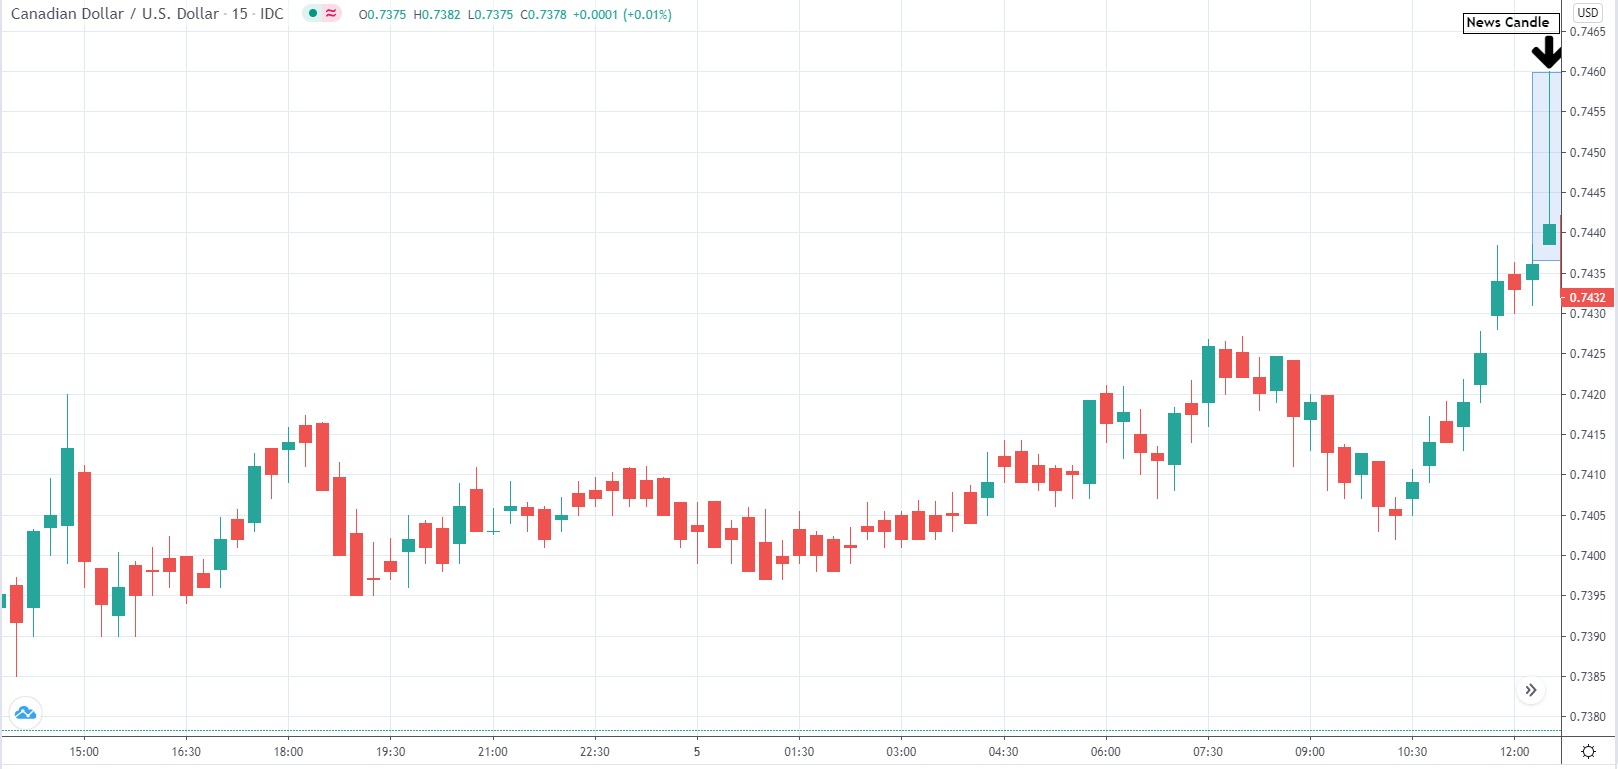
CAD/USD | Before the announcement

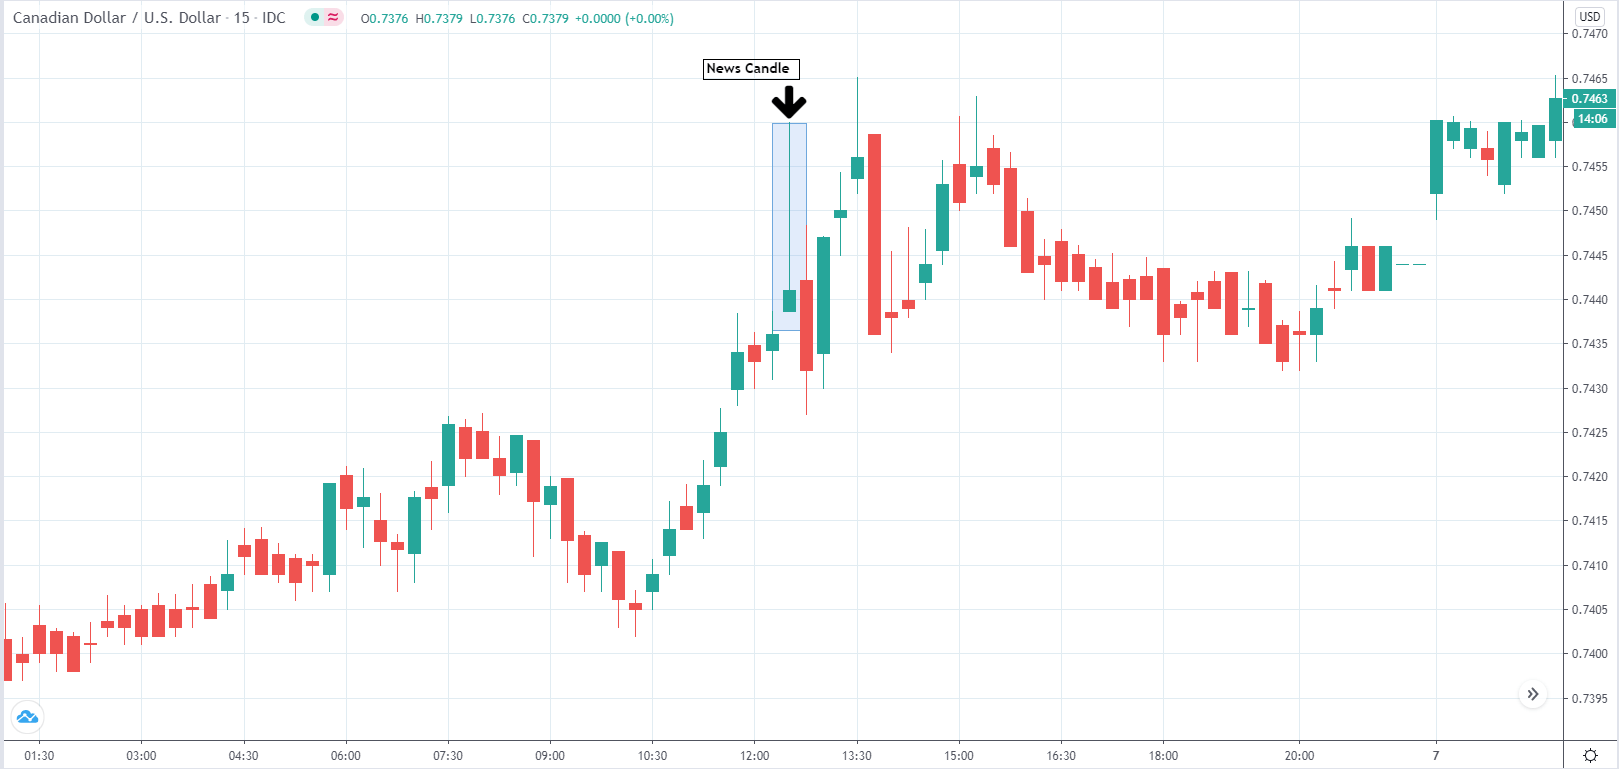
Let us start with the CAD/USD currency pair to observe the impact of full-time employment change on the Canadian dollar. The above snapshot shows the 15 minutes time-frame chart of the currency pair. The currency has been maintaining a range before the news announcement, and it is only three hours before the release, there seems to be a positive momentum building up for CAD/USD.

CAD/USD | After the announcement

After the news announcement, the price initially moves higher, but this is immediately sold, and the market erases most of the gains. The wick on top of the news candle indicates a strong buy sentiment that is carried over, and momentum continues to build up over the next days. As we can see, despite strong sell at the end-of-the-day positive momentum still built up and the market reached a new high than before the news announcement.

AUD/CAD | Before the announcement

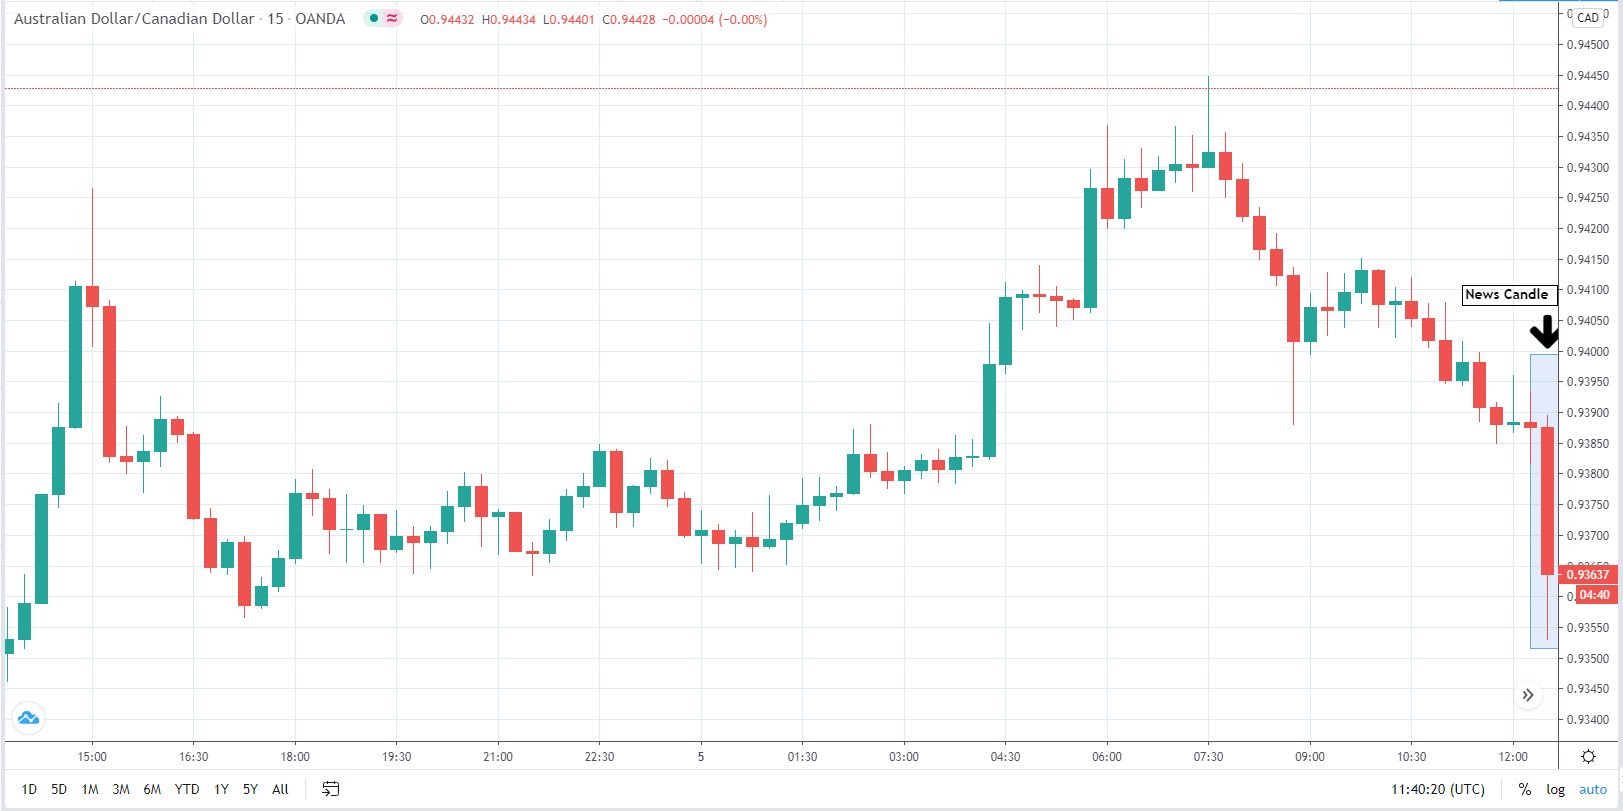
The above image is a snapshot of the AUD/CAD pair on a 15-minute time frame before CAD full employment data release at 12:30 GMT. As we can see before the news announcement, positive momentum was building up, and a downward trend started just hours before the news candle.

AUD/CAD | After the announcement

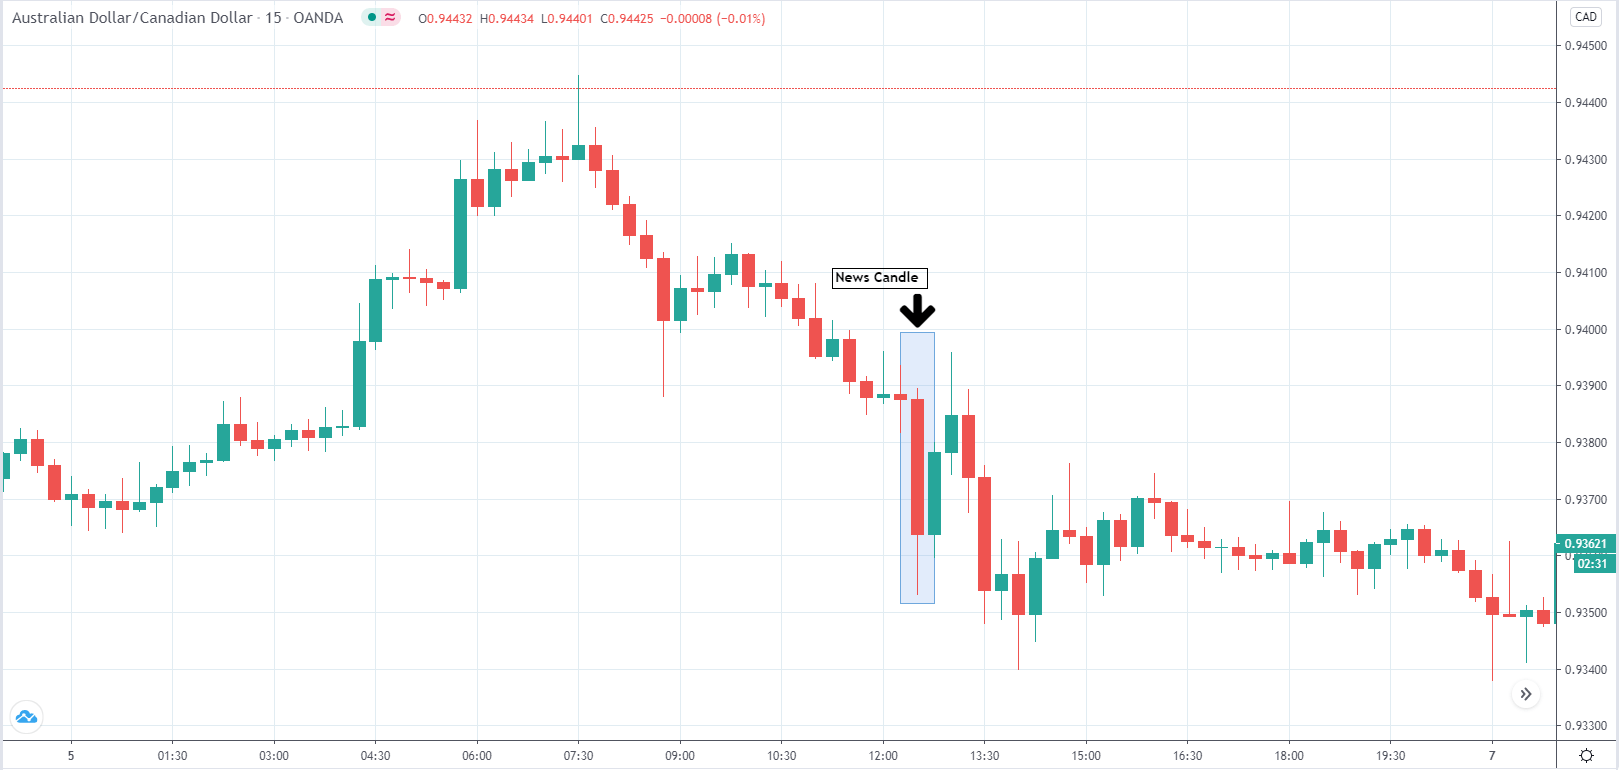
After the news announcement that came in favor of CAD, AUD/CAD falling momentum increases, and investors lose further confidence in AUD, and a strong sell is seen. That momentum is carried over to the next two days, and the AUD continues to fall against CAD.

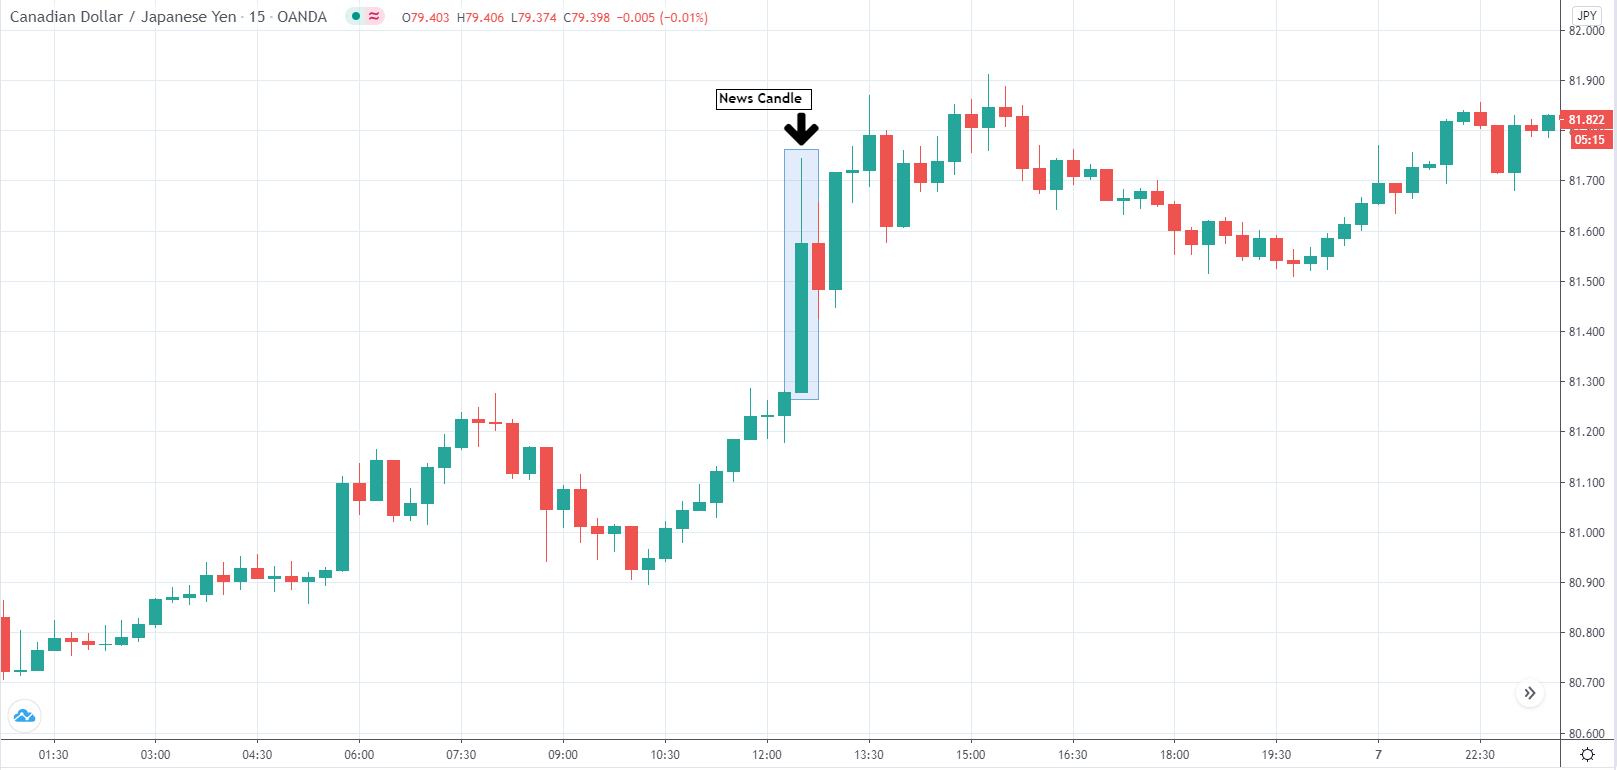
CAD/JPY Before the announcement

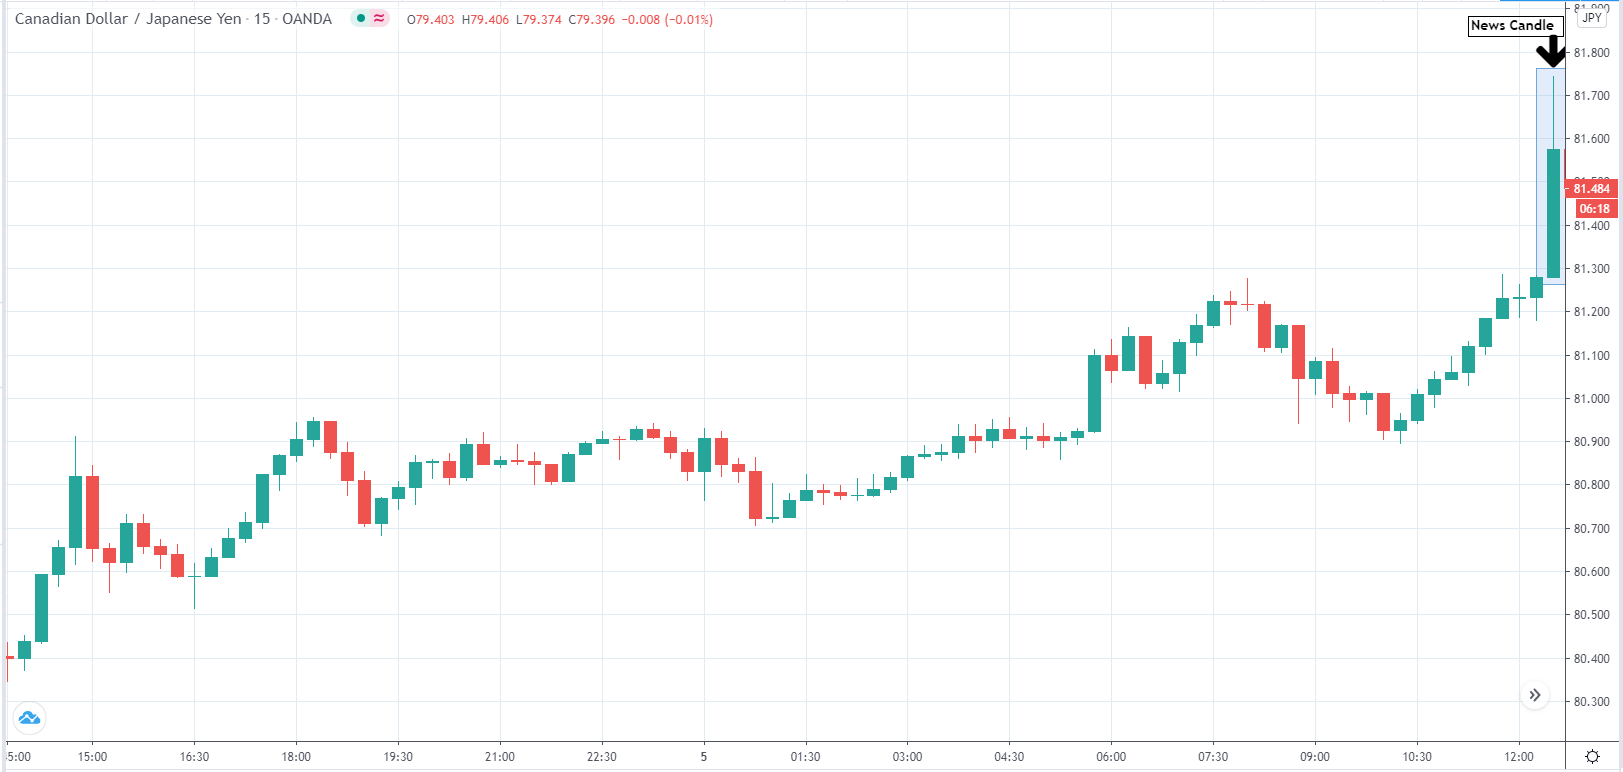
The above image is a 15-minute time-frame snapshot of CAD/JPY. Before the news announcement, there is no clear uptrend or downtrend.

CAD/JPY After the announcement

It is only after positive news for CAD through full-time employment report the uptrend is further amplified and continues throughout the next few days.

The full-time employment data was able to move currency in favor of CAD against significant currencies after the news announcement confirming the importance of the economic indicator.