Candlestick Reversal patterns: An Overview
Candlestick reversal figures are composed mainly of bu two or three candlesticks, which in combination harness the psychological power to shift the market sentiment.
Depending on the importance of the severity of reversal, their names vary. Japanese are very visual regarding the names they gave to them. Therefore, we can almost visualize them just by its name.
- Piercing pattern
- Dark cloud cover
- Engulfing pattern
- counterattack pattern
In this article, we will learn the following content:
- Overview of the reversal candlestick patterns
- how to identify a Bullish Piercing pattern and its specular Dark Cloud Cover pattern
- How important engulfing patterns are and how to recognize them
- Experience how counterattack figures lead to swift trend reversals.
The predicting power of two candle figures is sometimes astonishing. For a sample to be statistically significant, scientists need more than 20 samples for normally distributed phenomena, sometimes more. A reversal figure only shows eight data points. 2x (OHLC), and besides that traders most of the time, the reversal figure warns about a trend reversal or at least the end of the current trend.
The typical reversal pattern is a two candle figure that begins with a topping or bottoming candle followed by an opposite candle that erases partially or totally, the price action of the first one.
Piercing pattern and Dark Cloud Cover
The Piercing Pattern and the Dark Cloud Cover are specular patterns. The Piercing Pattern warns of a reversal of the bearish trend, whereas the Dark Cloud Cover heralds the end of a bullish trend.
Candlesticks are not always good predictors, and the Piercing Pattern is a weak signal, especially if the trend has not moved too deep yet. Of course, the most oversold is the price, the better a Piercing Pattern predicts a reversal. The Dark Cloud Cover, though, is seen to show much more predicting power.
Timeframes
The Japanese used them mostly in daily and weekly timeframes. The use of these two patterns in intraday trading must be confirmed with other signals, as, for instance, the Piercing Pattern occurring after hitting a significant support or a Dark Cloud cover as a result of a strong resistance rejection. The use of short-term oscillators such as 10-period stochastics or Williams percent R in combination with these two signals will improve the likelihood of success while trading them.
Recognizing a Piercing Pattern
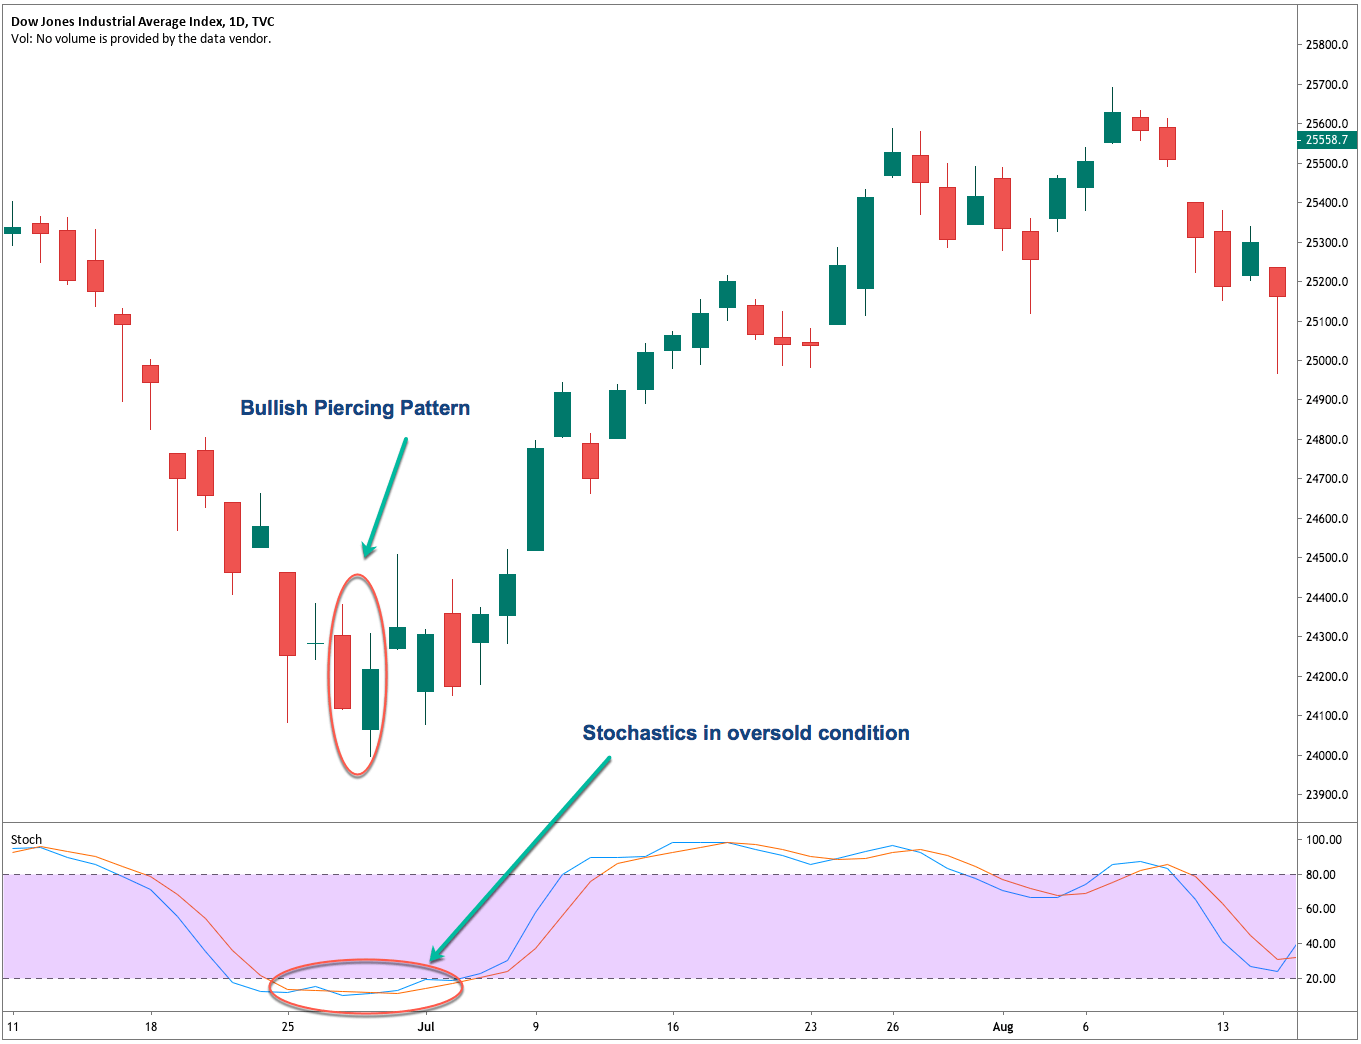
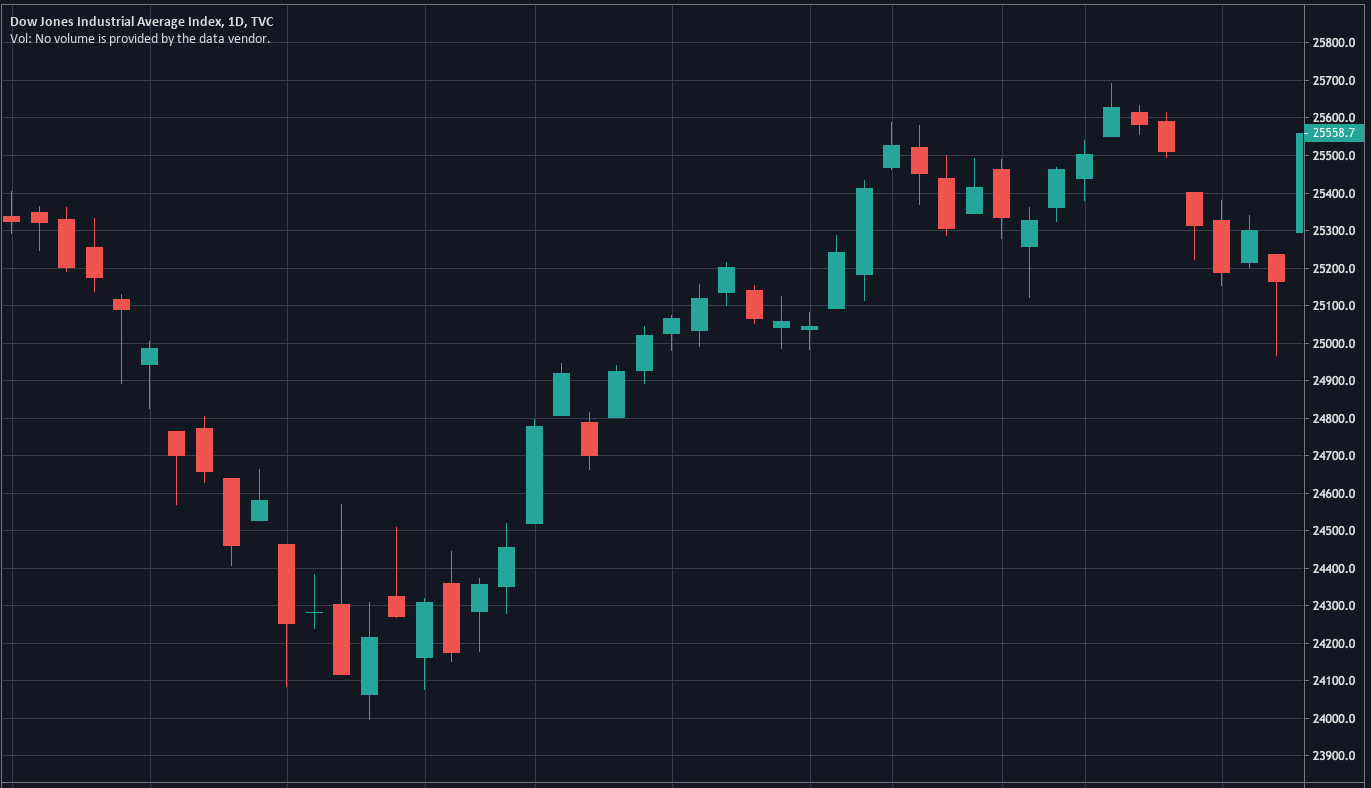
The bullish Piercing Pattern is composed of a large bearish body forming after a broad downtrend. The next candle begins below the low of the first black candle, and closes above the midway up, or even near the open if the preceding bearish candle.
Criteria:
- The first candle shows a black body
- The second candle shows a white body
- The Downtrend is clear and for a long time
- The second day opens below the range of the previous day
- the second white candle closes beyond the 50% of the range of the last day.
- The longer the candles, the better their predicting power.
- If there is a gap down, the greater, the better
- The higher the white candle closes, the stronger the signal
- A large volume during these two candles is significant.
The Dark Cloud Cover
Apply the specular conditions to the Dark Cloud cover. We also should remember that trading forex pairs make both patterns fully symmetrical.
Criteria:
- The first candle shows a white body
- The second candle shows a black body
- The upward trend is clear and for a long time
- The second day opens above the range of the previous day
- the second black candle closes below the 50% of the range of the last day.
- The longer the candles, the better their predicting power.
- If there is a gap up, the greater, the better
- The lower the black candle closes, the stronger the signal
- A large volume during these two candles is significant.
Final words
lease note that the Forex and crypto markets rarely have gaps. Therefore, the condition that the second open being below the range of the first candle is almost impossible to satisfy. In this case, we rely solely on the relative size of both candlesticks and the closing above 50 percent of the range of the black candle. Of course, it is almost impossible to get gaps in intraday charts except for spikes due to sudden unexpected events.
References:
The Candlestick Course: Steve Nison
Profitable candlestick Patterns, Stephen Bigalow