
Candlestick Patterns are widely used by traders to take entries and making money out of trading. We have come to know from Part 1 that relying on a candlestick formation only is not enough for a reliable entry signal. Other things need to be integrated with candlestick formation so that traders can trade accordingly. In this article, we are going to demonstrate an example of how an entry should be taken depending mainly on an engulfing candle as well as other equations that need to be maintained by traders.
Let us have a look at the chart below.
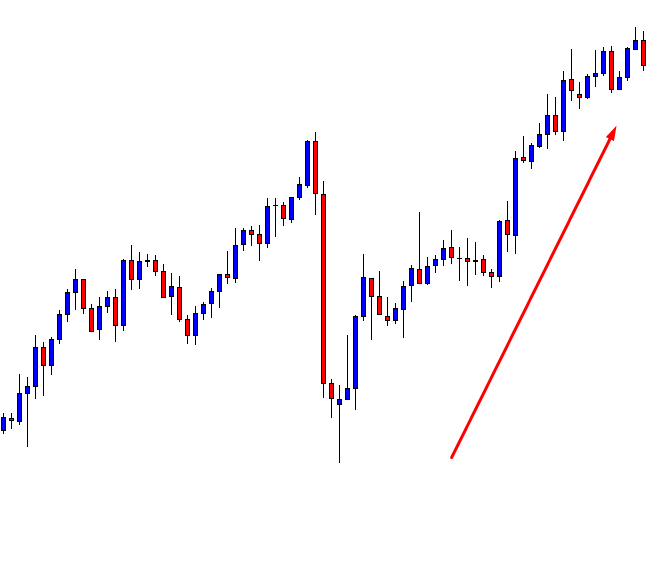
The chart above shows that the market is up-trending. At first glance, we shall look for buying opportunities here. However, look at the last candle. This is an engulfing candle which indicates that the sellers may take over. An engulfing candle is a strong sign of a trend reversal. However, we must not get carried away, but wait for other indications. In this case, we may wait for a breakout at the last swing low. Have a look at the chart.
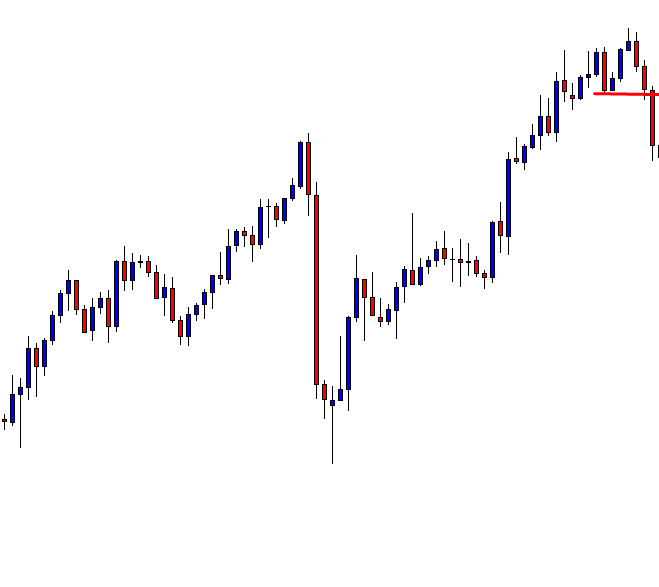
Pay attention to the red line. This is the last swing low where the price had a bounce and moved towards the North. Then, after finding a resistance, it produced a bearish engulfing candle; kept going down on the next candle and made a breakout with a huge bearish candle. This is now an ideal chart for the sellers to look for selling opportunities. The trend starts with an engulfing bearish candle. Candlestick pattern suggests that the sellers may take over. It has. It is pretty simple, right? Not really. Just go three candles back. Look at the same chart below.
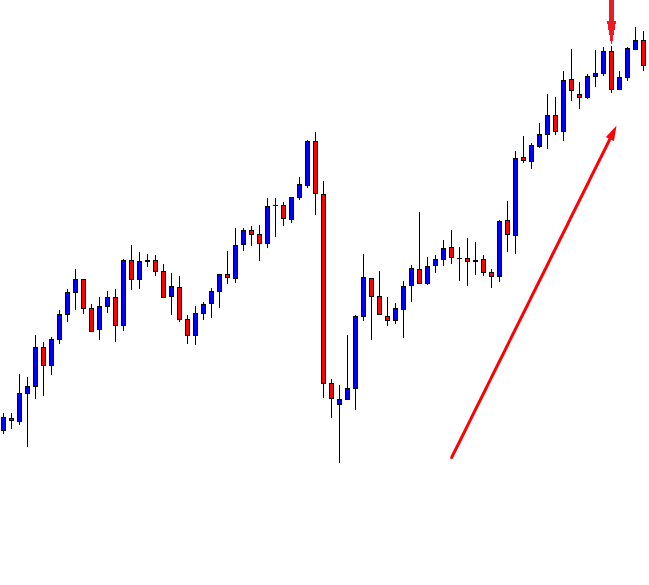
Pay attention to the arrowed candle. This is a bearish engulfing candle as well. That could have changed the trend and the price could have headed towards the South. However, that did not happen. The price kept going towards the North for three more candles then came down. Do you spot out the difference? The price did not make any downside breakout. In this case, if it had made a breakout at the nearest swing low, it might have come down from right there. Look at the chart below to get a better idea of which level I am talking about.
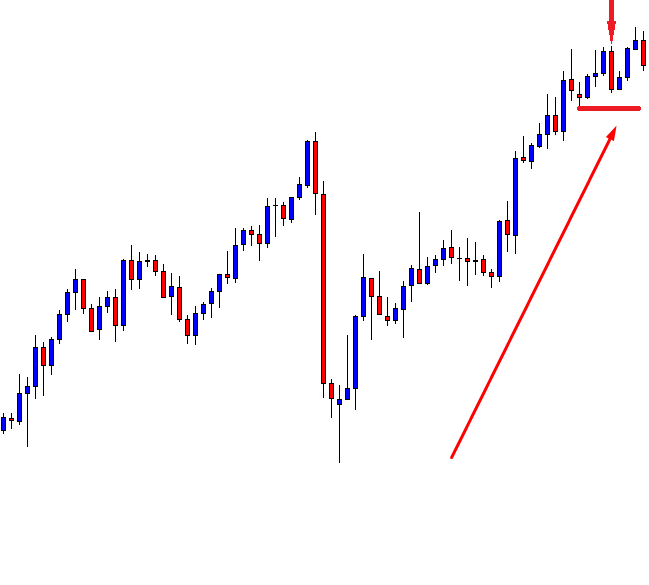
The drawn red level was the last swing low. If the price continued to go down and made a breakout at that level, it would have been a different ball game.
In this lesson, we have learned that Candlestick Pattern is a sign. In fact, is the first sign of a trend reversal. However, we need at least two more things to integrate with Candle Stick Pattern for taking an entry. These are:
- A Breakout at a significant level of support or resistance.
- The breakout is to have good momentum meaning the breakout candle is to be a good-looking bullish or bearish candle.
Stay tuned to get to know more about candlestick and integration in Part-3.